GISAID, the global database of virus sequences, has faced a lot of criticism recently from the virologists and bioinformaticians who rely on it—potentially hindering responses to future virus outbreaks.
First, there was controversy around genetic information from environmental samples taken at the Huanan Seafood Wholesale Market in Wuhan, China, which Chinese researchers posted to GISAID. An outside group of scientists found the sequences and analyzed them, finding the samples supported the hypothesis that SARS-CoV-2 originated in animals and jumped to humans at the seafood market. And then, GISAID revoked those scientists’ access to the database. (The original Chinese research group eventually published their findings.)
Last week, another controversy came to light: GISAID is claiming that the first SARS-CoV-2 sequence to be publicly shared was posted on its platform, back in January 2020. Even though plenty of evidence suggests the first sequence was shared days earlier at virological.org, a virology forum. Reporting in Science Magazine and evidence shared on Twitter shows the true story of these early days of info-sharing, as well as how GISAID has tried to retroactively revise the narrative.
While these issues might seem inconsequential outside of a small circle of experts, the controversies could lead some of the world’s top virologists and epidemiologists to stop using a major source for outbreak information. It doesn’t really matter who posted a SARS-CoV-2 sequence first. But it does matter that experts have trusted places to share data and collaborate on vital research.
Without open data-sharing platforms like GISAID, the world may be less prepared for coming novel disease outbreaks. These recent controversies (and the broader debate over COVID-19’s origins) also speak to larger gaps in trust that could hinder future collaborations.
CDC publishes list of archived data pages: As the CDC prepares to shift its COVID-19 data publication efforts when the federal public health emergency ends in May, the agency has published a list of COVID-19 data and visualization pages that are no longer receiving updates. These archived pages include vaccination demographics, COVID-19 outcomes among pregnant people, data from correctional facilities, and more. I expect the list will get longer as we approach May 11, though the CDC is still updating core COVID-19 metrics (like cases, deaths, wastewater surveillance, etc.).
One federal COVID-19 emergency may end sooner: Speaking of ending emergencies: you might have seen some news this week about a Republican bill to end COVID-19’s emergency status, which President Biden has announced he would not veto if it comes to his desk. It’s important to note that this is actually a different emergency declaration than the public health one, which is under the control of the federal Department of Health and Human Services (HHS). The public health emergency is still slated to end on May 11, and its implications for COVID-19 tests, treatments, and vaccines have not changed. Also, related: this story in STAT explains the federal funding that’s currently left over for COVID-19 response.
Firearm injuries rose during COVID-19: A new report from the CDC shows how emergency department visits due to firearms rose during the pandemic. Compared to a 2019 baseline, these vitis were 37% higher in 2020, 36% higher in 2021, and 20% higher in 2022, the researchers found. Firearm injuries and deaths are another example of how COVID-19 contributed to higher excess morbidity and mortality; while these injuries weren’t directly caused by the coronavirus, they may be connected to the social and economic unrest that the U.S. faced over the last three years.
County Health Rankings 2023: This week, the County Health Rankings initiative at the University of Wisconsin Population Health Institute released its 2023 data. These rankings cover a wide array of health-related metrics, from health behaviors like alcohol and drug use to physical environment factors like air quality. The database may be a helpful resource for reporters or researchers looking to understand how their communities compare to others, while the organization’s 2023 report offers national health trends.
Global health workforce statistics: This database from the World Health Organization details how many health workers are employed around the world and over time. Statistics cover a variety of different health professions (doctors, specialists, nurses, dentists, pharmacists, etc.) and up to 20 years of data, depending on the country. While the dataset doesn’t cover through the pandemic—2020 is the most recent year included —it still shows how health workers have declined in many places over the last couple of decades. (H/t Data Is Plural.)
Public health worker declines: Speaking of health workers: a new study, published in the journal Health Affairs, shows how the public health workforce in the U.S. has severely declined during the pandemic. The researchers used data from a workforce survey conducted in 2017 and 2021, comparing past “intent to leave or retire” with actual rates of workers leaving. Nearly half of the state and local public health workers in the survey sample left between 2017 and 2021, the researchers found. This paper shows how recruitment and retention among health workers drastically needs improvement.
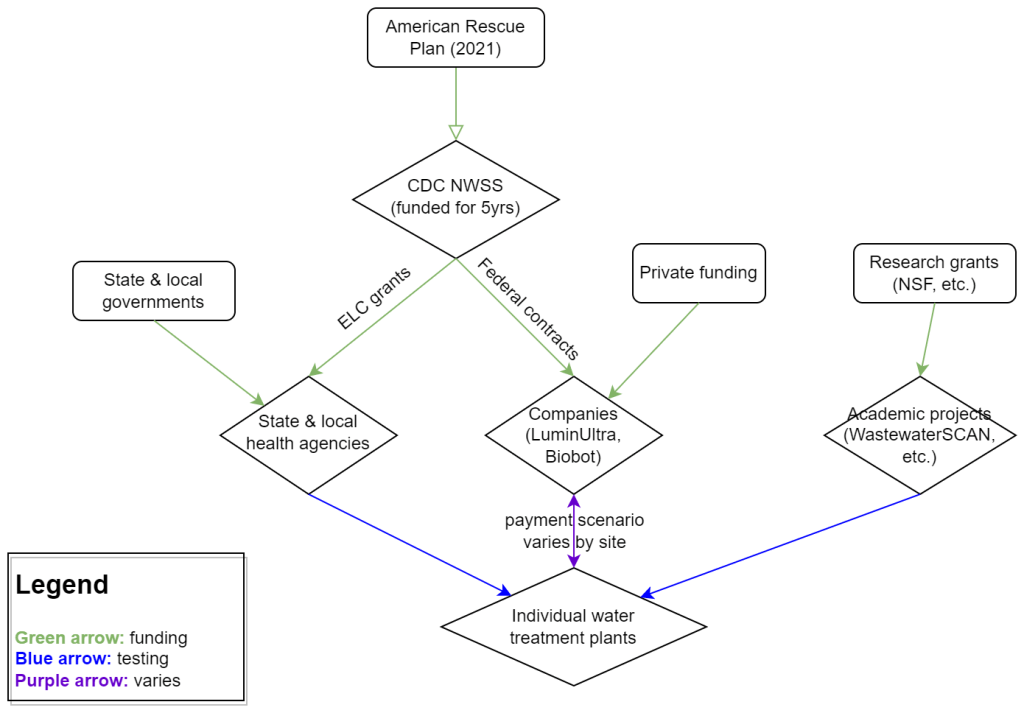
My attempt to explain the wastewater surveillance funding ecosystem in one diagram. (Credit: Betsy Ladyzhets)
This week, I have a new story out in Scientific American about why the wastewater surveillance infrastructure built during the pandemic may not last in the long term. While current monitoring projects aren’t likely to go anywhere right now, issues with funding, uneven commitments at state and local levels, and the overall novelty of this field may lead those programs to shut down in the coming years.
Here’s the story’s opening paragraphs:
During the past three years of the pandemic, testing sewage water for the virus that causes COVID has become a valuable tool: it has spotted surging infections and new variants weeks before they showed up in medical clinics, for instance. The technology has also warned of other health threats such as seasonal viruses and increased opioid use.
But now its long-term ability to protect public health is in jeopardy. Funding uncertainty from the federal government and uneven commitments from state health departments have raised the specter that wastewater monitoring programs may shut down in the future.
The U.S. Centers for Disease Control and Prevention’s National Wastewater Surveillance System (NWSS), which includes the majority of wastewater testing sites in the U.S., is “fully funded through 2025,” says Amy Kirby, director of the program. But after that, “new sources of sustainable funding” are needed, Kirby says, ideally through the CDC’s regular budget rather than resources tied to COVID. Uncertainty about money—along with logistical challenges and questions about how to interpret data from this relatively novel source—has made some state governments hesitant to invest in the technology, leading to an uneven national system.
My reporting for this piece involved interviews with the CDC, state and local public health agencies, and other major wastewater organizations (Biobot, WastewaterSCAN). I learned a lot about the overall ecosystem for funding wastewater surveillance, including a lot of somewhat-technical details that didn’t make it into the SciAm story. So, I’m sharing some of those details here.
Where wastewater surveillance funding comes from:
The primary funder for wastewater monitoring programs across the U.S. is CDC NWSS. The CDC itself received funding through the American Rescue Plan in 2021, sufficient to fully fund NWSS through 2025.
That CDC funding has gone in two main directions. First, the CDC has funded state and local public health agencies to set up (and maintain) their own wastewater testing projects. This is how most of the states with robust programs (places like New York, Utah, Virginia, Ohio) have funded their efforts. State and local health agencies may also receive funding from their own local governments, though most of the agencies I talked to for my story said they were primarily relying on the CDC. New York State is one major example of a state government funding wastewater surveillance right now.
And second, the CDC has set up national contracts with wastewater testing companies to supplement NWSS in places where monitoring otherwise might not be happening. The agency first contracted with LuminUltra in early 2022, then switched to Biobot Analytics last spring. Earlier this year, Biobot’s contract with the CDC was extended for six months, through July. After that, the agency plans to enter a new, five-year contract with a wastewater testing company that will cover COVID-19 as well as other emerging diseases, like mpox. This contract could go to Biobot or another company; the CDC is currently going through an application process.
Biobot and other private companies like it are also receiving funding from private sources, such as venture capital firms. In addition, individual water treatment facilities, local governments, and even businesses might set up contracts with private companies to help them test the wastewater in their jurisdiction. For example, Toronto’s Pearson Airport has contracted with LuminUltra to test wastewater from the airport terminals. In these cases, funding is coming from the specific organization that wants testing, rather than a larger program. Biobot also tests at hundreds of sites for free through its Biobot Network, in exchange for sharing the data publicly.
Finally, there’s a whole separate ecosystem of academic wastewater surveillance efforts, mostly run by university labs or research centers. WastewaterSCAN is the biggest example of this right now; the project was founded at Stanford and Emory Universities, but has since expanded through grants and philanthropic funding to cover about 150 sites across the country. Most academic projects either partner with specific treatment facilities in their areas or test the sewage on their campuses—SCAN is an exception with its broader scale.
Concerns for wastewater surveillance’s long-term future:
As you can probably tell by this description of the funding landscape, wastewater surveillance in the U.S. is pretty complicated. When scientists started testing wastewater for SARS-CoV-2 in spring 2020, this was basically a grassroots effort with different research projects across the country trying out different things. CDC NWSS has worked hard to compile data into one national system and develop standards, but the system is still far from unified.
For the CDC program to continue its efforts, the agency needs more long-term funding—and this funding shouldn’t be tied to COVID-19. The potential for wastewater surveillance to inform public health decisions goes far beyond this pandemic, and funding should reflect that potential; also, no COVID-specific funding packages have passed Congress since the American Rescue Plan, in 2021.
One way Congress could do this would be by expanding a funding system called “Epidemiology and Laboratory Capacity for Prevention and Control of Emerging Infectious Diseases,” or ELC. Most wastewater grants to state and local health agencies over the last couple of years have gone through ELC, though the funding came from the American Rescue Plan. Many of the health officials I talked to for my story like ELC, know how to fill out the annual applications, and would want to keep using it to receive wastewater funding.
Before the pandemic, the ELC program was drastically underfunded, I learned from experts at the Association of Public Health Laboratories (APHL). States’ applications historically “vastly exceed the money that CDC is given to put out for them,” APHL policy officer Peter Kyriacopoulos told me. APHL recommends that Congress should expand the program’s funding from $300 million per year (its pre-pandemic benchmark) to $800 million per year, or more. The ELC program is up for renewal this year, which could be an opportunity for Congress to add more permanent funding for wastewater surveillance and other epidemiological efforts.
More permanent funding could go a long way in convincing more state health agencies to invest in wastewater surveillance programs, rather than relying on outside assistance from companies like Biobot or academic partners. More data and guidance on how to actually use wastewater data to inform public health decisions would help, too, since many agencies are still figuring this out. Such investment at the state level would help make the country’s wastewater infrastructure more comprehensive, and more capable of responding to new health threats.
Instead, right now, we have an uneven system. Some places are regularly monitoring for COVID-19 and easily able to expand to new testing targets, while others might lose this valuable data source in the next year or two. For any local reporters reading this, I highly recommend digging into your community’s wastewater surveillance system, and figuring out whether it’s set up for the long term.
In the past week (March 23 through 29), the U.S. officially reported about 140,000 new COVID-19 cases, according to the CDC. This amounts to:
An average of 20,000 new cases each day
43 total new cases for every 100,000 Americans
9% fewer new cases than last week (March 16-22)
In the past week, the U.S. also reported about 17,000 new COVID-19 patients admitted to hospitals. This amounts to:
An average of 2,400 new admissions each day
5.1 total admissions for every 100,000 Americans
5% fewer new admissions than last week
Additionally, the U.S. reported:
1,600 new COVID-19 deaths (230 per day)
88% of new cases are caused by Omicron XBB.1.5; 5% by XBB.1.9.1; 2% by XBB.1.5.1; 0.4% by CH.1.1 (as of March 18)
An average of 40,000 vaccinations per day
While official COVID-19 cases and hospitalizations continue to trend ever-so-slightly downward, wastewater surveillance data show potential new upticks in transmission. Despite continued minimal safety measures in most places, we have to remain wary of a potential spring surge.
Official data from the CDC suggested that cases and new hospital admissions dropped very slightly last week, compared to the week prior. But case data continue to be plagued with reporting delays; again this week, multiple states (Florida, Delaware, Mississippi, Oklahoma) reported no cases or had other issues. These delays make it difficult to assess patterns at state or county levels.
Wastewater surveillance data provide more accurate early warnings about potential rising transmission. This week, Biobot’s data suggest slight increases in all four major regions of the country. It’s worth noting, though, that Biobot’s most recent data are preliminary. I’ll be closely watching the dashboard’s next updates, this coming Tuesday and Thursday.
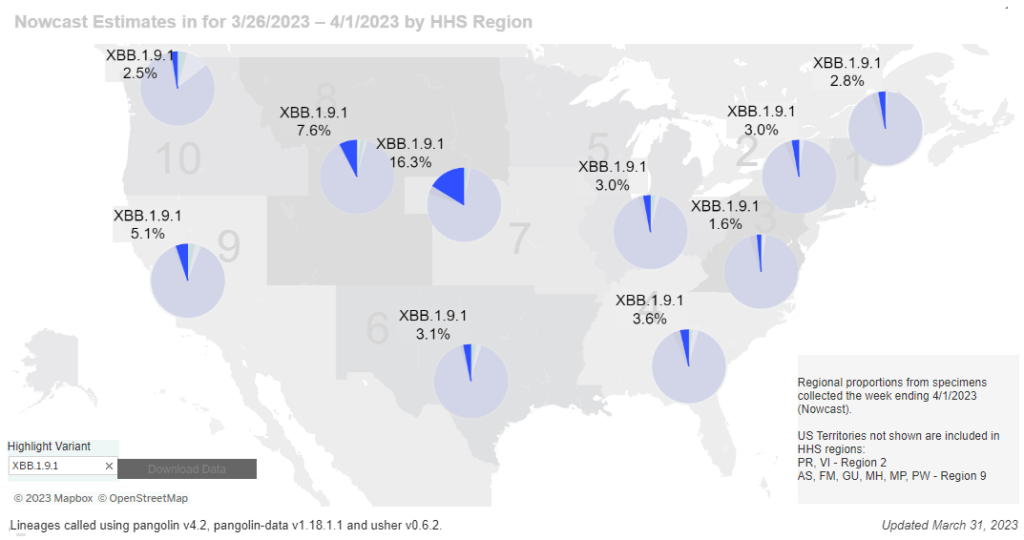
The latest Omicron variant of concern, XBB.1.9.1, could be one reason for increasing coronavirus levels. This subvariant caused an estimated 5% of new cases across the country nationwide last week, according to the CDC’s Nowcast analysis. At the same time, XBB.1.5 has declined for the first time since it emerged a couple of months ago, suggesting XBB.1.9.1 might slowly outcompete it.
XBB.1.9.1 is most prevalent in the Midwest, particularly the region including Iowa, Kansas, Missouri, and Nebraska. Some counties in this region are also reporting significant coronavirus increases in their wastewater, according to Biobot and WastewaterSCAN. Missouri’s wastewater dashboard similarly shows increases across the state.
In our current era of high background coronavirus spread (and few-to-no widespread safety measures), a new variant can easily cause concerning outbreaks. It’s important to remember that, no matter how much the virus evolves, simple measures like masks and ventilation can still make transmission less likely.
A few weeks ago, I learned that the WastewaterSCAN project has a newsletter, which shares updates about COVID-19 and other diseases nationally and for the Bay Area in California. It’s a helpful resource for following infectious disease trends.
WastewaterSCAN, for any readers who might be unfamiliar, is a wastewater surveillance project founded by researchers at Stanford and Emory Universities. The project started in 2020 by monitoring wastewater in the Bay Area for SARS-CoV-2, but has since expanded to about 150 sites nationwide and six testing targets: the coronavirus, flu, RSV, mpox, norovirus, and human metapneumovirus (HMPV).
In the newsletter, the SCAN team shares summary data about all of these diseases, as well as some variant analysis for SARS-CoV-2. The language is sometimes a bit technical (as its primary audience is the team’s academic and public health partners), but still very useful for seeing where diseases are rising or falling. SCAN’s local updates are especially helpful for anyone living in the Bay Area.
Also, the SCAN team recently had a paper published in the Lancetdiscussing their work monitoring wastewater for diseases beyond COVID-19. The new article shows this technology’s potential for broader public health surveillance.
Paxlovid may lower risk of Long COVID: Taking paxlovid in the acute phase of a COVID-19 case may lower a patient’s risk of long-term symptoms by about 25%, according to a paper published this week in JAMA Internal Medicine. The paper, which summarizes an analysis of health records in the Veterans Affairs database, was originally posted as a preprint in the fall; lead author Ziyad Al-Aly and his colleagues at the St. Louis VA did more number-crunching during the peer review process. Several clinical trials (including one just announced at Yale this week) will test paxlovid as a potential treatment for Long COVID, with a longer course than people typically take during the acute disease.
Estimating true vaccination rates in the U.S.: A new report from the COVID States Project, a group of academic researchers focused on connections between social behaviors and COVID-19 spread, provides estimates of vaccination rates by state in the U.S. The researchers compared vaccination data from the CDC to polling sources, including the Kaiser Family Foundation and original polling conducted by the COVID States Project. They found that CDC data often diverged from survey data, suggesting that the public health agency’s information has errors due to the CDC’s inability to connect disparate immunization records from different states. (In other words, if someone got their primary series in one state and a booster in another, they might show up twice in the CDC’s data.)
Comparing COVID-19 outcomes by state: Another report looking at state-by-state data: researchers at the University of Washington’s Institute for Health Metrics and Evaluation compared COVID-19 death rates to state actions on COVID-19. The researchers found that states with higher poverty, more income inequality, higher Black and Hispanic/Latino populations, and less access to healthcare faced higher COVID-19 rates. States where more people voted for Trump in 2020 also saw more COVID-19. These patterns “seem to reflect the release of public health mandates” in more Republican states, journalist Amy Maxmen wrote in a Twitter thread summarizing the study.
COVID-19 origins docs, raccoon dog analysis: Federal intelligence documents about investigations into the coronavirus’ origins will be declassified in the coming months, as required by a new law that President Biden signed this week. The law specifically requires that the Director of National Intelligence release “all information relating to potential links between China’s Wuhan Institute of Virology and COVID-19.” This information will first go to Congress, and then may become public. Meanwhile, there’s been some controversy about a recent analysis of viral samples at the Huanan Seafood Wholesale Market in Wuhan: news about this analysis was shared in the media before a scientific report was completed, and some researchers who worked on the analysis had their access to sequence repository GISAID revoked. This article in Science Magazine has more details on the situation.
Increased Candida auris spread during the pandemic: C. auris is a pathogenic fungus that has developed resistance to multiple common drugs, and that can pose a serious threat to human health. (Yes, a fungus similar to the one that causes a pandemic in “The Last of Us”—though C. auris doesn’t turn people into zombies.) The fungus has spread more widely during the pandemic according to a recent CDC report, with a 44% increase in cases from 2019 to 2021. Other types of anti-microbial resistance have been on the rise as well, as COVID-19 led to less rigorous monitoring and heightened antibiotic use in many hospitals. More recent CDC data on the fungus are available here.
It’s an unfortunate reality in the Long COVID media landscape that a lot of journalists and commentators write about this condition without really doing their research. I frequently see articles that misunderstand key aspects of Long COVID or dismiss patients’ experiences.
Two recent stories (one in the Washington Post and one in Slate) make these mistakes, in fairly high-profile outlets. I’m not going to link to the full pieces here to avoid giving them more attention, but I wanted to share a bit about what these stories get wrong, to help readers recognize similar issues in other pieces.
The Washington Post piece discusses results from a data analysis project that the news outlet did in collaboration with Epic, an electronic health records company that has access to anonymized data from millions of people. Researchers evaluated whether patients had sought medical care for common Long COVID symptoms following a positive COVID-19 test. According to this analysis, Long COVID symptoms have become less common during the Omicron era compared to earlier COVID-19 waves—which may sound like a promising conclusion, until you recognize the analysis’ flaws.
Epic and the Washington Post didn’t share the full data behind this analysis, which makes it difficult to fully evaluate. But the public methodology provides enough information to be critical. First of all, relying on electronic health records for Long COVID leaves out a lot of people. Many of the people most vulnerable to this condition have limited access to PCR tests and to the doctors who might help them diagnose new symptoms, and PCR tests in particular have only gotten harder to access since early 2022.
Second, this analysis focused on people who had new symptoms after COVID-19—and excluded people who had existing symptoms that might overlap with Long COVID before they got hit by COVID-19. This focus leaves out people with preexisting conditions (i.e. other chronic diseases), who tend to be at higher risk for Long COVID. Epidemiologist Deepti Gurdasani has a helpful Twitter thread explaining this issue in detail:
Please don't put out poorly thought out 'research' like this- These comparisons are heavily flawed and serve only to massively underestimate the impact of long COVID & serve abelist narratives. 🧵 pic.twitter.com/cYUAQJvDV2
Meanwhile, the Slate piece dismisses Long COVID, arguing that the condition is “neither as common nor as severe” as experts have warned it might become. Like the Washington Post piece, this article bases its conclusion on flawed research that focuses on biased health records, and other types of biased data. For example, the author argues that people aren’t getting social security disability benefits in large numbers; but Long COVID patients face many barriers to this program, as I’ve covered for KHN.
The Slate article fails to cite Long COVID patients or experts who have cared for those patients. It also fails to include extensive research showing that Long COVID can mean lasting damage to many organ systems. In fact, Slate issued a correction to the piece shortly after it was published, explaining that, yes, research has “identified biological changes” associated with Long COVID. (The author initially wrote that there were “no biomarkers” for Long COVID.)
I’ve signed onto a letter demanding that Slate retract this article, along with hundreds of other journalists, researchers, and clinicians with Long COVID expertise. You can read it and consider signing here.
These two articles fall into a similar trap: they cherry-pick evidence to suggest that Long COVID might not be as common as some experts and patient-advocates say it is. But they ignore substantial evidence showing how widespread and how damaging the condition actually is. And furthermore, even if Long COVID is getting “milder” or “rarer” with Omicron, so many people have been infected by it (and by prior variants) that there are still millions out there who need help. Arguing over prevalence distracts from the true story: people are suffering, and they need support.
It’s important to note that the majority of journalists covering Long COVID are doing so in good faith, simply trying to understand a complex and confusing condition. But it can be easy to make mistakes (like citing the wrong evidence, or failing to talk to a person with Long COVID). Plus, some bad actors have shown up in the media again and again; the author of the Slate article, for example, previously wrote a highly discredited story for New York Magazine.
For other journalists covering this topic, I’m always happy to help answer questions or point folks to resources. The tipsheet I compiled for NICAR might be a good place to start. And for editors assigning these stories: please make sure you’re giving assignments to a credible writer.
The Health Equity Tracker, run by the Morehouse School of Medicine’s Satcher Health Leadership Institute, is one of a few COVID-19 dashboards that is not shutting down at this time.
We are in an era of dashboard shutdowns. Government agencies, research groups, and media organizations alike are winding down their COVID-19 reporting efforts. Some of these changes are directly tied to the end of the federal public health emergency in May, while others are more broadly attributed to shifting resources.
I haven’t done a comprehensive review of state and local COVID-19 dashboards, but I’m sure many of those are similarly shutting down, reporting less frequently, and reducing the types of data that they offer to the public. This is a trend I’ve been following since early last year, when state health departments started to declare COVID-19 was now “endemic” and didn’t require special monitoring resources, PCR testing infrastructure, etc. But it’s been accelerating in recent weeks, following the White House announcement about the end of the federal emergency.
When explaining why their COVID-19 reporting efforts are ending, organizations often state that the disease is “no longer a major threat” or say that public interest in tracking COVID-19 has waned. I’m skeptical about both of those claims. First of all, we know that COVID-19 is still killing hundreds of Americans each week, with a majority of those being people who have had multiple vaccine doses. And we know that millions are facing activity limitations from Long COVID. As I wrote last month, the U.S. didn’t have a “mild” winter this year; we’re just getting better at ignoring COVID-19’s continued impacts.
And second of all, I know there’s still an audience for this work—including many of the people who remain most vulnerable to COVID-19. Thank you to everyone who regularly reads this newsletter and blog, sends me questions, shares my work on social media, etc. for constantly validating that the interest is still here.
With all of you great readers in mind, I’ve compiled this list of COVID-19 dashboards that I know haven’t yet shut down. The list is focused on national sources rather than state/local or international ones, in the interest of being most helpful to the majority of readers.
CDC COVID Data Tracker: The CDC’s COVID-19 dashboard is, of course, the primary source for federal data at this point in the pandemic. It provides weekly updates for most metrics (cases, hospitalizations, deaths, vaccinations, variant estimates, etc.); wastewater surveillance data are updated daily, with individual testing sites reporting on different cadences (usually about twice per week). Post-PHE update: Still active, but greatly changed. Cases and testing metrics are no longer available (with testing labs and state/local health agencies no longer required to report to the CDC), while other key metrics are updated less frequently or with more of a delay. See this post for more details.
Census Household Pulse Survey: Since early in the pandemic, the U.S. Census’ Household Pulse Survey has provided data on how COVID-19 impacted Americans’ day-to-day lives. This survey’s most recent iteration is scheduled for March through May 2023. The Census collaborates with other federal agencies on its surveys, including the CDC for Long COVID questions. Post-PHE update: The Pulse survey is typically conducted in two-month installments, with several weeks between each installment to adjust questions and process data. Its most recent installment ended in early May, and the next one has yet to be announced; we should know within the next month whether this data source is ending with the PHE or if it will continue.
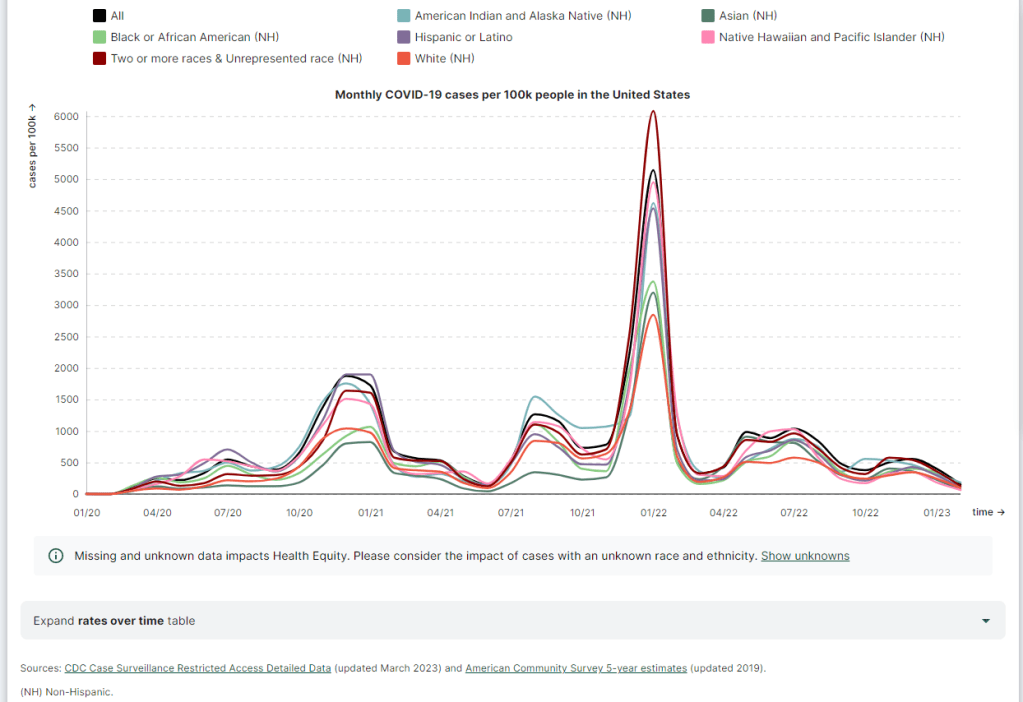
Morehouse Health Equity Tracker: This project, from the Satcher Health Leadership Institute at the Morehouse School of Medicine, tracks COVID-19 metrics and a variety of other health conditions by race and ethnicity. The COVID-19 data are based on a CDC restricted access dataset; updates will continue “for as long as the CDC gives us data,” software engineer Josh Zarrabi said on Twitter this week. Post-PHE update: For COVID-19 data, this tracker utilizes a CDC dataset of cases with detailed demographic information, compiled from case reports sent to the CDC by state health agencies. The CDC dataset was last updated in April 2023, and it’s unclear whether it’ll be updated again (but my guess is it’ll end with the PHE). The Morehouse tracker includes plenty of other health metrics, though, so I expect this dashboard will be able to adjust to the CDC change.
APM Research Lab: This research organization, run by American Public Media, has several ongoing COVID-19 trackers. These include COVID-19 deaths by race and ethnicity (national and by state), vaccination rates (national and by state), and Minnesota-specific data, in collaboration with Minnesota Public Radio. Post-PHE update: APM is continuing to update its tracker; the most recent update to its COVID-19 deaths by race and ethnicity page occurred on May 17. Its staff will likely need to make some changes to their underlying data sources, since the CDC is now reporting COVID-19 deaths differently, but the basic metrics remain available.
Walgreens COVID-19 Index: Walgreens shares data from COVID-19 tests conducted at over 5,000 pharmacy locations nationwide. The tracker includes test positivity (national trends and state-by-state), variant prevalence, and positivity by vaccination status. Post-PHE update: Still active, with no change due to the PHE’s end.
COVIDcast by CMU Delphi: COVIDcast is a COVID-19 monitoring project by the Delphi Group at Carnegie Mellon University. The dashboard pulls in COVID-19 data from the CDC and other sources, such as Google search trends and antigen test positivity. Post-PHE update: No longer includes cases and deaths (which were pulled from the CDC), but still updating other metrics, including hospital admissions, symptom searches from Google trends, and COVID-related doctor visits.
Iowa COVID-19 Tracker: Despite its name, the Iowa COVID-19 Tracker displays data from across the country, sourced from the CDC. It’s run by Sara Anne Willette, a data expert based in Ames, Iowa. Willette frequently shares data updates on social media and streams on Twitch when updating her dashboard. Post-PHE update: Still active, but with some changes due to the new limitations in CDC data. Dashboard manager Sara Anne Willette shares frequent updates on Twitter about what she’s changing and why.
COVID-19 dashboard by Jason Salemi: This dashboard by University of South Florida epidemiologist Jason Salemi is another page displaying CDC data in somewhat-more-user-friendly visualizations. The dashboard is focused on Florida, but shares national state- and county-level data. Post-PHE update: Salemi shared on Twitter last week that he is currently assessing whether to keep the dashboard running or decomission the site.
Biobot Analytics: Biobot Analytics is the leading wastewater surveillance company in the U.S., tracking COVID-19 at hundreds of sewershed sites through its partnership with the CDC National Wastewater Surveillance System and independent Biobot Network. The dashboard has helpful national- and regional-level charts along with county-level data for sites in Biobot’s network. Post-PHE update: Still active, no changes due to the PHE’s end. In fact, Biobot continues to add more wastewater testing sites to its network.
WastewaterSCAN: WastewaterSCAN is another leading wastewater project, led by professors at Stanford and Emory Universities. The project started with sites in California, but has since expanded nationwide; it’s tracking several other common viruses in addition to COVID-19. Post-PHE update: Still active, similarly to Biobot’s dashboard.
KFF COVID-19 Vaccine Monitor: Since late 2020, the Kaiser Family Foundation has monitored American attitudes around COVID-19 vaccines and other pandemic issues. Updates were initially released monthly, but have become less frequent in the last year (the latest update was published on February 7, 2023). Post-PHE update: This KFF project appears to be ongoing, but at a lower frequency of updates; the most recent update is still February 2023. A newer KFF dashboard (tracking Medicaid enrollment and unwinding) is also receiving ongoing updates.
Axios-Ipsos COVID-19 polls: Axios has partnered with the polling firm Ipsos on regular polls tracking COVID-19 views and behaviors. The polling data are available in PDF reports and in spreadsheets from Roper. In 2023, Axios and Ipsos shifted their focus from COVID-19 to broader questions about public health, with a new series of quarterly polls. Post-PHE update: These two organizations will continue their new series of quarterly polls about public health, launched in early 2023. The most recent installment was posted this past week and includes questions about the PHE’s end, gun violence, opioids, and more.
Have I missed any major data sources? Send me an email or comment below to let me know, and I’ll highlight it in a future issue.
Editor’s note, April 2, 2023: This post has been updated with two additional dashboards (APM Research Lab and Walgreens), and additional information on the CDC’s wastewater surveillance dashboard.
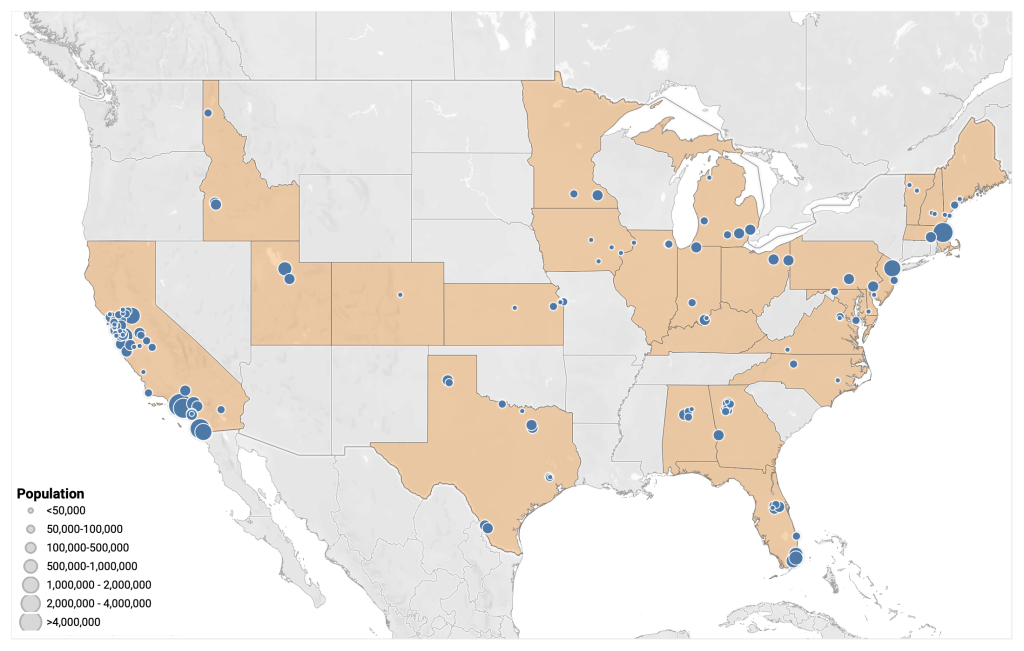
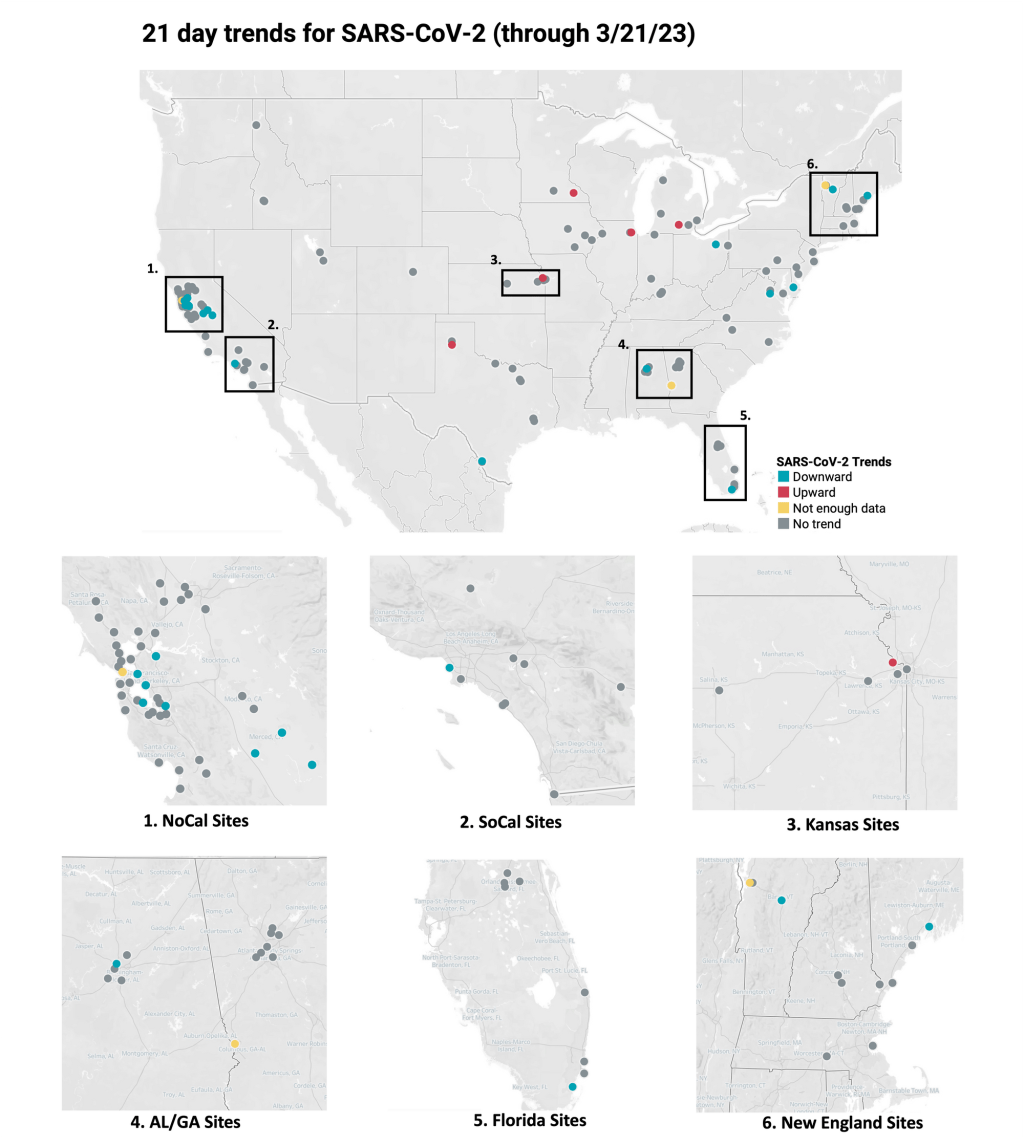
Data from WastewaterSCAN suggest that most sites in its network saw downward coronavirus trends or plateaus in recent weeks.
In the past week (March 16 through 22), the U.S. officially reported about 130,000 new COVID-19 cases, according to the CDC. This amounts to:
An average of 19,000 new cases each day
41 total new cases for every 100,000 Americans
13% fewer new cases than last week (March 9-15)
In the past week, the U.S. also reported about 17,000 new COVID-19 patients admitted to hospitals. This amounts to:
An average of 2,400 new admissions each day
5.2 total admissions for every 100,000 Americans
9% fewer new admissions than last week
Additionally, the U.S. reported:
2,000 new COVID-19 deaths (300 per day)
90% of new cases are caused by Omicron XBB.1.5; 3% by XBB.1.9.1; 2% by XBB.1.5.1; 0.4% by CH.1.1 (as of March 18)
An average of 40,000 vaccinations per day
Nationally, we continue to see the same slow decline of COVID-19 spread across the U.S., as shown by official case data, hospitalizations, and wastewater surveillance.
Reported cases dropped by 13% last week compared to the week prior, while new hospital admissions dropped by 9%. As I’ve noted in the last couple of updates, the CDC continues to deal with reporting delays from different state health departments. This week, Texas, Arkansas, Florida, and Indiana did not report cases to the CDC.
Wastewater surveillance data from Biobot and the WastewaterSCAN project suggest that COVID-19 levels are at slow declines or plateaus in most parts of the country, but some places may be seeing small increases. Biobot’s dashboard shows slight upticks in the Northeast, Midwest, and West coast regions, as of its March 22 update.
Overall, Biobot’s data suggests that national coronavirus concentrations are lower than they’ve been in about a year—but still higher than we’ve seen at this point in 2021 and 2022. The low case numbers that health departments are putting out mask a high baseline of infections, in which many people are not getting PCR tests or reporting their cases to the healthcare system.
Our US #SARSCoV2#wastewater concentration is now at its lowest point in almost a year, but remains above levels seen in previous years at this time. As we enter Spring, we will be monitoring for any indication of a potential springtime wave. https://t.co/GBL4twvGGTpic.twitter.com/qempsPrS5P
Data from the WastewaterSCAN project suggest that most of the project’s 148 monitoring sites reported downward trends or plateaus in coronavirus levels over the last three weeks. A few places have reported upticks, though, including sites in Kansas, Michigan, South Carolina, Massachusetts, and Oklahoma.
One reason for these upticks could be XBB.1.9.1, the latest Omicron subvariant to draw concern among virologists. The CDC started reporting estimates for XBB.1.9.1 in its latest variant update (this Friday): the agency estimates that this variant caused 2.5% of new cases nationwide last week, with higher prevalence (about 13%) in the Midwest region that includes Iowa, Kansas, Missouri, and Nebraska.
XBB.1.9.1 is doubling “roughly every 8 days,” according to Marc Johnson, a virologist at the University of Missouri who leads the state’s wastewater surveillance program. Johnson predicts that this subvariant will be dominant in the U.S. by the end of April, but it could face competition from XBB.1.16—another descendant of XBB that has been spreading rapidly in India.
What's next for COVID?
I projected a few weeks ago that XBB.1.9* would be the next dominant lineage in the US.
This lineage was a little over 4% of US sequences over the last 2 weeks, and the numbers are doubling roughly every 8 days.
Could the spread of these XBB sublineages across the U.S. cause a significant rise in cases and hospitalizations? It’s hard to say, given the complex picture of immunity in the country, with millions of people recently infected by a variety of variants. “Future waves are getting harder and harder to forecast,” Katelyn Jetelina wrote in Your Local Epidemiologist this week. Regardless, the same safety measures (masks, testing, etc.) continue to work against all new versions of the virus.
This past Friday, the CDC’s COVID-19 data team announced that its newsletter, the COVID Data Tracker Weekly Review, will send its final issue on Friday, May 12. That’s the day after the federal public health emergency for COVID-19 ends.
For the last two years, the Weekly Review newsletter has been a great source of accessible updates on the state of COVID-19 in the U.S.; it includes summary statistics on cases, hospitalizations, vaccinations, variants, wastewater surveillance, and deaths. I’ve frequently referenced the newsletter in my own National Numbers updates, and have pointed other journalists to it.
But this newsletter hasn’t been as reliable as one might expect from the CDC. Its writers have frequently taken the week off for federal holidays, even when the holiday falls on a Monday—and the newsletter is sent on Fridays. In recent months, the CDC has only compiled this newsletter every other week, making the “weekly review” title a misnomer. And now, the CDC has announced there will be only three more issues: sent on March 31, April 14, and May 12. (Seems like the newsletter is briefly shifting to a monthly schedule before it ends?)
While the CDC will continue to regularly update its main COVID-19 dashboard and other data sources, the agency’s failure to maintain even a fairly basic update newsletter really speaks to its deprioritization of COVID-19. It honestly boggles the mind that I, a freelance journalist writing about COVID-19 data in her spare time, send updates with more continuity than the entire national public health agency.
Yet somehow, here we are! This newsletter may see continued shifts to its format, but it isn’t going anywhere.
🚨 the CDC's COVID-19 data team has announced its "weekly review" newsletter, which has shared accessible updates on the state of the pandemic, will end on May 12.