Category: Uncategorized

  • National numbers, January 30

    National numbers, January 30

    COVID-19 hospitalizations are on the decline nationwide, though they have not yet dropped as steeply as cases. Chart via the CDC, retrieved January 29.

    In the past week (January 22 through 28), the U.S. reported about 4.2 million new cases, according to the CDC. This amounts to:

    • An average of 597,000 new cases each day
    • 1,273 total new cases for every 100,000 Americans
    • One in 79 Americans testing positive for COVID-19
    • 20% fewer new cases than last week (January 15-21)

    Last week, America also saw:

    • 135,000 new COVID-19 patients admitted to hospitals (41 for every 100,000 people)
    • 16,000 new COVID-19 deaths (4.9 for every 100,000 people)
    • 100% of new cases are Omicron-caused (as of January 22)
    • An average of 600,000 vaccinations per day (per Bloomberg)

    Last week, COVID-19 case numbers started to indicate that the U.S.’s Omicron surge was turning a corner; this week, cases are clearly on the decline. National new case reports have dropped by about 24% in the past two weeks, from 784,000 new cases a day in mid-January to 597,000 new cases a day last week.

    COVID-19 hospitalizations are also on the decline, though this metric is not dropping as steeply: the number of patients hospitalized with confirmed COVID-19 nationwide went from nearly 150,000 in mid-January to 138,000 this past week, according to the CDC.

    Deaths, meanwhile, are still increasing, as trends in deaths tend to lag behind trends in cases by several weeks. Over 2,000 Americans died of COVID-19 each day last week, and the country is on track to reach 900,000 total deaths in early February (in the official count, anyway—the true death toll is likely much higher).

    Cases have been dropping in Northeast hotspots like New York, New Jersey, D.C., Maryland, and Delaware for several weeks now. In New York City, for example, the number of new COVID-19 cases last week was one-ninth the cases reported during the city’s Omicron peak in early January—though the city and state overall are still at case levels far above the CDC threshold for high transmission.

    At the same time, cases continue to increase in some Western states, including Montana, Idaho, and Washington. The states with the highest COVID-19 case rates per capita right now are Alaska, Oklahoma, Kentucky, North Dakota, and California; all reported about 2,000 new cases per 100,000 residents in the last week, according to the latest Community Profile Report.

    The Omicron surge has inspired many Americans to get vaccinated. About 75% of the U.S. population has now received at least one vaccine dose, per the CDC, and more than 40% of those fully vaccinated have received a booster shot. But vaccines are still unavailable for the youngest Americans, contributing to a rise in pediatric cases: in the week ending January 20, a record 1.1 million COVID-19 cases were reported among children.

  • Featured sources, January 23

    • CDC dashboard adds booster shots to key pages: This week, the CDC added booster shot status to its COVID-19 dashboard page detailing the rates of lab-confirmed COVID-19 hospitalizations by vaccination status. According to the new chart (at the bottom of this page), in December, hospitalization rates were 49 times higher in unvaccinated adults over age 65 than in fully vaccinated and boosted adults in that age group. The CDC also added booster shot status to its COVID-19 Vaccination Equity page, with a chart showing booster shot rates according to race and ethnicity. Unsurprisingly, white and Asian Americans have the highest booster rates.
    • KFF: How Are Private Insurers Covering At-Home Rapid COVID Tests? A new report from the Kaiser Family Foundation compares rapid at-home test reimbursement policies for 13 major private insurers, as of mid-January 2022. According to the report, six insurers are currently offering direct coverage (meaning users don’t need to pay out of pocket for the tests), while seven offer reimbursement online, by mail, or by fax.
    • QCovid® risk calculator: This tool, commissioned by England’s Chief Medical Officer for use in the U.K. national healthcare system, helps potential COVID-19 patients estimate their risk for severe symptoms. The tool is meant for use by doctors and other medical professionals who are actively evaluating patients, but the website allows anyone to go through the risk questionnaire and see their status. (You just can’t use the results for anything beyond gaining information.)

  • National numbers, January 23

    National numbers, January 23

    Has Omicron peaked in the U.S.? Nationally, it seems possible, but the situation is more complicated at the state and local level. Chart via the CDC, retrieved on January 23.

    In the past week (January 15 through 21), the U.S. reported about 5.2 million new cases, according to the CDC. This amounts to:

    • An average of 745,000 new cases each day
    • 1,588 total new cases for every 100,000 Americans
    • One in 63 Americans testing positive for COVID-19
    • 5% fewer new cases than last week (January 8-14)

    Last week, America also saw:

    • 147,000 new COVID-19 patients admitted to hospitals (45 for every 100,000 people)
    • 12,200 new COVID-19 deaths (3.7 for every 100,000 people)
    • 100% of new cases are Omicron-caused (as of January 15)
    • An average of 300,000 vaccinations per day (per Bloomberg)

    Has Omicron peaked in the U.S.? Looking at the national data, you might think so: new COVID-19 cases in the U.S. have dropped 5% from 5.5 million last week to 5.2 million this past week. While those numbers are astronomically high compared to past pandemic waves, it’s encouraging to think that they might not get higher.

    Hospitalization data also seem to have reached a peak; while about 150,000 Americans are currently hospitalized with COVID-19, according to the HHS, this number is no longer rapidly increasing. Patient numbers are starting to decline in the states and cities that were first hit by Omicron.

    It’s too soon to say that we’re actually coming down on the other side of the Omicron curve, though. For one thing, as Dr. Katelyn Jetelina pointed out in a recent issue of Your Local Epidemiologist, holiday reporting and test capacity could be playing a role here.

    Last Monday was Martin Luther King Jr. Day, a federal holiday that many health agencies and test providers took off—though not a holiday on the reporting disruption level of Christmas or New Year’s. And tests are incredibly hard to find in some parts of the country, meaning that our current system simply isn’t catching a large number of COVID-19 cases. (Remember: most COVID-19 case counts do not include cases identified with at-home antigen tests.) In short, the current trend is encouraging, but we’ll have to see next week if it continues.

    While the national picture is hard to interpret, it’s clear that the Northeast states that dealt with Omicron first are now on the decline. In New York City, the case rate has been reduced by over a third, from 3,500 new cases per 100,000 in a week at the beginning of January to 1,000 new cases per 100,000 in the last week. Case rates are also going down in New Jersey, Maryland, D.C., Connecticut, and Massachusetts.

    At the same time, other parts of the country are still in the first half of their Omicron surges. Cases rose by over 40% from last week to this week in Wisconsin, Wyoming, Oklahoma, Idaho, Ohio, and New Mexico, according to the latest Community Profile Report. In fact, Wisconsin now has one of the highest per capita case rates in the country, at 2,800 new cases per 100,000 in the week ending January 19.

    A recent NBC News article explains that the urban regions first exposed to Omicron have higher vaccination rates and more available hospital beds, making them more prepared to weather the variant. But now, Omicron is beginning to reach rural parts of the country that are less vaccinated, less capable of taking on patients, and still reeling from Delta. For these communities, the next few weeks are bound to be rough.

  • Featured sources, January 16

    • Post-Acute Sequelae of SARS-CoV-2 infections estimates and insights: Continuing with the Long COVID theme of this issue: I recently learned about this dashboard from the American Academy of Physical Medicine and Rehabilitation. It provides estimates of Long COVID cases in the U.S. based on case numbers from Johns Hopkins University and a model assuming that 30% of surviving COVID-19 cases will lead to long-term symptoms. The dashboard includes estimates of total Long COVID cases, cases over time, and cases by state.
    • Disease severity among hospitalized patients (CDC): The CDC added a new page to its COVID-19 dashboard this week, providing data on the shares of COVID-19 patients in U.S. hospitals who require intensive care and ventilation, and who die while at the hospital. The data come from the CDC’s hospitalization surveillance network and other federal hospital sources.
    • Vaccination dashboard annotations: This weekend, I updated my annotations page detailing how every U.S. state and several national sources track vaccinations. 39 states are now reporting some data on booster shots or third doses, I found, though most of them still aren’t providing demographic data reflecting the recipients of these additional doses.

  • National numbers, January 16

    National numbers, January 16

    The entire country has extremely high COVID-19 transmission right now. Chart via the January 13 Community Profile Report.

    In the past week (January 8 through 14), the U.S. reported about 5.5 million new cases, according to the CDC. This amounts to:

    • An average of 783,000 new cases each day
    • 1,669 total new cases for every 100,000 Americans
    • One in 60 Americans testing positive for COVID-19
    • 33% more new cases than last week (January 1-7)

    Last week, America also saw:

    • 144,000 new COVID-19 patients admitted to hospitals (44 for every 100,000 people)
    • 12,100 new COVID-19 deaths (3.7 for every 100,000 people)
    • 98% of new cases are Omicron-caused (as of January 8)
    • An average of 1.3 million vaccinations per day (per Bloomberg)

    The U.S. once again broke COVID-19 records this week, reporting about 5.5 million new cases in total. Last winter, the highest number of cases reported in a single week was about 1.7 million; this past week, the country reported over one million cases just on Monday (though that number included backlogs from the prior weekend).

    Last week, I wrote that one in eighty Americans had tested positive for COVID-19. This past week, that number is one in sixty—again, not including people who tested positive on rapid, at-home tests.

    The U.S. also broke last winter’s hospitalization record this week: 157,000 patients are now hospitalized with COVID-19 across the country, according to the Department of Health and Human Services (HHS). Last winter’s record was about 125,000. But this number doesn’t capture the dire situations in ICUs, staff shortages, and other issues that hospitals are facing right now. (More on that later in the issue.)

    Northeast states continue to report the highest case numbers: Rhode Island, New York, Massachusetts, New Jersey, Delaware, and Florida all reported over 2,000 new cases for every 100,000 people in the week ending January 12, according to the latest Community Profile Report. Some of the earliest Omicron hotspots appear to have peaked; in New York City, for example, the weekly case rate is back under 2,000 new cases per 100,000 in the week ending January 11, down from a height of 3,500 new cases per 100,000 on January 3.

    But talking about specific state hotspots obscures from the fact that every single state is seeing insane COVID-19 numbers right now. Only four states reported fewer than 1,000 new cases per 100,000 last week—Wyoming, Montana, Idaho, and Maine—but their cases are climbing fast. Remember, the CDC threshold for high transmission is 100 new cases per 100,000.

    Speaking of hotspots: I have a new story in FiveThirtyEight this week, explaining that the most important Omicron hotspots actually can’t be seen on case maps. Right now, we need to identify outbreaks among the people most vulnerable to severe disease and those most capable of shutting down society; but the deluge of cases right now makes it hard to see and protect those people.

    Here’s the kicker of the piece:

    Still, the toolkit for addressing omicron hot spots is the same as it has been throughout the pandemic, said [Julia Raifman, a professor of health law, policy and management at the Boston University School of Public Health]. New federal requirements for vaccinations, masks, testing and ventilation would help protect the people most vulnerable to severe symptoms while also reducing case numbers in settings that can shut down society.

    “Federal guidance on mask mandates tomorrow would likely reduce deaths by tens of thousands,” Raifman said. “The perfect doesn’t need to be the enemy of the good, you don’t need every state to pass it. But you can put in place a mask policy during the surge, and it will reduce transmission and reduce the harms to health care workers and businesses.”

    In other words: When you can’t pinpoint specific hot spots, you need broad measures that can impact everyone. That strategy was made harder on Thursday, as an Occupational Safety and Health Administration rule that would have required around 80 million workers to get vaccinated or comply with regular testing was blocked by the Supreme Court. Without this rule, low-income workers will continue to face heightened risk of COVID-19 infection — and their cases will continue to ripple out.

  • Featured sources, January 9

    • COVID-19 Hospital Capacity Circuit Breaker Dashboard: This dashboard from emergency physician Dr. Jeremy Faust and colleagues shows which U.S. states and counties are operating at unsustainable levels, or are likely to get there in coming days. Faust further explains circuit breakers in this post: these are “short-term restrictions, regardless of vaccination status, designed to slow the spread of COVID-19” and help prevent hospitals from becoming overwhelmed. Dashboard data come from the CDC, HHS, and Johns Hopkins University.
    • CDC Cruise Ship Color Status: Throughout the pandemic, cruise ships have been hotbeds for coronavirus spread. This is especially true right now, thanks to Omicron, and the CDC is investigating a number of outbreaks. The agency reports on all cruise ships that it’s monitoring for COVID-19, classifying them based on the number of cases reported among passengers and crew; as of January 7, the vast majority of ships have reported enough cases to meet the threshold for CDC investigation.
    • Deaths and hospitalizations averted by vaccines: This December report from philanthropy foundation the Commonwealth Fund provides estimates on the severe COVID-19 cases prevented by the U.S. vaccination effort. Without vaccination, the report estimates, “there would have been approximately 1.1 million additional COVID-19 deaths and more than 10.3 million additional COVID-19 hospitalizations in the U.S. by November 2021.” (H/t Your Local Epidemiologist.)

  • As Omicron hits schools, K-12 data void is wider than ever

    As Omicron hits schools, K-12 data void is wider than ever

    Two years into the pandemic, you might think that, by now, schools would have figured out a strategy to continue teaching kids while keeping them safe from the coronavirus. Instead, the school situation is more chaotic than ever—thanks to Omicron combined with staff shortages, pandemic fatigue, and other ongoing issues.

    Thousands of schools went online or closed entirely this week, likely more than in any other week since spring 2020. And yet: there is currently no national data source tracking COVID-19 cases in schools, and nine states fail to report any data on this crucial topic.

    This week, I had a story published in education outlet The Hechinger Report about the challenges that schools faced in staying open during the fall 2021 semester. For the story, I returned to the five school communities that I profiled last summer during my Opening project to see how they fared in the fall.

    The story identifies four major challenges:

    • Quarantines: When a school or district faces a COVID-19 outbreak, contact tracing for all of the cases can quickly become incredibly time-consuming. This work “can be very burdensome for the school and the health department,” pediatrician Leah Rowland told me—especially when a school doesn’t have its own school nurse.
    • Testing: Surveillance testing can help identify cases early, while test-to-stay programs can keep kids out of quarantine; in fact, the CDC recently endorsed test-to-stay, adding the strategy to its official schools guidance. But testing programs are costly and hard to set up; in absence of state-wide testing support, they tend to be implemented at larger and wealthier school districts.
    • Staff shortages: Every single school leader and expert I spoke to for the story named staff shortages as a major challenge. “[Potential staff] can work at McDonald’s, and have a whole lot less stress and make more money than working as an instructional assistant for Garrett County Public Schools,” Alison Sweitzer, director of finance at this Maryland district, told me.
    • Pandemic fatigue: In a lot of places around the U.S., schools are one of the only—if not the only—institution still enforcing COVID-19 policies, like masks and social distancing. This can drive up tension between parents and school staff; and school nurses, who act as public health experts within the school, often bear the brunt of the criticism. Robin Cogan, legislative co-chair for the New Jersey State School Nurses Association, told me that she’s never felt this exhausted, in 21 years of serving as a school nurse.
    • Low vaccination rates: As of this week, about one in four children ages five to 11 has received at least one dose of a COVID-19 vaccine. This ranges wildly by state, though, with 57% of children in this age group vaccinated in Vermont compared to under 20% in much of the South. Vaccinated students and staff don’t have to quarantine when they’re exposed to a COVID-19 case, but despite this strong motivator, the school leaders I spoke to have not seen much enthusiasm for the shots.

    I reported most of that Hechinger Report story before Omicron hit the U.S. But it’s clear to see how the new variant has exacerbated all of these challenges. As this super-contagious variant hits schools, cases are increasingly rapidly—leading to more quarantines and contact tracing pressures. School staff are getting sick, intensifying shortages. And the students and staff who are unvaccinated are the most vulnerable.

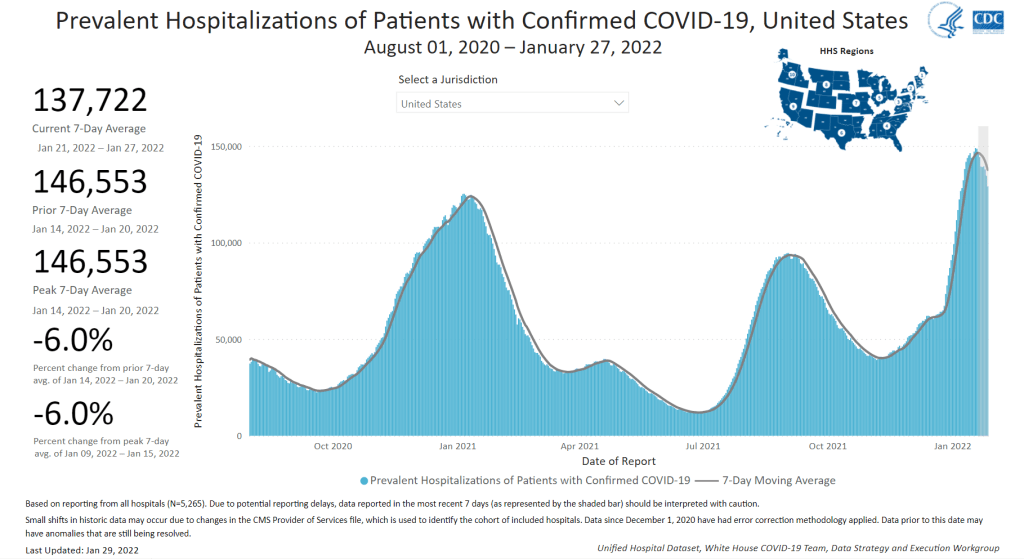
    “Pediatric hospitalizations are at the highest rate compared to any prior point in the pandemic,” CDC Director Dr. Rochelle Walensky said at a press briefing on Friday. The CDC is investigating whether this increase reflects an inherent severity of Omicron in children or whether it’s simply the product of record-high cases everywhere. Either way, though, the data clearly show that vaccination is the best way to protect children from severe COVID-19. For children under age five, Dr. Walensky said, “it’s critically important that we surround them with people who are vaccinated to provide them protection.”

    According to Burbio’s K-12 School Opening Tracker, 5,441 schools had disruptions in the week of January 2. Those disruptions include schools going online or canceling instruction entirely—anything caused by the pandemic, as opposed to by weather or some other reason. This is higher than any other week in the 2021-2022 school year by a long shot; the previous record was 2,846 disruptions in early November.

    New York City has been one of the U.S.’s first Omicron hotspots, and the variant has had a massive impact on the city school system. Case rates shot up in December, with almost 5,000 new cases reported by the city Department of Education (DOE) in the week ending December 26. This number, as well as January DOE data, is likely a massive undercount, though, because of the sheer number of cases being reported within the city right now.

    The PRESS NYC schools dashboard, which references DOE data, provides this caveat: “As we understand it, the Situation Room cannot keep up with cases coming in and many cases aren’t even making it into DOE data.”

    Stories from inside the public school system suggest that kids are going into classrooms just to sit in study hall and, very likely, infect each other. One Reddit post from a NYC high school student described the case numbers at their school shooting up from six total cases in mid-December, to 100 on January 3, to over 200 by the end of this week. The majority of those cases weren’t yet reflected in DOE data, the student said.

    Yet NYC’s new mayor, Eric Adams, seems determined to keep schools open at all costs.

    Other districts have also had their fair share of conflict this week. In Chicago, teachers are on strike for safer in-person conditions. The situation has led to classes getting canceled entirely, as the school district locked striking teachers out of their online accounts—preventing them from teaching remotely. And in many other districts, including Seattle and Washington D.C., the start of the spring semester was delayed as the district sought to test all students, teachers, and staff before reopening.

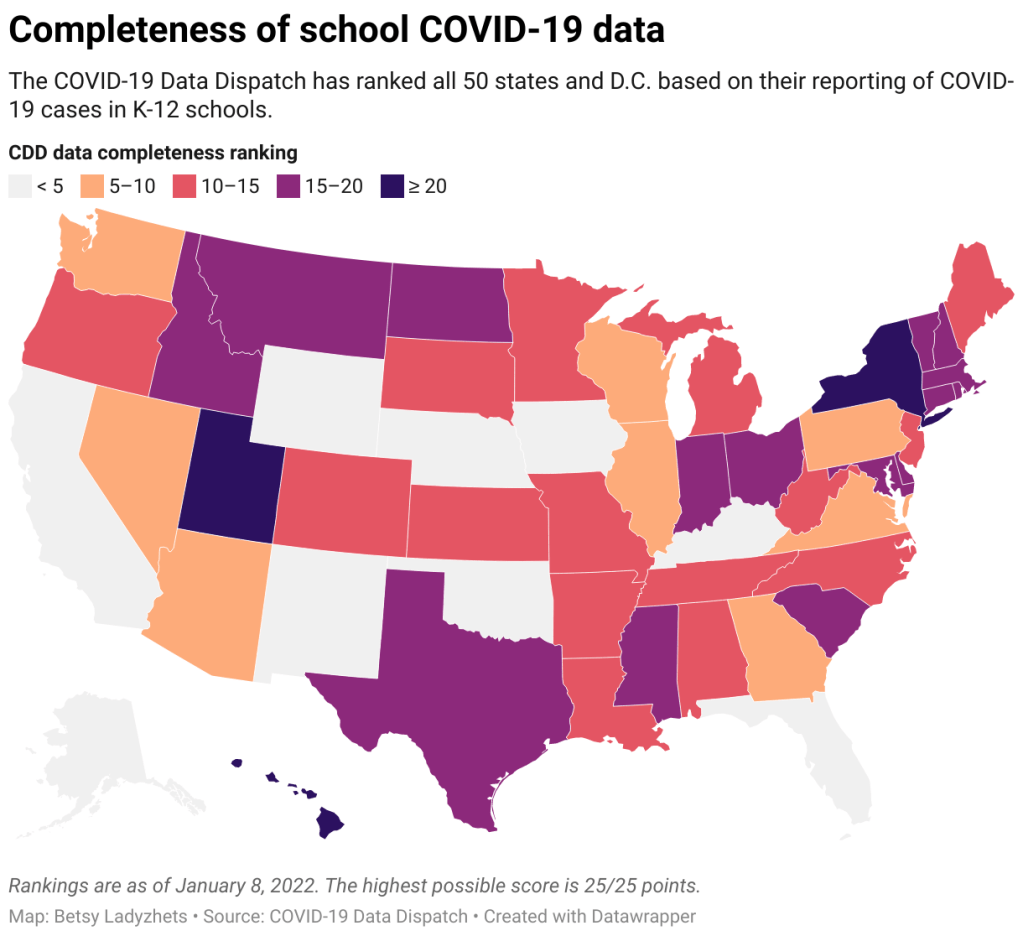
    With all of this tension in mind, I set out yesterday to update my K-12 school data annotations for the first time in several months. These annotations reflect the availability of data on COVID-19 cases and related metrics in school buildings, by state and at the national level.

    Here’s what I found:

    • 31 states and D.C. are reporting data on COVID-19 cases in K-12 school settings. There’s a lot of variability in this reporting, though, from states like Connecticut, which reports a detailed breakdown of cases by school (including downloadable historical data), to states like Maine, which only reports cases in “active outbreaks.”
    • 10 states are reporting what I categorize as “somewhat” cases in K-12 schools. This includes states like Arizona, which reports the number of schools with COVID-19 outbreaks by county (but no case numbers), and Illinois, which reports cases in school-aged children (but not cases that are school-specific).
    • Nine states are not reporting any K-12 school data. These states are: Alaska, California, Florida, Iowa, Kentucky, Nebraska, New Mexico, Oklahoma, and Wyoming. Note, both Florida and Kentucky used to report school data, but have discontinued this reporting since last school year.
    • New York continues to have the most complete school data, by my assessment, as it’s the only state to report both COVID-19 tests and school enrollment.
    • Six states are now reporting in-person school enrollment, a key metric needed to analyze COVID-19 data: Connecticut, Delaware, Hawaii, New York, Texas, and Utah.
    !function(){“use strict”;window.addEventListener(“message”,(function(e){if(void 0!==e.data[“datawrapper-height”]){var t=document.querySelectorAll(“iframe”);for(var a in e.data[“datawrapper-height”])for(var r=0;r<t.length;r++){if(t[r].contentWindow===e.source)t[r].style.height=e.data["datawrapper-height"][a]+"px"}}}))}();

    In short, while a lot of data on COVID-19 in schools are available from state public health departments, these data are wildly unstandardized and difficult to analyze holistically. See the annotations page for more details on your state.

    Meanwhile: at this time, there is no national data source on COVID-19 cases in schools. The federal government has never reported these data; the best that our federal health agencies can do, apparently, is compile rarely-updated dashboards of school learning modes (i.e. which districts are in-person vs. remote). Last school year, a couple of research projects sprung up to compile information from state agencies and other sources; but as of now, those projects are all discontinued.

    While a number of studies have demonstrated the effectiveness of common safety policies (masks, vaccinations, ventilation, etc.), many of the researchers who study school COVID-19 safety have to use small sample sizes, such as a single district or state. CDC researchers often rely on proxies like county case rates to analyze the impact of different policies. This research is a far cry from the work that we could do with a comprehensive, national dataset of COVID-19 cases in schools.

    Without detailed data on COVID-19 in schools, it’s difficult to make good policy decisions. The data void leaves space for pundits on both sides of the aisle: some can argue that schools are safe and must remain open in-person no matter how high community cases get, while others can argue that schools are incredibly dangerous and must close.

    The COVID-19 in schools data void is wider than ever right now, even though we need information desperately as Omicron spreads.

    More K-12 reporting

  • National numbers, January 9

    National numbers, January 9

    The national average case rate for the U.S. is twelve times the CDC’s benchmark for “high transmission” (100 new cases per 100,000). Chart via the January 6 Community Profile Report.

    In the past week (January 1 through 7), the U.S. reported about 4.1 million new cases, according to the CDC*. This amounts to:

    • An average of 586,000 new cases each day
    • 1,251 total new cases for every 100,000 Americans
    • One in 80 Americans testing positive for COVID-19
    • 86% more new cases than last week (December 25-31)

    Last week, America also saw:

    • 115,000 new COVID-19 patients admitted to hospitals (35 for every 100,000 people)
    • 8,700 new COVID-19 deaths (2.7 for every 100,000 people)
    • 95% of new cases are Omicron-caused (as of January 1)
    • An average of one million vaccinations per day (including booster shots; per Bloomberg)

    *Here at the COVID-19 Data Dispatch, we’re back to our regular schedule of national updates based on Friday data, as the CDC has resumed weekly reports following its holiday hiatus.

    Omicron continues to drive record cases across the U.S., as we move from tense holiday gatherings to extremely fractured schools and workplaces. This week, the CDC reported 4.1 million new cases—almost double last week’s number, and about 2.5 times the case peak reported during last winter’s surge.

    Put another way: 4.1 million cases amounts to about one in eighty Americans testing positive for COVID-19 in the past week. And that number doesn’t include the vast majority of rapid, at-home tests that continue to be in high demand across the country.

    At the same time, hospitalizations are increasing rapidly, with over 100,000 current COVID-19 patients now reported by the CDC. We appear to be on track to pass last year’s peak, 124,000 COVID-19 patients in beds nationwide.

    I’ve seen a lot of discussion in recent days about hospitalizations “with” COVID-19 versus hospitalizations “for” COVID-19. As Omicron is less severe and more transmissible than other variants, the argument goes, aren’t a lot of those 100,000 COVID-19 patients people who have mild or asymptomatic cases, but tested positive for COVID-19 upon going to the hospital for a different condition?

    While it’s true that some COVID-19 patients in hospitals are “incidental,” meaning their cases were caught during routine hospital screening, these cases can still have a major impact on the hospital system. Healthcare workers need to separate these patients from non-COVID patients, take extra care with their PPE, and utilize other resources. Plus, a lot of patients that, at first, appear to “incidentally” have COVID-19 may see the disease worsen their chronic conditions, such as diabetes or COPD.

    To better understand the strain on hospitals right now, I recommend reading Ed Yong’s latest feature in The Atlantic—which gets into the “with” versus “for” issue, hospital staffing challenges, and other problems.

    When it comes to hotspots: the Northeast continues to see the highest case rates. New Jersey and New York are leading the pack, both with over 2,400 new cases for every 100,000 residents reported in the last week according to the latest Community Profile Report. (Reminder: the CDC threshold for “high transmission” is 100 new cases per 100,000, so New York and New Jersey are at 24 times the rate of this benchmark.)

    Rhode Island, Puerto Rico, D.C., Delaware, Massachusetts, and Florida also have incredibly high case rates, over 1,800 per 100,000 in the last week. Meanwhile, cases are rising rapidly in a number of other Southern and Western states: Texas, the Carolinas, Utah, Arkansas, California, Oregon, and Mississippi have all reported more than 150% case increases in the past week.

    If you are able to work from home and avoid public spaces as much as possible, now is the time to do so. January is going to be rough.

  • Reader survey: What do you want to see in 2022?

    Reader survey: What do you want to see in 2022?

    Last January, as I relaunched the COVID-19 Data Dispatch on its own website, I also started a membership program. The membership, as I envisioned it, would allow readers to support my work while also getting access to an exclusive Slack server where they could network with each other and help shape the publication’s coverage.

    I quickly learned, however, that while some people were willing to support my work, the Slack server was not very popular. Those who have kept up memberships over the past year have mostly done so because they like the COVID-19 Data Dispatch and want to help me keep it free for everyone.

    This is awesome, obviously—and I’m very grateful to those donors, who have supported the CDD’s tech costs, payment for Intern Sarah Braner last spring, and a couple of guest articles. But in 2022, I would like to revamp readers’ options for donating in a way that aligns more closely with your interests.

    The survey will help me figure that out, as well as give me an overall sense of what you all would like to see from the COVID-19 Data Dispatch in 2022. It should take under five minutes to complete, and can be done on a computer or smartphone.

    //embed.typeform.com/next/embed.js

    If the embedded form above doesn’t work, you can fill out the survey at this link: https://form.typeform.com/to/Ilo69Uzx

    And if you’re interested in supporting the CDD, you can do so here:

  • National numbers, January 2

    National numbers, January 2

    While COVID-19 case numbers in many parts of the country have shot past last winter’s records, hospitalizations and deaths have remained relatively low. Chart via the New York Times, shared on Twitter by Benjamin Ryan.

    In the past week (December 24 through 30), the U.S. reported about 2.2 million new cases, according to the CDC.* This amounts to:

    • An average of 316,000 new cases each day
    • 674 total new cases for every 100,000 Americans
    • 79% more new cases than last week (December 17-23)

    Last week, America also saw:

    • 71,000 new COVID-19 patients admitted to hospitals (22 for every 100,000 people)
    • 7,700 new COVID-19 deaths (2.4 for every 100,000 people)
    • 59% of new cases are Omicron-caused (as of December 25)
    • An average of 1.3 million vaccinations per day (including booster shots; per Bloomberg)

    *This week’s update, like last week’s, is based on Thursday data (as of December 30) because the CDC has once again taken Friday through Sunday off.

    It’s difficult to interpret COVID-19 data in the wake of any major holiday, as public health officials and testing sites alike take well-deserved time off. The weeks after Christmas are particularly tricky: the numbers are just starting to recover from one holiday when New Year’s hits, causing another round of delays. This year, the CDC took three-day weekends over both Christmas and New Year’s.

    All of that said, we have enough data to say that cases are rising incredibly fast across the U.S. The country reported over 300,000 new cases a day this week—the highest seven-day average of the entire pandemic so far. Over 500,000 new cases were reported on Friday alone.

    New York City continues to be a major Omicron hotspot. Last week, I wrote that one in every 100 New Yorkers had tested positive within a seven-day period, according to NYC data; this week, that number is one in 50. NYC’s positivity rate is over 25%, indicating that one in every four PCR tests conducted in the city is returning a positive result—but also indicating that the city is not testing enough to actually identify all cases. City data don’t include rapid at-home tests, contributing to the data gap here.

    NYC’s case rate seems to be slowing down, suggesting that the city may soon follow South Africa in seeing an intense, yet short Omicron surge. But “growth is still growth,” as analyst Conor Kelly points out:

    Meanwhile, plenty of other places in the U.S. are facing rapid growth from Omicron. In Florida, cases increased by almost 1,000% in the last two weeks of December—bringing the state from the lowest per-capita case rate in the country to the fourth-highest. Several other Southern states have also seen cases more than double in the last week: Georgia, Alabama, Louisiana, California, Mississippi, Washington, and Maryland, among others.

    There is some good news in this surge, though: while COVID-19 cases surge to record highs, hospitalizations remain much lower than they were at this point last year. The CDC currently reports about 67,000 COVID-19 patients in hospitals nationwide, compared to a peak of over 120,000 in January 2021. Omicron hotspots like NYC and DC are similarly reporting hospitalization numbers that, while rising sharply, are not following cases as closely as they did last year. 

    COVID-19 experts call this phenomenon “decoupling”: thanks to vaccinations, treatments, and (possibly) some inherent biological qualities of Omicron, hospitalization increases no longer directly follow case increases. Still, a smaller percentage of cases requiring hospitalization can still mean a lot of hospitalizations, when case numbers are as high as they are right now. And hospitals, already facing dire staffing shortages, were in crisis mode before Omicron hit.