Category: Uncategorized

  • National numbers, March 13

    National numbers, March 13

    Wastewater surveillance in the U.S. shows that we are currently in a plateau. Chart from Biobot, retrieved March 12.

    In the past week (March 5 through 11), the U.S. reported about 260,000 new COVID-19 cases, according to the CDC. This amounts to:

    • An average of 37,000 new cases each day
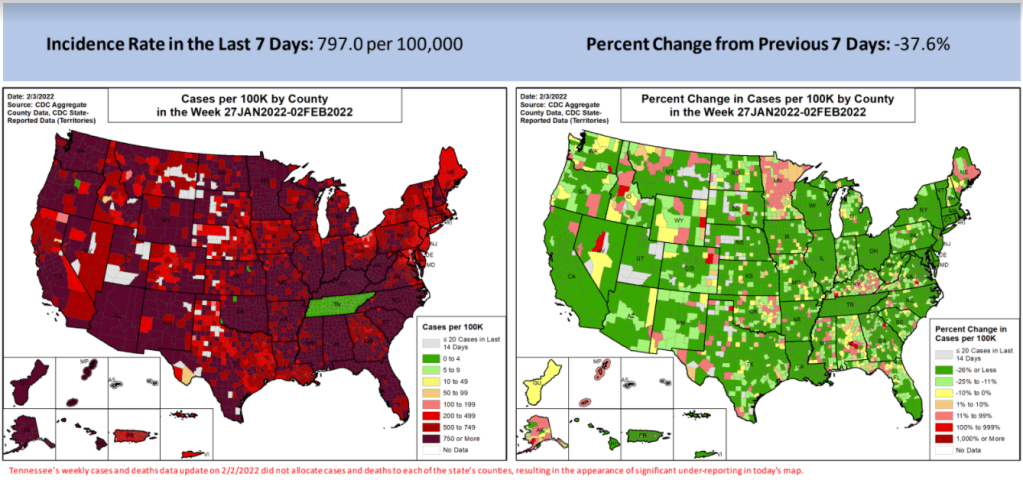
    • 79 total new cases for every 100,000 Americans
    • 29% fewer new cases than last week (February 26-March 4)

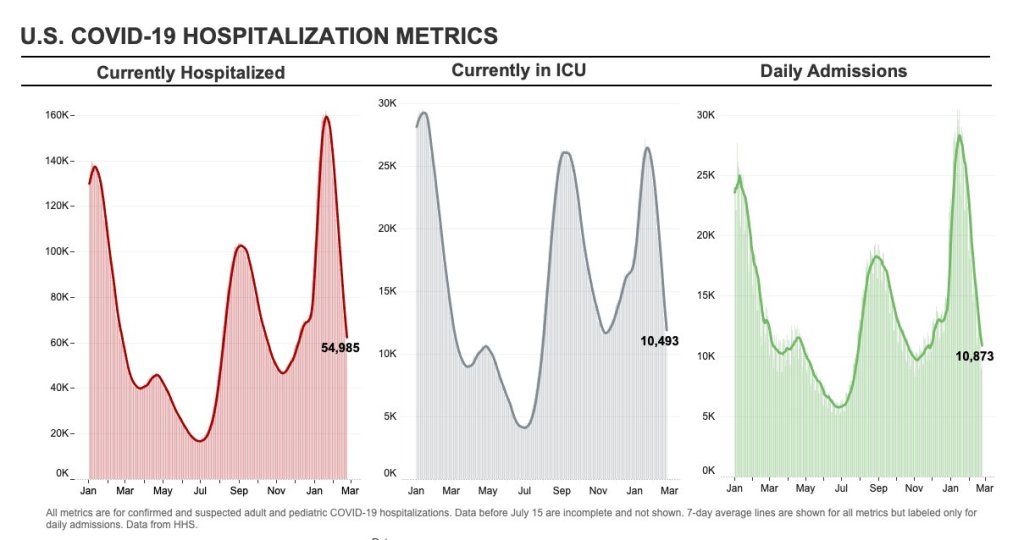
    In the past week, the U.S. also reported about 22,000 new COVID-19 patients admitted to hospitals. This amounts to:

    • An average of 3,100 new admissions each day
    • 6.6 total admissions for every 100,000 Americans
    • 28% fewer new admissions than last week

    Additionally, the U.S. reported:

    • 8,200 new COVID-19 deaths (2.5 for every 100,000 people)
    • 100% of new cases are Omicron-caused; 12% BA.2-caused (as of March 5)
    • An average of 100,000 vaccinations per day (per Bloomberg)

    Note: I’m shifting the format of these National Numbers posts to focus more on hospitalizations and wastewater, as case data become both less reliable and less available in many parts of the U.S.

    Overall, new COVID-19 cases are continuing to fall across the U.S. The country reported about 37,000 new cases a day last week, according to the CDC, compared to ten times that number in early February.

    Case numbers have become less reliable lately as testing sites close and people are redirected to use at-home rapid tests, which are generally not reported. Still, we’re seeing a similar trend in new COVID-19 patients admitted to hospitals: both new cases and new admissions dropped almost 30% last week from the week prior.

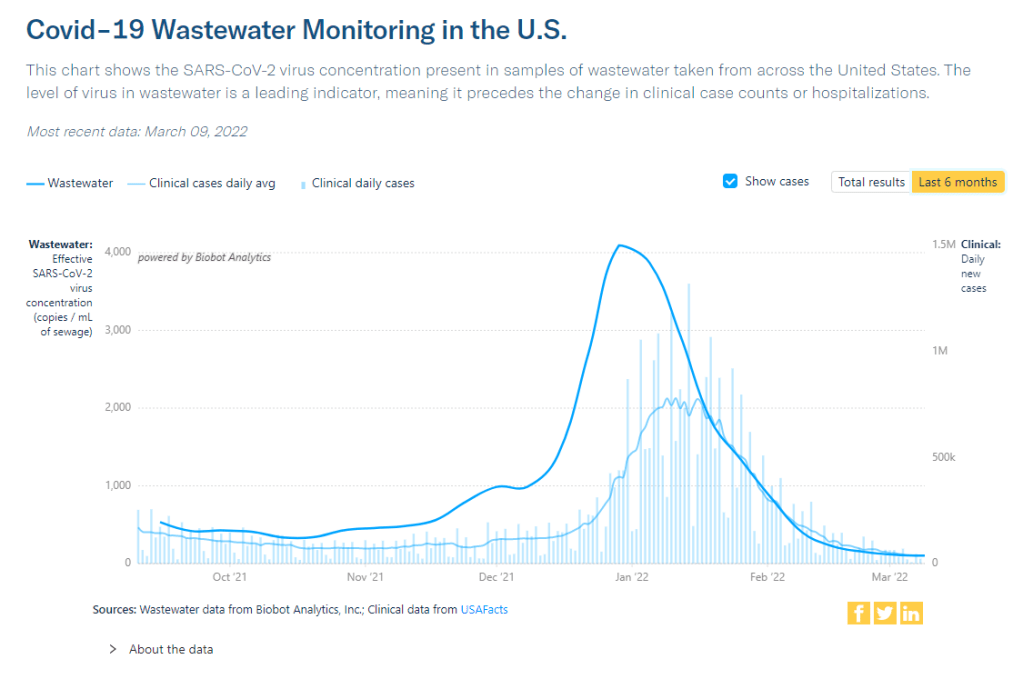
    Additionally, wastewater levels are decreasing or plateauing across the country, according to the Biobot tracker, which compiles trends from over 90 locations. The CDC wastewater surveillance tracker is showing similar overall trends as well.

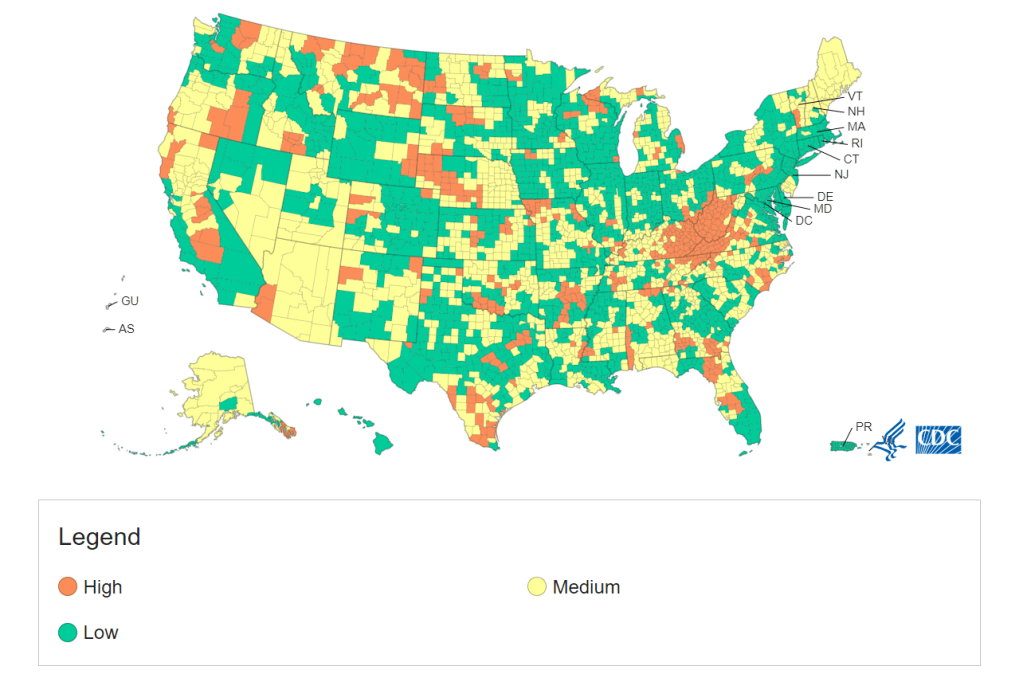
    More than 98% of the U.S. population now lives in a location with a low or medium COVID-19 Community Level, according to the CDC. But a few places did see case increases last week: these include Nebraska, Kentucky, Alaska, and Delaware, according to the March 10 Community Profile Report.

    BA.2, the Omicron sister variant that is even more transmissible than the original version of this strain, is slowly gaining ground in the U.S.: it’s gone from causing an estimated 1% of cases in the first week of February to 12% in the first week of March, according to the CDC’s modeling.

    It hasn’t impacted case trends here yet, but deserves close attention in the coming weeks and months. Gothamist has a helpful article about BA.2’s potential impact in New York, where the variant’s prevalence in wastewater is doubling statewide every two weeks.

    Meanwhile, several European countries—including the U.K., Germany, the Netherlands, and others—reported case increases this week. This is likely due to ending pandemic safety measures, Omicron gaining its second wind, or some combination of the two; regardless, it doesn’t bode well for the U.S., which is also ending pretty much all pandemic safety measures.

  • National numbers, March 6

    National numbers, March 6

    About 90% of the U.S. population now lives in a medium- or low-level COVID-19 “Community Level,” according to the CDC.

    In the past week (February 26 through March 4), the U.S. reported about 371,000 new COVID-19 cases, according to the CDC. This amounts to:

    • An average of 53,000 new cases each day
    • 113 total new cases for every 100,000 Americans
    • 29% fewer new cases than last week (February 19-25)

    Last week, America also saw:

    • 30,000 new COVID-19 patients admitted to hospitals (9 for every 100,000 people)
    • 11,000 new COVID-19 deaths (3.3 for every 100,000 people)
    • 100% of new cases are Omicron-caused (as of February 26)
    • An average of 140,000 vaccinations per day (per Bloomberg)

    New COVID-19 cases continue falling in the U.S. as the Omicron wave fizzles out. This week, the CDC reported an average of 53,000 new cases a day—less than one-tenth the cases reported at the peak of this surge.

    Hospitalization metrics also continue falling. About 30,000 new COVID-19 patients were admitted to U.S. hospitals this week, compared to almost 150,000 at the peak of the surge. According to the Hospital Circuit Breaker dashboard, only two states are currently at or over hospital capacity: Nebraska and Vermont.

    We’re now in the second week of the CDC’s new “Community Level” guidance for safety precautions tied to regional COVID-19 metrics. As of this week, “more than 90% of the U.S. population is in a location with low or medium COVID-19 Community Level,” according to the agency.

    Of course, the agency’s old guidance—still available on its COVID-19 dashboard—is less generous. According to these metrics, almost half of the country is still seeing “high community transmission,” with more than 100 new cases per 100,000 people in the last week. Remember, even though case numbers are much lower now than they were in early January, the Omicron surge warped our whole sense of COVID-19 proportion.

    Meanwhile, some parts of the country where Omicron arrived and peaked earlier are now in distinct plateaus. This includes Washington, D.C. and New York City; in NYC, case rates have actually started ticking back up very slightly in the last week.

    I personally trust NYC case numbers more than that metric in other places because the city still has widely available public testing. But as other cities and states close testing sites and redirect people to at-home tests, case numbers will continue becoming less reliable over the coming weeks. So, I am thinking about shifting these national updates to focus more on other metrics, like hospitalizations and wastewater.

    Readers, what do you think? Any recommendations for metrics you’d like to read more about here? Comment below or email me and let me know.

  • Featured sources, February 27

    • CDC Museum COVID-19 Timeline: I recently learned that the CDC museum, which is part of the Smithsonian, has produced a detailed timeline of the COVID-19 pandemic in the U.S. It starts with the first cluster of COVID-19 patients in Wuhan, China, then include milestones in cases, treatments and vaccines, guidance changes, and more. The timeline currently ends in late 2021.
    • COVID-19 Data Dispatch resources: In absence of other outside sources this week, I wanted to send a reminder that the COVID-19 Data Dispatch maintains detailed annotations describing how states report vaccination data and COVID-19 cases in K-12 schools. Both sets of annotations are overdue for updates, which I’m planning to do in the next week!

  • National numbers, February 27

    National numbers, February 27

    COVID-19 metrics are dropping across the board. Chart via Conor Kelly, posted on Twitter on February 23.

    In the past week (February 19 through 25), the U.S. reported about 526,000 new COVID-19 cases, according to the CDC. This amounts to:

    • An average of 75,000 new cases each day
    • 160 total new cases for every 100,000 Americans
    • 38% fewer new cases than last week (February 12-18)

    Last week, America also saw:

    • 42,000 new COVID-19 patients admitted to hospitals (13 for every 100,000 people)
    • 12,000 new COVID-19 deaths (3.6 for every 100,000 people)
    • 100% of new cases are Omicron-caused (as of February 19)
    • An average of 200,000 vaccinations per day (per Bloomberg)

    The U.S. is now on week six of falling COVID-19 case numbers nationwide. New cases fell 38% from last week to this week, and are down 87% from one month ago. This is also the first week that the country has reported a daily new case average under 100,000 since early December.

    Hospitalizations also continue to fall, with about 30% fewer new COVID-19 patients entering U.S. hospitals this week compared to last week. And death numbers have also begun to come down—though they are still high, with over 1,500 people dying of COVID-19 each day.

    Case numbers are falling in every single U.S. state; five states and D.C. reported fewer than 100 new cases for every 100,000 residents in the past week, according to the latest Community Profile Report: Washington, Nebraska, Maryland, Nevada, and Ohio. Last week, Maryland was the first state to report case numbers below the CDC’s old high transmission threshold. (The new threshold is higher, which I’ll get into later this issue.)

    To quote prolific COVID-19 data commentator (and my former COVID Tracking Project colleague) Conor Kelly, whose chart is featured above: “There’s not all that much interesting to report on with COVID data right now. Things are getting better fast everywhere. It’s just a question of how long it continues.”

    That continuation depends largely on variants. As the Omicron surge recedes, how long will we see these decreases (or a plateau at low numbers) before a new variant drives another surge? 

    One key factor here is BA.2, the Omicron sub-lineage that has been slowly gaining ground in the U.S. over the past month as it is more transmissible than original Omicron. And I do mean slowly: according to CDC estimates, BA.2 went from causing an estimated 2% of new cases in the week ending February 12 to 4% in the week ending February 19. It seems to be having a limited impact on the country’s case decrease right now, but we’ll see if that changes in the coming weeks.

    Meanwhile, America’s vaccination campaign is stalling. According to the Associated Press: “The average number of Americans getting their first shot is down to about 90,000 a day, the lowest point since the first few days of the U.S. vaccination campaign, in December 2020.” More investment into reaching people who remain unvaccinated (and unboosted) is necessary if we want to be prepared for potential future surges.

  • Featured sources, February 20

    • COVID-19 drug order and inventory info: Rob Relyea has produced three interactive maps that show state-by-state availability for COVID-19 drugs: one for Sotrovimab, the one widely used monoclonal antibody treatment (out of three available in the U.S.) that is still effective against Omicron; one for Paxlovid, the highly effective Pfizer pill; and one for Evusheld, a monoclonal antibody drug that works preemptively for COVID-19, reducing COVID-19 risk for immunocompromised people. Click on a state to see drug provider locations and drug supplies.
    • (Updated) Vaccine Breakthrough Reporting Scorecard: A couple of months ago, I shared a scorecard from the Rockefeller Foundation and former COVID Tracking Project researchers that grades state reporting of breakthrough COVID-19 cases. This scorecard was recently updated. According to the Pandemic Prevention Institute’s twitter, as of this update: “46 states are now regularly reporting some breakthrough data. Currently, 5 states get an A, up from 4 states in January.”
    • Updated Long COVID source list: Journalists covering Long COVID can use this public database, compiled by myself and Fiona Lowenstein, to find patients, scientists, and advocates who are interested in talking to reporters for their stories. The database was published in January, but I recently updated it by adding a few new sources to the list. Read more about the resource here!

  • National numbers, February 20

    National numbers, February 20

    The majority of U.S. counties are still seeing high transmission, according to the CDC, but a few places like Maryland and New York City are starting to fall below this threshold.

    In the past week (February 12 through 18), the U.S. reported about 850,000 new COVID-19 cases, according to the CDC. This amounts to:

    • An average of 122,000 new cases each day
    • 259 total new cases for every 100,000 Americans
    • 43% fewer new cases than last week (February 5-11)

    Last week, America also saw:

    • 60,000 new COVID-19 patients admitted to hospitals (18 for every 100,000 people)
    • 14,000 new COVID-19 deaths (4.3 for every 100,000 people)
    • 100% of new cases are Omicron-caused (as of February 12)
    • An average of 200,000 vaccinations per day (per Bloomberg)

    New COVID-19 cases continue to drop in the U.S. as the country slowly comes down from its Omicron wave. This week, the country reported a total of 850,000 new cases, according to the CDC; it’s the first week under one million new cases have been reported since early December, though we are still seeing over 100,000 new cases a day.

    Hospitalizations are also going down, with the Department of Health and Human Services reporting about 65,000 beds in use for confirmed and suspected COVID-19 patients as of Saturday. The hospital circuit breaker dashboard (by Jeremy Faust et al.) shows that the vast majority of U.S. hospitals have capacity, as of this week. Still, over 2,000 Americans continue to die of COVID-19 each day.

    At the state level, we continue to see case decreases across the country. The one exception is Maine: this state saw a 350% increase in cases from last week to this week, according to the February 17 Community Profile Report. However, local reports suggest that a number of the new cases reported this week were backlogged—meaning the cases occurred weeks ago and were belatedly added to state tallies.

    After over a month of falling case numbers nationwide, some parts of the country are finally dropping below the CDC’s high transmission threshold (100 new cases for every 100,000 residents reported in a week). Maryland is the first state to do this, with 92 new cases for every 100,000 residents reported in the week ending February 17.

    New York City, where I live, also fell below the high transmission threshold this week, with 83 new cases for every 100,000 residents reported in the week ending February 15, according to city data. Both New York City and Maryland were early Omicron hotspots and have reported falling case numbers since early January.

    While Omicron overall continues to cause 100% of new COVID-19 cases in the country, BA.2, the slightly-more-transmissible sister lineage, is starting to gain ground. The CDC estimates that BA.2 caused 3.9% of new cases in the week ending February 12, compared to 1.5% of new cases in the previous week. As BA.2 continues replacing original Omicron, we’ll see if this subvariant has an impact on the U.S.’s downward case trends.

  • National numbers, February 13

    National numbers, February 13

    Current COVID-19 hospitalizations in the U.S. have fallen under 100,000 for the first time since the Omicron surge started. Chart by Conor Kelly, posted on Twitter on February 9.

    In the past week (February 5 through 11), the U.S. reported about 1.5 million new COVID-19 cases, according to the CDC. This amounts to:

    • An average of 215,000 new cases each day
    • 459 total new cases for every 100,000 Americans
    • One in 218 Americans testing positive for COVID-19
    • 43% fewer new cases than last week (January 29-February 4)

    Last week, America also saw:

    • 85,000 new COVID-19 patients admitted to hospitals (26 for every 100,000 people)
    • 16,000 new COVID-19 deaths (4.9 for every 100,000 people)
    • 100% of new cases are Omicron-caused (as of February 5)
    • An average of 300,000 vaccinations per day (per Bloomberg)

    COVID-19 cases continue to decline across the U.S. as the country comes out of its Omicron surge. Nationwide, the U.S. reported an average of 215,000 new cases a day last week—a drop of about 75% from the peak of the Omicron surge, when nearly 800,000 new cases were reported each day.

    Hospitalizations are also decreasing: this week, the number of confirmed and suspected COVID-19 patients in U.S. hospitals dropped under 100,000 for the first time since the surge started in December. Deaths are decreasing as well, but are still at high levels: over 2,000 Americans are dying of COVID-19 each day.

    All 50 states and the majority of counties continue to report case declines, according to the latest Community Profile Report. But case rates are still very high across the country, well above the CDC’s threshold for high transmission (more on this later in the issue).

    States with high case rates this week include Alaska, Kentucky, West Virginia, Montana, Mississippi, North Dakota, California, and Idaho; all reported over 700 new cases for every 100,000 residents in the week ending February 9.

    Omicron is still causing 100% of new cases in the country, according to CDC estimates. But the agency is now splitting its estimates into the original Omicron and its sister strain BA.2: BA.2 caused between 2% and 7% of new cases nationwide in the week ending February 5, the CDC says. In the coming weeks, we’ll see whether this strain—which is even more transmissible than original Omicron—has an impact on U.S. case numbers.

    New vaccination numbers have been fairly low for the past couple of weeks, with an average of under 300,000 shots given each day (including boosters). And the FDA is now delaying vaccine authorization for children under age 5: the agency has decided to wait for Pfizer to provide data on how well a three-dose series performs in this age group, after initially considering authorization based on data about two doses.

  • Sources and updates, February 6

    • Vaccination data from dialysis facilities: A recent addition to the CDC’s COVID Data Tracker, this dataset reports vaccination coverage among patients and staff working in dedicated dialysis facilities, which offer treatment to patients with chronic kidney diseases—a group at high risk for severe COVID-19. The vaccine coverage rates for dialysis staff are new as of this week. Overall, about 74% of dialysis patients and 79% of staff are fully vaccinated, and smaller percentages are boosted, as of late January.
    • CDC report provides vaccination data by sexual orientation and gender identity: As health equity advocates have pushed for more demographic data describing who’s been vaccinated in the U.S., the focus is often on race and ethnicity data. But it’s also important to track vaccinations among the LGBTQ+ community, as these Americans are at higher risk for severe COVID-19 due to HIV, mental health issues, and other conditions common in this group. This new CDC report provides a snapshot of these important data, sourced from the National Immunization Survey. Notably, the report found that vaccine coverage was higher overall among gay and lesbian adults compared to straight adults—but lower among Black LGBTQ+ people across all identities.
    • Association of child masking with COVID-related childcare closures: A new paper published in JAMA Network Open this week provides additional evidence showing that mask requirements can help keep schools and childcare centers open. The paper found that childcare programs where children were masked were 14% less likely to close over the course of a year than programs without child masking. For more commentary on the paper, see Inside Medicine.

  • National numbers, February 6

    National numbers, February 6

    COVID-19 cases are now on the decline almost everywhere in the U.S. (right), though they are still incredibly high throughout the country (left). Note that Tennessee appears (incorrectly) green on the left because of a data error. Chart from the February 3 Community Profile Report.

    In the past week (January 29 through February 4), the U.S. reported about 2.6 million new cases, according to the CDC. This amounts to:

    • An average of 378,000 new cases each day
    • 806 total new cases for every 100,000 Americans
    • One in 124 Americans testing positive for COVID-19
    • 38% fewer new cases than last week (January 22-28)

    Last week, America also saw:

    • 112,000 new COVID-19 patients admitted to hospitals (34 for every 100,000 people)
    • 17,000 new COVID-19 deaths (5.1 for every 100,000 people)
    • 100% of new cases are Omicron-caused (as of January 29)
    • An average of 300,000 vaccinations per day (per Bloomberg)

    Nationwide, new COVID-19 case numbers have decreased for the third week in a row. The country reported an average of 378,000 new cases each day last week—about half the daily case number reported at the peak of the Omicron surge three weeks ago.

    Hospitalizations are also decreasing, with the HHS reporting about 115,000 inpatient beds used for COVID-19 patients as of February 5—down from a peak of over 150,000. Still, hospitals across the country continue to be overwhelmed as they deal with staffing shortages and limited drugs that work against Omicron compared to past variants.

    National COVID-19 deaths passed 900,000 this week, according to the New York Times and other trackers. More than 2,000 Americans are dying of COVID-19 every day, and this trend is likely to continue as the Omicron surge wanes; as always, patterns in death data follow patterns in case data by several weeks.

    New case rates are dropping in all 50 states and almost all territories, according to the latest Community Profile Report. States with the highest case rates this week include Alaska, North Dakota, Washington, West Virginia, Wyoming, and Tennessee: all reported at or above 1,200 new cases for every 100,000 people in the week ending February 2.

    Remember, even though cases are going down, many parts of the country are still seeing far higher numbers than they did in previous surges. Even in New York City, now about a month past the peak of its Omicron surge, the city health department reported about 220 new cases for every 100,000 people last week—more than double the CDC threshold for high transmission. It’s important that we remain cautious until the numbers are truly low.

    As Omicron continues to spread—and as the U.S. reported record cases in children this past January—Pfizer has announced it plans to ask the FDA to authorize its vaccine for children under age 5. The problem is: Pfizer’s clinical trial data have, so far, demonstrated that a two-dose vaccine series with a very small dosage is effective in the youngest kids (6 months to 2 years), but not in kids ages 2 to 5. COVID-19 experts are split on this rather complicated situation; you can find more details at Your Local Epidemiologist and at STAT News.

  • Featured sources, January 30

    • KFF updates COVID-19 vaccine monitor: The Kaiser Family Foundation released a new report in its COVID-19 vaccine polling project this week, marking over a year since the U.S.’s vaccine rollout began. Notable updates from this report include: people are worried about Omicron’s impact on the economy and healthcare system, less worried about its impact on them personally; vaccine uptake “inched up in January” with more people getting their first doses; and gaps in booster shot uptake echo early gaps in vaccine uptake, with white Americans getting boosted at higher rates than Black and Hispanic Americans.
    • New version of the COVID-19 circuit breaker dashboard: A few weeks ago, I shared a dashboard from emergency physician Dr. Jeremy Faust and colleagues that estimates which U.S. states and counties are facing hospitals operating at unsustainable levels. The dashboard has now been updated, with help from Kristen Panthagani, Benjy Renton, Bill Hanage, and others; this new version includes hospital capacity and related metrics over time for states and counties, estimates of open beds, ICU-specific data, and more.
    • Biobot’s Nationwide Wastewater Monitoring Network: If you’re looking to monitor COVID-19 levels in U.S. wastewater, Biobot’s dashboard is a great source. The wastewater epidemiology company collects samples from water treatment facilities across the country; their dashboard includes both estimates of coronavirus levels in the U.S. overall and estimates for specific counties in which data are collected. The data are available for download on Github. (H/t Data Is Plural.)
    • Prisoners released in 2020, DOJ: A new report from the U.S. Department of Justice includes data on state and federal prisons during the COVID-19 pandemic. The number of inmates in these facilities declined about 15% from the end of 2019 to the end of 2020, according to this report. A large cause for this decline was overall disruption in the court system, not compassionate releases due to the pandemic: there was a 40% decrease in prison admissions from 2019 to 2020.
    • Companies requiring COVID-19 vaccinations: ChannelE2E, a news site covering the IT industry, has compiled this comprehensive list of major companies requiring their employees to get vaccinated. The list includes about 50 companies, and is regularly updated with links to news sources discussing policy changes. (H/t Al Tompkins’ COVID-19 newsletter.)