Category: Source spotlight

  • COVID source callout: The CDC’s slow variant updates

    COVID source callout: The CDC’s slow variant updates

    Due to reporting delays, the CDC’s variant data fails to convey Omicron’s rapid spread through the country. Chart retrieved on December 19.

    On Tuesday, the CDC updated the Variant Proportions tab of its COVID-19 data dashboard. This update included some alarming information: Omicron had jumped from causing about 0.4% of cases in the week ending December 4, to 2.9% of cases in the week ending December 11. In the New York and New Jersey area, it was causing 13% of cases.

    At this rate of increase, we can anticipate that, as of yesterday (December 18), Omicron is already causing roughly 21% of cases in the U.S.—and more than 90% of cases in New York and New Jersey. But because of the CDC’s delayed updates, the majority of people who go look at the CDC’s dashboard anytime before its next update, this coming Tuesday, would likely presume that Omicron is still causing a tiny minority of cases.

    I’ve written before about the delays in collecting and reporting coronavirus sequencing data. It can take weeks for a COVID-19 test sample to go from a patient’s nose to a nationwide sequencing database, which leads to inevitable lags in the U.S.’s genomic surveillance. This is understandable. But in a crisis moment, when Omicron is here and spreading rapidly, the agency should clearly label the lags and update its projections to provide a more accurate view of the variant’s growth. 

    What’s more, the CDC’s data update on Tuesday was not communicated widely; Director Dr. Rochelle Walensky gave a TODAY Show interview, and that was about it.

  • COVID source shout-out: Collecting Omicron data

    As the world waits for more information on Omicron, I’d like to give a shout-out to the scientists collecting data on this novel variant and sharing it with the public. As of today, over 500 Omicron sequences have been posted to the genome sharing site GISAID.

    If you’d like to keep up with the new sequences, there are three sources I recommend:

    • GISAID, an international organization working to quickly share data on coronavirus and flu virus strains.
    • Nextstrain, an open-source pathogen tracking platform supported by the Fred Hutchinson Cancer Research Center and other institutions.
    • CoVariants, a platform visualizing coronavirus variant data, run by Dr. Emma Hodcroft at the University of Bern with support from other scientists.

  • COVID source shout-out: Community Profile Reports

    We’re now approaching almost a year since the Department of Health and Human Services (HHS) first started publicly releasing Community Profile Reports, massive documents containing COVID-19 data at the state, county, and metro area levels.

    These reports were originally compiled internally, starting in spring 2020, for meetings of Trump’s White House Coronavirus Task Force. Reporters such as Liz Essley Whyte at the Center for Public Integrity were able to obtain some of the documents, but they remained a mostly-secret trove of data until the HHS started publishing them publicly in late December.

    At the time, I wrote that I was excited about the public release because these reports contain a wealth of information in one place—including contextual data (such as population-adjusted case numbers and demographic information) and rankings for policy-makers built right into the Excel spreadsheets.

    Since then, I’ve relied on Community Profile Reports for weekly data updates in this newsletter, along with numerous other stories. While their update schedule has not remained regular, the reports continue to be a one-stop shop for everything from vaccination rates to hospitalization metrics.

    So, this Thanksgiving weekend, I’m thankful for the Community Profile Reports. According to the HHS site, they’ve been downloaded almost 100,000 times, and probably a solid 300 of those are me.

  • COVID source callout: CDC’s breakthrough case data

    The CDC has not updated its breakthrough case data since September. A full two months ago.

    Earlier in 2021, the agency reported a total count of breakthrough infections, hospitalizations, and deaths—then switched to reporting only those breakthrough cases leading to hospitalization or death in May.

    The page that used to house this data now no longer includes total case counts; instead, the CDC redirects users to a couple of other pages:

    The CDC and FDA expanded booster shot eligibility to all adults in part because of increasing COVID-19 cases across the country.  But without comprehensive breakthrough case data, as I’ve said numerous times, it’s hard to pinpoint exactly how well the vaccines are working—and who’s most at risk of a breakthrough case.

    MedPage Today, which published a detailed article on this topic, received a statement from the CDC claiming that the breakthrough case and death data will be updated “in mid-November, to reflect data through October 2.” This long lag is due to the time it takes for the CDC to link case surveillance records to vaccination records, the agency said.

    Almost a year into the U.S.’s COVID-19 vaccination campaign, you’d really think our national public health system would have a better way of monitoring breakthrough cases by now.

  • (COVID) source shout-out: Data Is Plural

    This week, I want to give a shout-out to Data Is Plural: a newsletter by Jeremy Singer-Vine, the data editor at BuzzFeed News. Every Wednesday, Singer-Vine sends out links to and notes on a few interesting datasets, ranging from toxic pollution to movie script analysis.

    While this is not a COVID-specific source, the newsletter has frequently featured COVID-related datasets in the past two years—and I have occasionally pulled from it for my own featured sources section. I definitely recommend signing up for it, if you aren’t on the list already.

    Also, I got to hear Singer-Vine talk about his data editing philosophy at a training session yesterday, which was pretty cool. It was the first and only time I’ve ever heard someone read a Borges short story during a journalism webinar.

  • COVID source callout: Illinois, where’s your vaccination data?

    COVID source callout: Illinois, where’s your vaccination data?

    As I updated my vaccine data source annotations this weekend, I found that the state of Illinois has overhauled its COVID-19 dashboard. The dashboard now highlights a few key metrics tied to Illinois’ reopening status on its home page (new hospital admissions, available ICU beds, etc.), while a menu at the side of the dashboard links out to pages on several other COVID-19 topics, along with a data portal.

    I like the new organization. Illinois has had a pretty cluttered dashboard for a while, and it’s much easier to navigate through the new version. But there’s one big problem: in this reorganization, Illinois seems to have taken down the vast majority of its vaccination data.

    The new dashboard includes one vaccination chart on its homepage: vaccinations among Illinois residents over time (at least one dose and fully vaccinated). You can download vaccination data by county through the dashboard’s data portal section. And there are vaccination charts included in both the “long-term care data” and “school and youth data” pages.

    The vaccination chart on Illinois’ COVID-19 dashboard homepage. Screenshot taken on November 7.

    But Illinois used to report a lot more metrics, including vaccination coverage by different age ranges, dose inventory, and breakthrough hospitalizations and deaths. Illinois was one of the first states to report breakthrough cases of any kind, and (as far as I am aware), it was the only state to publicly report a count of “unusable vaccine doses,” those doses that went to waste due to defects or other issues.

    What happened to these vaccine metrics? Will the Illinois health department put them back in a future dashboard update? If any local reporters from the state are reading this, I would love to know more about what’s going on here.

  • COVID source callout:  Vaccination rates by Zodiac sign

    COVID source callout: Vaccination rates by Zodiac sign

    In last week’s newsletter, I gave a shout-out to the Salt Lake County Health Department, which posted this novel vaccination data on Twitter:

    The post drew a lot of attention in the COVID-19 data world, including with readers of the COVID-19 Data Dispatch. (Shout-out to the reader who sent me some bonus analysis of vaccinations by Zodiac element!) Unfortunately, additional research into the Salt Lake County Health Department’s data has shown me that the agency’s analysis might not be particularly robust—and I feel it is my journalistic duty to share this with you.

    Here’s the deal. In order to calculate vaccination rates by Zodiac sign, you need two things: vaccinations organized by birthday (your numerator), and the overall population organized by birthday (your denominator). Health departments can easily access the numerator, as it is standard for people to provide their birthdays along with other basic demographic information when they get vaccinated.

    But the denominator is trickier. The average U.S. public health department doesn’t have access to the birthdays of every resident in its jurisdiction; some information might be available from a large hospital system or primary care network, but it wouldn’t be comprehensive. So, for an analysis like the Salt Lake County agency’s, a researcher needs to find a substitute.

    In this case, the researchers used estimates of Zodiac sign representation in the entire U.S. population, apparently calculated in 2012. Not only are these numbers based on birthdays across the entire country (which could be pretty different from the birthdays in one Utah county!), they’re almost ten years old. There’s a lot of distance between these estimates and vaccination numbers among a 2021 Salt Lake City population.

    The public health workers acknowledged that their analysis is “not super scientific” in interviews with the Salt Lake Tribune. Still, the widely-shared Twitter post itself could do with a few more caveats, in my opinion.

    For more on the issues with the Salt Lake County department’s analysis, see this Substack post by Christopher Ingraham.

  • COVID source callout: Booster shot trends

    COVID source callout: Booster shot trends

    It’s now been almost two months since the CDC approved third vaccine doses for patients with weakened immune systems—and over two weeks since the agency approved third Pfizer doses for patients with increased breakthrough case risk. Since August 13, the CDC’s dashboard says, about 7.3 million Americans have received a third dose.

    As I mentioned in today’s National Numbers post, these booster shots are obfuscating the country’s vaccination trends. Over one million people have been vaccinated every day for the past week, but roughly half of those people were getting their booster shots.

    One might think I am sourcing that daily booster shot number from the CDC dashboard, but no: it comes, as many key COVID-19 data updates do these days, from the Twitter account of White House COVID-19 Data Director Cyrus Shahpar. The CDC has yet to add any booster shot data to its dashboard beyond a total count of doses administered.

    Shahpar’s daily updates. Screenshot taken on October 9.

    Much as I appreciate Shahpar’s daily updates, I would like to see the agency add those daily booster shot counts to its dashboard. And why stop there? The CDC should also provide information on the demographics of those getting booster shots, such as age and race/ethnicity, as well as geographic trends.

    Notably, the New York Times has added a booster shot trendline to its vaccination dashboard; see the chart titled “New reported people vaccinated.” As I noted last week, 15 states have added booster shots to their vaccine dashboards and reports as well, including three states that are reporting demographic breakdowns. The CDC is behind the data reporting curve, as usual.

  • Nebraska’s dashboard is back… Or is it?

    Nebraska’s dashboard is back… Or is it?

    Nebraska’s new, most likely short-lived, Hospital Capacity Dashboard. Screenshot taken on October 10.

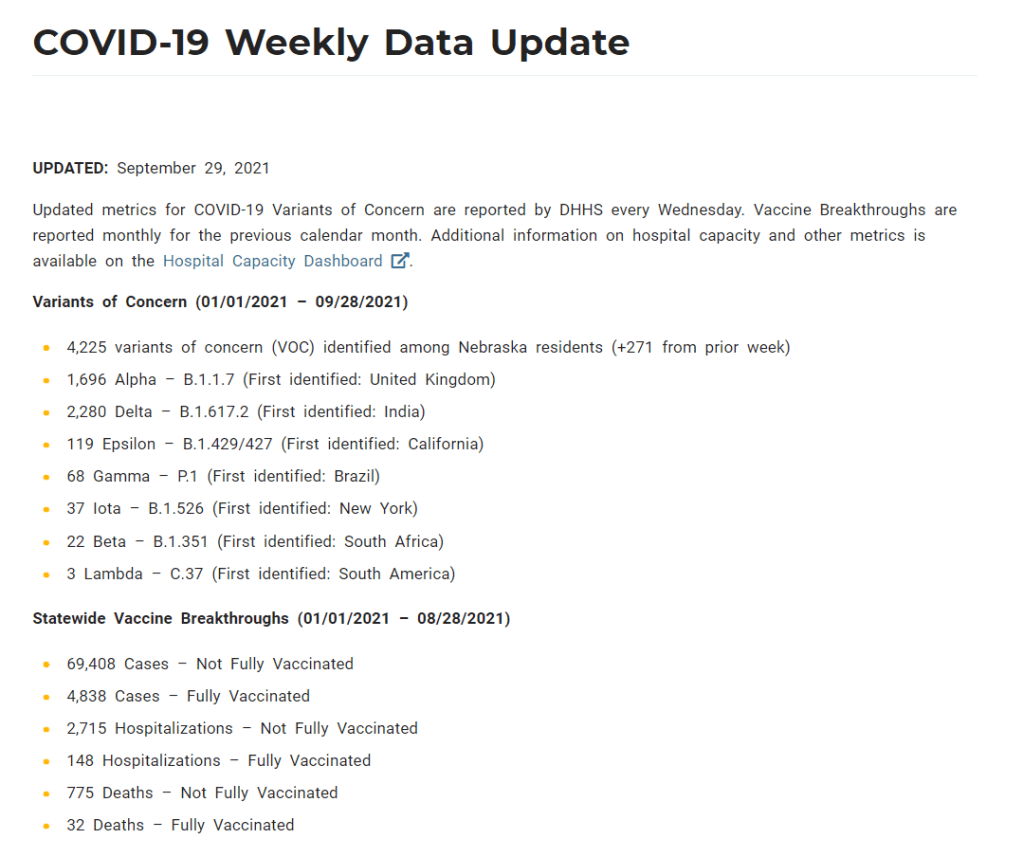
    Last week, I called out the state of Nebraska for basically demolishing its COVID-19 vaccination data. I wrote that the state’s “Weekly Data Update” report now includes just two metrics: variants of concern and vaccine breakthroughs. This came after the state discontinued its comprehensive COVID-19 dashboard in late June. (You can see screenshots of the old dashboard here.)

    While I was correct in writing that Nebraska’s weekly update is now incredibly sparse, I missed that the state has, in fact, brought back its COVID-19 dashboard—kind-of. A New York Times article by Adeel Hassan and Lisa Waananen Jones alerted me to this update.

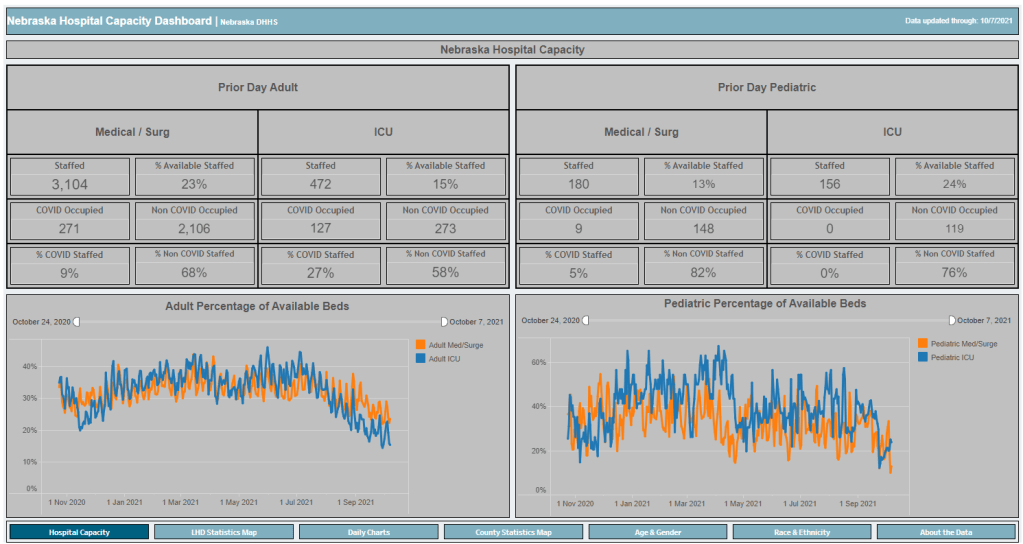
    Instead of resuming updates of the state’s previous dashboard, Nebraska’s state public health agency has now built a new, less comprehensive one, called the Nebraska Hospital Capacity Dashboard. As you might expect from the title, this new dashboard focuses on hospitalization data, such as the share of hospital beds available state-wide and by local public health region.

    But this new dashboard also includes some trends data (new cases, tests, and vaccinations by day, etc.) and demographics data. The demographics data are similar to what Nebraska provided on its old dashboard, reporting total cases, hospitalizations, deaths, and vaccinations by race, ethnicity, age, and gender.

    So, allow me to correct last week’s post: Nebraska is currently reporting more vaccination data than what the state is posting on its weekly reports page. However, the new dashboard, is short-lived, according to the NYT:

    On Sept. 20, after coronavirus hospitalizations surpassed 10 percent of the state’s capacity of staffed hospital beds, [Nebraska Governor Pete] Ricketts announced that county-level case data would once again be made public on a new “hospital capacity” state dashboard.

    But he said the data will disappear again if the number drops below 10 percent on a 7-day rolling average. And the state is still not reporting county-level deaths.

    Governor Ricketts ordered the new Hospital Capacity dashboard to be developed after public health experts and state legislators pushed for Nebraska to report more COVID-19 data. With limited state-level data and just a few Nebraska counties providing their own pandemic reports, residents were unable to see how the virus was spreading in their communities for all of July and August—when the Delta surge was at its worst.

    The new dashboard is a victory for Nebraska’s public health and medical experts. But state residents have very limited access to testing, leaving some experts to think the data on this dashboard may be “vast underestimates,” the NYT reports.

    Nebraska is not alone in cutting down on COVID-19 data reporting in recent months. Florida switched from a detailed dashboard and daily updates to pared-down weekly updates in June, and other states have stopped reporting on weekends or made other cuts. While the CDC and HHS continue to update their datasets daily, a lack of detailed data at the state level may heighten the challenge of another virus surge, if we see one this winter.

    More state data

  • COVID source callout: Nebraska’s weekly updates

    COVID source callout: Nebraska’s weekly updates

    On June 30, Nebraska’s public health department discontinued its COVID-19 dashboard. The dashboard had provided daily updates for cases, deaths, vaccinations, and other metrics. After June 30, it was replaced with a stripped-down “Weekly Data Update,”  providing a few major metrics, such as the cases reported and vaccine doses administered in the past week. This update is posted every Wednesday.

    When I checked on Nebraska yesterday for an update of my vaccine annotations page, I was shocked to find that the state’s Weekly Update has been pared down even further. It now includes just two metrics: variants of concern and vaccine breakthroughs. Nebraska’s health department is reporting: 1) the total cases identified as variants of concern in the state, and 2) total cases, hospitalizations, and deaths split by “fully vaccinated” and “not fully vaccinated.”

    This is literally the entire report. Screenshot taken on October 3.

    Compared to the detailed dashboard this state used to produce, this weekly update is incredibly sparse. It reminds me of a state COVID-19 data page from the early days of the pandemic—like, March 2020. If any local journalists from Nebraska are reading: I am so sorry.