
As I updated my vaccine data source annotations this weekend, I found that the state of Illinois has overhauled its COVID-19 dashboard. The dashboard now highlights a few key metrics tied to Illinois’ reopening status on its home page (new hospital admissions, available ICU beds, etc.), while a menu at the side of the dashboard links out to pages on several other COVID-19 topics, along with a data portal.
I like the new organization. Illinois has had a pretty cluttered dashboard for a while, and it’s much easier to navigate through the new version. But there’s one big problem: in this reorganization, Illinois seems to have taken down the vast majority of its vaccination data.
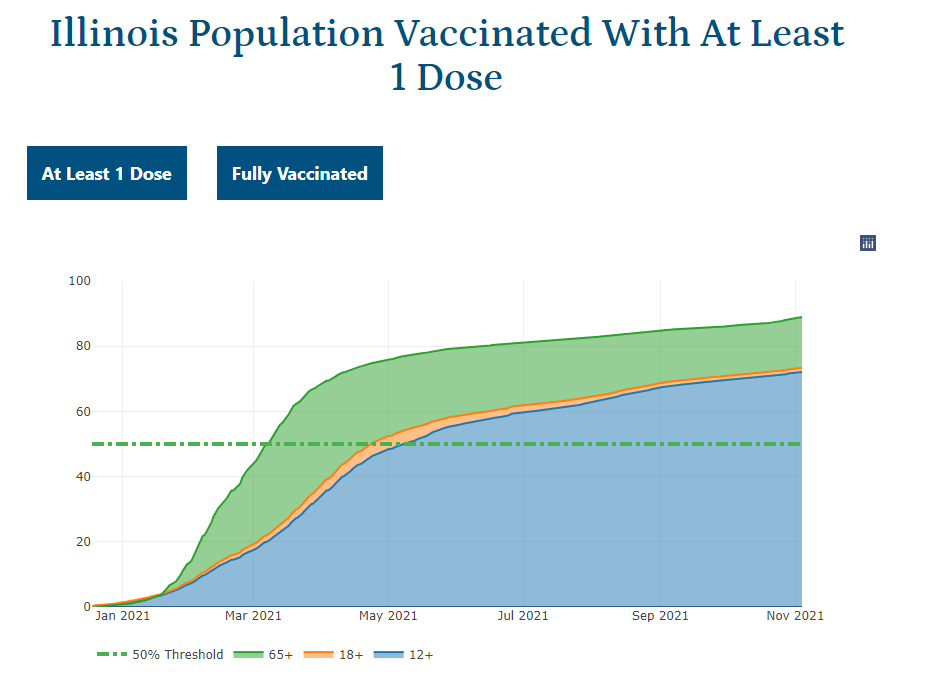
The new dashboard includes one vaccination chart on its homepage: vaccinations among Illinois residents over time (at least one dose and fully vaccinated). You can download vaccination data by county through the dashboard’s data portal section. And there are vaccination charts included in both the “long-term care data” and “school and youth data” pages.
But Illinois used to report a lot more metrics, including vaccination coverage by different age ranges, dose inventory, and breakthrough hospitalizations and deaths. Illinois was one of the first states to report breakthrough cases of any kind, and (as far as I am aware), it was the only state to publicly report a count of “unusable vaccine doses,” those doses that went to waste due to defects or other issues.
What happened to these vaccine metrics? Will the Illinois health department put them back in a future dashboard update? If any local reporters from the state are reading this, I would love to know more about what’s going on here.

Leave a comment