Author: Betsy Ladyzhets

  • The future of tracking Long COVID

    The future of tracking Long COVID

    Hispanic or Latino New Yorkers were more likely to report Long COVID symptoms than other demographic groups, in a 2021 survey by the city health department. Chart via THE CITY.

    I had two new articles about Long COVID published this week:

    • This story in Science News describes how researchers are working to fill gaps in Long COVID data, largely by collaborating with patients and across different areas of medicine.
    • This story in Gothamist/WNYC describes three public Long COVID clinics run by New York City Health + Hospitals, which offer a range of care to New Yorkers with the condition but fall short of all the specialties needed for comprehensive treatment.

    The reporting process for both stories gave me a lot to think about, in considering potential improvements in recording who has Long COVID and how this chronic disease impacts people.

    And we have a lot of room for improvement. There are plenty of reasons why Long COVID research and data collection are currently difficult, ranging from a lack of consistency in how the condition is diagnosed to historical underfunding for similar chronic diseases like myalgic encephalomyelitis/chronic fatigue syndrome (ME/CFS) and dysautonomia. For more details, see this post I wrote in May.

    The U.S. scientific and medical systems also made specific mistakes early in the pandemic that contributed to our current data gaps, including the dearth of PCR testing—leading many current long-haulers to not have positive test results from their initial infections—and early refusals by many doctors to believe patients’ prolonged symptoms had resulted from the coronavirus. Most medical schools do not spend much time training new doctors to recognize complex, chronic diseases, leaving them unprepared to tackle Long COVID.

    But these problems can be addressed—especially if doctors and researchers are willing to step outside their specific fields to collaborate with each other and with patients. Here are a few specific recommendations that I learned about in reporting my stories for Science News and Gothamist/WNYC.

    Listen to and collaborate with patients.

    “Patients know the right questions to ask to properly document their experience,” Lisa McCorkell, one of the founders of the Patient-Led Research Collaborative (PLRC), told me in an email interview for my story.

    In fact, a survey study by PLRC in which patient-researchers asked other long-haulers to describe their symptoms is considered one of the most comprehensive accounts of this condition. Other researchers have used this list of symptoms in designing their own patient surveys.

    Surveys are one important mechanism of compiling patient experiences, as they can capture information that does not make it into medical records. (Common Long COVID symptoms like post-exertional malaise often are not well-captured in these records.) But patients can also weigh in on other aspects of study methodologies, such as how to collect data in a way that won’t overly tax participants or how to compare groups of patients for accurate results.

    Plus, hypotheses from patients can be valuable starting points for clinical trials, as Julia Moore Vogel from the Scripps Research Translational Institute explained to me. Vogel, who is a long-hauler herself, is working on a new study at Scripps that’s informed by her and other patients’ experiences with Garmin wearable devices. The projects funded by PLRC’s grant program offer further examples of research studies informed by patient priorities.

    Connect health records from different sources.

    One major challenge with studying Long COVID is that this complex condition can impact every organ system in the body. You can’t just analyze heart disease records from a cardiology practice, or lung function records from a pulmonary practice. Every patient could be seeing ten or more different specialists, and all of those doctors might inform different pieces of the overall disease puzzle.

    As a result, devising systems that better compile and connect records from different sources is a priority for researchers studying Long COVID. Arjun Venkatesh, a patient-reported outcomes researcher, described this as “the clunkiest part” of his work: there are a lot of “hidden barriers” to connecting records, he said, ranging from privacy protections to technical mismatches. (For example, a patient requesting their records from a particular doctor might be asked to provide a fax number, something most people do not have in 2022.)

    Still, new projects are in the works to make this type of data sharing easier. One example is Kindred, an app designed by Yale researchers that empowers patients to request their electronic health records and share them with scientists studying Long COVID. Patients also have more legal protections in making data requests now, thanks to a new federal rule that took effect this fall.

    Use wearables and other new tracking technologies.

    Smart watches, Fitbits, and other similar trackers are usually advertised for consumers interested in better tracking their individual health and fitness. But they can also provide valuable, long-term data to researchers studying health conditions like Long COVID.

    The Scripps Research Translational Institute is one institution focused on wearable devices, through studies like Vogel’s and another program called the DETECT study, led by epidemiologist Jennifer Radin. In DETECT, researchers compile data from people across the country who have volunteered to share their wearable device data with Scripps. After one of the participants gets COVID-19, the scientists can compare their post-COVID health indicators to the patient’s pre-COVID baseline.

    “We compare each person to themselves over time,” Radin told me when I talked to her for my Science News story. This method is different from traditional medical research, in which two similar groups of people are compared to each other on a population-wide basis.

    Wearables research faces a lot of its own challenges, such as expanding access to more people (by making devices more affordable or even giving them to study participants for free) and creating analysis systems that can make sense of thousands of data points from each patient. But I personally find it fascinating and hope to continue covering this area. I was even inspired by my reporting to buy a smart watch, as a holiday present to myself.

    Local surveys and outreach in partnership with community groups.

    Anyone can get Long COVID—young or old, vaccinated or unvaccinated, with or without prior health conditions. But a lot of people still don’t know about this chronic condition, even when they might be experiencing long-term symptoms themselves.

    As a result, a major priority for Long COVID researchers and patient-advocates is improving education and outreach about this condition. New York City has a program that could serve as an example here: NYC Health + Hospitals runs a hotline called AfterCare, which residents can call to learn about Long COVID and city resources, including the public clinics I wrote about.

    While AfterCare has proactively called New Yorkers who previously tested positive for COVID-19, the program’s administrators are concerned that it’s likely not reaching everyone who could be served by the hotline. Local long-haulers who I talked to for my Gothamist/WNYC story want to see broader outreach—like subway ads, billboards, and commercials—telling people about Long COVID.

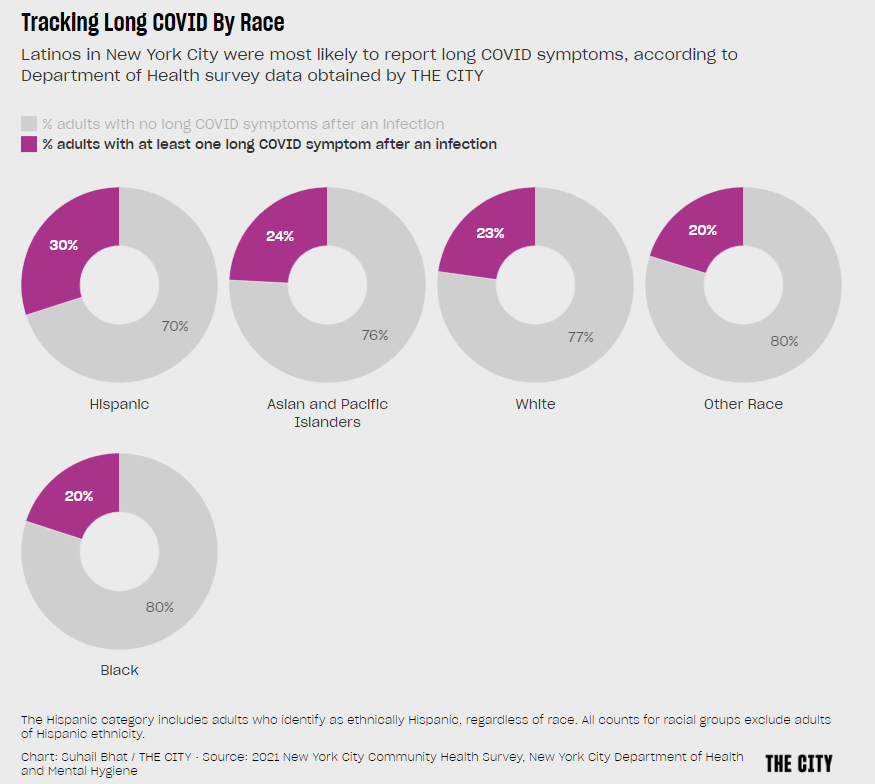
    These same outreach programs could also help researchers collect more comprehensive data about Long COVID. Last week, THE CITY, another local NYC outlet, reported on some early results of a survey conducted by the city health department to find out which groups of New Yorkers are most vulnerable to the condition. Unsurprisingly, the survey found that Hispanic/Latino residents and those living in the Bronx were disproportionately impacted.

    I hope to see more local health agencies follow in NYC’s lead to conduct surveys like this one, paired with outreach and education about Long COVID. This type of data could go a long way in showing political leaders where more resources are needed.

    More Long COVID reporting

  • National numbers, December 4

    National numbers, December 4

    All four major regions of the country are reporting increased coronavirus levels in their wastewater, per Biobot. Data as of November 28.

    In the past week (November 24 through 30), the U.S. reported about 303,000 new COVID-19 cases, according to the CDC. This amounts to:

    • An average of 43,000 new cases each day
    • 92 total new cases for every 100,000 Americans
    • 1% fewer new cases than last week (November 17-23)

    In the past week, the U.S. also reported about 29,000 new COVID-19 patients admitted to hospitals. This amounts to:

    • An average of 4,200 new admissions each day
    • 9.0 total admissions for every 100,000 Americans
    • 18% more new admissions than last week

    Additionally, the U.S. reported:

    • 1,800 new COVID-19 deaths (250 per day)
    • 63% of new cases are caused by Omicron BQ.1 and BQ.1.1; 6% by BF.7; 5% by BN.1;  6% by XBB (as of December 3)
    • An average of 200,000 vaccinations per day

    If the U.S. wasn’t at the start of a COVID-19 surge before Thanksgiving, we’re certainly in one now. While official case counts have stagnated, wastewater surveillance indicates that the country is seeing about 1.5 times the coronavirus transmission that we had three weeks ago, according to data from Biobot.

    All four major regions of the country are experiencing clear upward trends in COVID-19 spread, per Biobot, with no sign of peaking; this is the first time there’s been a unified national increase since mid-summer. Individual metropolitan areas from Boston, to the Twin Cities in Minnesota, to Los Angeles, are reporting major upticks.

    The current difference between wastewater surveillance trends and case trends further confirms what I’ve been saying for months: case data simply are no longer that helpful for seeing early warnings of surges, as few people seek out PCR testing compared to earlier points in the pandemic. If you don’t already have a good place to see wastewater data for your community, put some pressure on your local officials to make this information available.

    The U.S.’s new increase in transmission can likely be attributed to travel and gatherings over the Thanksgiving holiday, combined with newer, more-transmissible versions of Omicron. Lineages BQ.1 and BQ.1.1 caused almost two-thirds of new cases in the week ending December 3, according to CDC estimates, while XBB caused about 6% of new cases.

    XBB has been spreading intensely in some Asian countries, and experts are watching to see how it competes with the alphabet soup of subvariants already circulating in the U.S. So far, it is most prevalent in the Northeast, per the CDC.

    In addition to wastewater trends, new hospital admissions for COVID-19 went up this week: about 18% more patients were admitted to hospitals around the country in the week ending November 30 compared to the prior week. These patients are entering a hospital system already overwhelmed by flu, RSV, and other respiratory viruses.

    As epidemiologist Caitlin Rivers noted in her newsletter last week: “The cumulative hospitalization rate for influenza is already on par with where we would expect to be in December or January.” And that virus continues to spread further, with most of the country experiencing high or very high levels of influenza-like activity.

    COVID-19 and these other viruses might not seem like a big deal thanks to vaccines and treatments, but they can still have very severe consequences. For example, New York City just reported that three children died of COVID-19 in recent weeks. And the risk of Long COVID remains, too.

  • Sources and updates, November 27

    • More data on the new, bivalent boosters: A new study, published this week in the CDC’s Morbidity and Mortality Weekly Report, has further evidence that the new, Omicron-specific booster shots provide additional protection against COVID-19 for people who previously received the original vaccines. Researchers used test results from pharmacies to compare symptomatic COVID-19 cases among people who had received the new boosters to those who had only received older vaccines. New booster recipients were less likely to get sick, they found, indicating protection against Omicron BA.4, BA.5, and their sublineages. In short: if you haven’t gotten one of the new boosters yet, now is a good time!
    • Patient-Led Research Collaborative announces grant winners: The Patient-Led Research Collaborative, an organization of Long COVID patient-researchers that has produced groundbreaking work about this condition, just announced the winners of its $5 million fund to support new biomedical research on Long COVID. The winning projects will pursue avenues of top priority to patients, such as understanding post-exertional malaise, testing for microclots, and a clinical trial for the drug naltrexone. Projects were themselves evaluated by a panel of patient experts and patients will be heavily involved in the resulting research. Congrats to the PLRC team on this announcement, and I look forward to following the results of these studies!
    • HHS publishes Health+ Long COVID report: Another piece of Long COVID news this week: the Department of Health and Human Services published a report summarizing interviews with people who have Long COVID. The report was one of several responses to the Biden administration’s call last spring for Long COVID research and support programs. It describes patients’ desires for meaningful research, better healthcare, financial support, and more. While this new report may not be adding much to the body of knowledge about Long COVID, it’s helpful to see this information coming from a major government source.
    • Football games associated with COVID-19 spread: And one more study that caught my attention this week: a new paper in JAMA Network Open describes a correlation between National Football League (NFL) games and COVID-19 spikes in the surrounding counties during the league’s 2020-2021 season. Counties hosting more popular games (with at least 20,000 fans present) were more likely to see increased COVID-19 spread afterwards. The paper shows how large events can contribute to widespread disease transmission, even among people who didn’t themselves attend the events.

  • Donate to the COVID-19 Data Dispatch!

    This week, you’ve probably been inundated with shopping deals and donation requests from every business that has you on its email list. ‘Tis the season to ask for money, after all.

    But how many of those asks are from a one-reporter operation delivering crucial COVID-19 news and resources?

    I often hear from readers that the COVID-19 Data Dispatch is their favorite source for pandemic news, or even their only source for pandemic news. This is something that flatters and terrifies me—like, I cannot stress enough that I am not a health professional, and I should not be taking the place of an actual public health institution. I am simply a science and health journalist who cares very much and works very hard.

    That said, our actual health institutions (like our media, our political leaders, and so many other institutions) continue to pretend COVID-19 is no longer a problem—leaving people like me to pick up their slack.

    So, if you have found this newsletter, this blog, or any of my other COVID-related writing and analysis valuable: please consider donating to support my work. You can either make a monthly donation with Pico or a one-time donation with Ko-fi.

    This support helps to cover my website and other tech costs (detailed here), as well as the occasional article from a guest contributor. It also helps support my time, as I work on this project largely during my evenings and weekends.

    Even small donations go a long way. And if you’re not able to support the COVID-19 Data Dispatch financially right now, your regular readership still means a lot. Thank you!

  • COVID source shout-out: New NIH tool to report at-home test results

    COVID source shout-out: New NIH tool to report at-home test results

    Make My Test Count is a new NIH website for people to report at-home COVID-19 test results.

    This week, the National Institutes of Health launched a new website that allows people to anonymously report their at-home test results. While I’m skeptical about how much useful data will actually result from the site, it could be a helpful tool to gauge how willing Americans are to self-report test results.

    The website, MakeMyTestCount.org, puts users through a series of basic questions about their at-home test experience: your test result, the test brand you used, when you tested, and whether you have COVID-19 symptoms. The site also asks for basic demographic information, including your age, ZIP code, race, and ethnicity. After you report your test result, the website provides additional context on interpreting that result, such as suggesting a repeat test in the next two days if you have symptoms.

    These survey questions mimic the information that typically gets collected when someone receives a PCR test, and the resulting data could potentially be used to examine who is using at-home tests and what their results are. The NIH’s Rapid Acceleration of Diagnostics (or RADx) initiative, a program to speed up development and use of COVID-19 testing technologies, designed the website.

    Of course, there are a lot of potential issues here. This website was launched more than two years after the first COVID-19 rapid tests were authorized and almost one year after they gained widespread popularity during the first Omicron surge. No matter how many people report their results now, the NIH will miss a lot of data and a lot of opportunities to advertise the site.

    And how many people will report their results now? Pandemic safety measures like at-home testing are less popular than they were a year ago, and the launch of this website doesn’t seem to be paired with a public outreach campaign about using and reporting at-home tests. Basically, the results shared with the NIH are likely to be biased towards people who still care about taking precautions (and those who pay attention to federal COVID-19 resources). It’s also very easy to submit false results, as the website doesn’t ask for a photo of your test or anything similar.

    Still, I’m excited to see this website launched—collecting some at-home test results is better than no test results! I hope lots of people use it, and I look forward to seeing any data the NIH eventually releases from the tool.

  • National numbers, November 27

    National numbers, November 27

    BA.5 sublineages BQ.1 and BQ.1.1 are now the dominant variants in the U.S., while newer lineage XBB has made an appearance. Chart via the CDC.

    In the past week (November 17 through 23), the U.S. reported about 310,000 new COVID-19 cases, according to the CDC. This amounts to:

    • An average of 44,000 new cases each day
    • 93 total new cases for every 100,000 Americans
    • 8% more new cases than last week (November 10-16)

    In the past week, the U.S. also reported about 24,000 new COVID-19 patients admitted to hospitals. This amounts to:

    • An average of 3,400 new admissions each day
    • 7.2 total admissions for every 100,000 Americans
    • 0.2% more new admissions than last week

    Additionally, the U.S. reported:

    • 2,600 new COVID-19 deaths (380 per day)
    • 57% of new cases are caused by Omicron BQ.1 and BQ.1.1; 7% by BF.7; 3% by BN.1;  3% by XBB (as of November 26)
    • An average of 300,000 vaccinations per day

    Nationwide, reported COVID-19 cases went up last week: the CDC reports 8% more cases in the week ending November 23 than in the week ending November 16. Wastewater monitoring also suggests a pre-Thanksgiving uptick, according to Biobot, while new hospitalizations have been at a plateau.

    All eyes will be on wastewater data in the next couple of weeks, to look for potential spread after Thanksgiving travel and gatherings. We likely won’t see any immediate spikes in case data thanks to the data delays that always happen after holidays, but wastewater surveillance is less susceptible to these delays (and less biased by behavioral patterns). To look for wastewater data in your community, see the COVID-19 Data Dispatch’s resource page.

    Any outbreaks we see in the coming weeks will likely be driven by newer coronavirus variants, combining forces with holiday behavior. Omicron subvariants BQ.1 and BQ.1.1 caused about 57% of new COVID-19 cases in the week ending November 26, according to CDC estimates; the BQ lineage is more transmissible than its parent variant, BA.5, though it has not caused major case spikes in the U.S. yet.

    The CDC’s latest variant update also provides estimates on XBB, a subvariant that evolved from BA.2 and that has caused new surges in some Asian countries. XBB caused about 3% of new cases in the last week, the agency estimates, with higher prevalence in the Northeast and West coast. Health officials are closely watching XBB due to the many mutations on its spike protein, but it’s unclear whether this subvariant alone could cause a new surge.

    As we watch for new COVID-19 outbreaks, healthcare systems—especially children’s hospitals— across the country are already facing intense pressure from the flu, RSV, and other respiratory viruses. Many states, particularly on the East coast and in the South, continue to report very high levels of influenza-like activity, according to the CDC

    If you took part in a Thanksgiving gathering over the last few days: this week, you should look out for any respiratory symptoms and consider getting a PCR test, if you can. If possible, get a test that will check for COVID-19, the flu, and RSV at once. Make sure any disease spread stops with you!

  • Sources and updates, November 20

    • CDC update on COVID-19 mortality trends: This week, the CDC published a detailed report about how deaths from COVID-19 have changed in 2022. Overall, between 2,000 and 4,500 COVID-19 deaths were reported each week between April and September 2022, the CDC researchers found; this is lower than at earlier points in the pandemic, but still represents a loss of more than 100,000 Americans over the course of a year. Older adults and those who were un- or under-vaccinated had a higher risk of death from COVID-19, the researchers found; racial and ethnic disparities have “decreased, but persisted.”
    • Moderna reports new data on its bivalent booster: Several studies in the last couple of weeks have indicated that the new, Omicron-specific boosters from Pfizer and Moderna are more effective against new variants than the older vaccines. Moderna provided additional data this week, reporting that its new booster led to five times more antibodies that neutralize Omicron BA.4 and BA.5 compared to earlier booster shots. While Moderna’s study hasn’t yet been peer-reviewed, the results are promising in following a trend from past studies, STAT’s Matthew Herper reports.
    • Booster shots could keep kids from missing school: Speaking of the new boosters: a new report from the Commonwealth Fund provides analysis of the boosters’ potential impact on school-aged children, as all kids older than five are eligible for the shots. If 80% of eligible Americans receive their bivalent boosters by the end of 2022, the report suggests, this could save over 46 million days of isolation and over 50,000 hospitalizations for school-aged children, along with other benefits. Even getting kids boosted at the level of flu vaccination in 2020-2021 would prevent millions of days of school from being lost.
    • Test to treat is inaccessible to rural Americans: A new study, published this week in JAMA Network Open, examined equity issues with the Biden administration’s Test to Treat initiative. The initiative was designed to provide locations where Americans could get a COVID-19 test and then, if they received a positive result, quickly receive a free antiviral drug. But many people don’t live near available locations, the researchers found: “approximately 15% of the overall US population, 30% of American Indian or Alaskan Native people, and 59% of the rural population lived more than 60 minutes from the nearest site,” they write.
    • Perception of local COVID-19 levels: A lot of people are acting with incorrect knowledge of their local COVID-19 risk, a new study in the CDC’s Morbidity and Mortality Weekly Report suggests. Researchers from several medical and public health institutions surveyed people who had recently tested positive for COVID-19 in Detroit, Michigan and DuPage County, Illinois, during June and July, 2022. About half of the 5,000 people surveyed said that they thought local COVID-19 transmission was “low or moderate,” even though it was actually at high levels in both places.

  • Long COVID book recommendations

    Long COVID book recommendations

    The Long Haul and The Long COVID Survival Guide, pictured on Betsy’s desk. (Photo by Betsy Ladyzhets.)

    Two new books about Long COVID were published this month, and I’d like to recommend both of them to any readers interested in learning more about the condition—especially to other journalists covering COVID-19.

    First, The Long COVID Survival Guide (from the Experiment Publishing, released November 8) is a compilation of essays from people with Long COVID, for people with Long COVID, edited by journalist and Body Politic founder Fiona Lowenstein. The book covers everything from getting a medical diagnosis to finding community with advocates for other chronic illnesses.

    The Survival Guide is structured like a manual, every chapter ending with specific “survival tips” for long-haulers to use in their own Long COVID journeys. But it’s also a very relevant read for people who don’t have Long COVID, as it provides context about the different challenges long-haulers might go through: medical gaslighting, cognitive challenges, women’s health issues, learning to ask for help, and more.

    Personally, I got a lot of ideas for future journalism projects from this book. As someone covering scientific research and data, I found the chapters about getting a diagnosis (by Dona Kim Murphey, Rachel Robles, and David Putrino) and about navigating Long COVID research (by Lisa McCorkell) particularly valuable.

    Second, The Long Haul (from Simon & Schuster, released November 15) is a nonfiction narrative about how people with Long COVID came together to better understand the condition and advocate for themselves. Author Ryan Prior is a journalist with experience at CNN and other national outlets, and has lived with myalgic encephalomyelitis/chronic fatigue syndrome (ME/CFS) since he was a teenager.

    Prior brings his lived experience and his journalistic experience—which includes covering other chronic illnesses and patient advocacy movements—to covering Long COVID. The book provides valuable backstories on major Long COVID groups, like Body Politic, the Patient-Led Research Collaborative, and the COVID-19 Longhauler Advocacy Project. It also describes early research efforts seeking to better understand Long COVID, including the first stages of the National Institutes of Health’s RECOVER study.

    I’m still reading The Long Haul (as of this writing, I’m a couple of chapters in), but am already finding it incredibly helpful to learn about how Long COVID advocates started pushing for research and recognition, with context from ME/CFS and other post-viral illness work.

    The Long COVID Survival Guide and The Long Haul might not be the most upbeat reading choices for the holiday season, but they’re really vital for anyone engaging with Long COVID—whether you’re a journalist covering this topic or a friend to a long-hauler. To quote from Dr. Akiko Iwasaki’s afterword, in the Survival Guide:

    Long COVID has changed the narrative. The world no longer has any excuse to make the same mistake over and over again, as we have done for previous pandemic and endemic infections. It’s finally time for us to listen.

    Transparency note: I received advanced copies of both of these books to aid in my work as a journalist covering Long COVID, but am not getting any compensation to write this post—i.e., this isn’t sponsored content or anything. I genuinely want more people to learn about and read these books!

    More Long COVID reporting

  • Where to find wastewater data for your community

    Where to find wastewater data for your community

    The Massachusetts Department of Public Health is one of the latest state agencies to set up a public wastewater dashboard.

    As we head into the holidays with limited COVID-19 testing and undercounted case numbers, wastewater surveillance is the best way to evaluate how much the virus is spreading in your region. And it’s now available in more places than ever, thanks to the many research groups and public health agencies setting up sewage testing.

    To help you find wastewater surveillance in your area, I recently updated my COVID-19 Data Dispatch resource page about U.S. wastewater dashboards. The page includes links to and notes about national, state, and a few local dashboards.

    Let’s review the options. First, there are now three national dashboards with U.S. wastewater data, each covering a different set of locations.

    • The CDC’s National Wastewater Surveillance System is the biggest, including more than 1,000 sites from almost every state, though some states have far better coverage than others. Click on an individual site to see coronavirus trends for that location.
    • Biobot Analytics is the biggest private company doing wastewater surveillance; it provides analysis for hundreds of sites in the CDC NWSS network as well as its own, separate network. Biobot’s national and regional data (which include NWSS sites) are particularly helpful for large-scale trends.
    • WastewaterSCAN is a project that started from an academic partnership between Stanford University, Emory University, the University of Michigan, and communities in California. It’s since expanded to include sites in about 20 states, and participating sewersheds are tested for monkeypox, flu, and RSV in addition to the coronavirus.

    Second, 21 states currently have their own wastewater dashboards or reporting systems. If this is available in your area, I highly recommend looking at your local dashboard in addition to the national options. State and local dashboards tend to include more detailed and/or more frequently updated data, and are often tailored to their community’s needs more closely.

    These are the states with wastewater dashboards; see the resource page for links and more info:

    • California, Colorado, Georgia, Hawaii, Idaho, Indiana, Maine, Maryland, Massachusetts, Michigan, Minnesota, Missouri, Nebraska, New York State, North Carolina, Ohio, Oklahoma, Oregon, Utah, West Virginia, Wisconsin.

    Wastewater trends do not correspond directly to infection trends, because people sick with COVID-19 might shed the virus at different rates (based on where they are in their infection, variants, and other factors). Some researchers are working to better understand the correlation between wastewater trends and cases, but for now, the sewage data are best understood as a broad indicator of risk—not a precise estimate of how many people in your community are sick.

    For tips on interpreting wastewater data, I recommend looking at past COVID-19 Data Dispatch posts on this topic, as well as this FAQ from the People’s CDC.

    More wastewater data

  • National numbers, November 20

    National numbers, November 20

    Data from the CDC indicate that much of the country is seeing high flu levels. Chart as of November 12.

    In the past week (November 10 through 16), the U.S. reported about 280,000 new COVID-19 cases, according to the CDC. This amounts to:

    • An average of 40,000 new cases each day
    • 86 total new cases for every 100,000 Americans
    • 3% fewer new cases than last week (November 3-9)

    In the past week, the U.S. also reported about 24,000 new COVID-19 patients admitted to hospitals. This amounts to:

    • An average of 3,400 new admissions each day
    • 7.3 total admissions for every 100,000 Americans
    • 1% fewer new admissions than last week

    Additionally, the U.S. reported:

    • 2,200 new COVID-19 deaths (320 per day)
    • 50% of new cases are caused by Omicron BQ.1 and BQ.1.1; 8% by BF.7; 5% by BN.1;  2% by BA.2.75 and BA.2.75.2 (as of November 19)
    • An average of 400,000 vaccinations per day

    Nationwide, reported COVID-19 cases and new hospital admissions are still in a plateau; both metrics declined very slightly this week after rising slightly last week (declining by 3% and 1%, respectively).

    While we have yet to see as clear of a fall/winter surge as we did in the last two years, infection levels are still quite high. Evidence for this comes from wastewater data, which doesn’t rely on people getting PCR tests; trends from Biobot suggest that viral transmission is at a similar level to late October/early November of last year, when Delta was still the dominant variant.

    Biobot’s data also indicate that the West coast region is now seeing a notable uptick in COVID-19 spread, taking over from the Northeast (which has been a regional hotspot since September). Wastewater testing sites in cities like Los Angeles is reporting significant transmission spikes in the last couple of weeks.

    The West coast, like the Northeast, has been a hotspot for newer Omicron subvariants BQ.1 and BQ.1.1, according to CDC estimates. Nationwide, the BQ lineage caused about half of new cases in the last week—solidly outcompeting its parent lineage, BA.5. And there are several other Omicron subvariants spreading, including two lineages from BA.2, BF.7 and BN.1.

    With all these new variants circulating and colder weather throughout the country, why haven’t we seen a significant jump in COVID-19 spread? It’s possible that the U.S. has enough prior immunity from vaccinations and past infections to prevent a big surge, White House COVID-19 coordinator Ashish Jha said at the STAT Summit last week.

    I hope Jha is right, but I personally remain skeptical. Way too few people have received the new booster shots that protect against Omicron variants, while we’re heading into several weeks of holiday travel and gatherings—with fewer COVID-19 protections than in the last two years.

    At the same time, the U.S. is dealing with flu and RSV surges. About a dozen states, plus New York City and Washington, D.C., reported “very high” levels of influenza-like activity in the week ending November 12, according to the CDC. And the country’s RSV wave continues at high intensity, though it might be reaching its peak.

    These two respiratory diseases may be less severe than COVID-19 at an individual level (especially accounting for the burden of Long COVID), but they can still put intense pressure on healthcare systems—especially those focused on treating children. Wearing a mask, avoiding indoor crowds, improving ventilation, and other measures can protect against all three diseases.