Washington’s dashboard includes coronavirus concentration levels over time from a selection of wastewater treatment plants in the state, with data going back to early 2022. It also includes some helpful notes about how to interpret wastewater data and maps showing the service areas for each treatment plant.
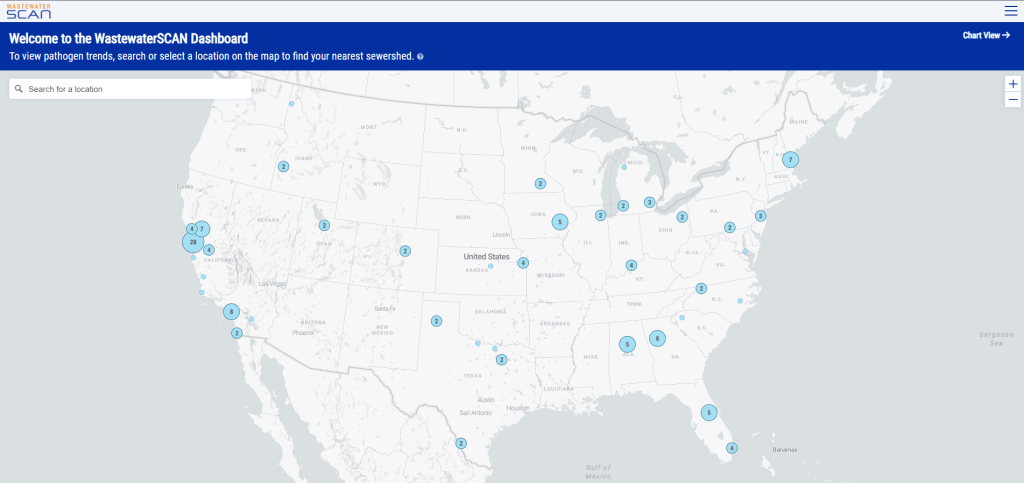
I also recently learned that WastewaterSCAN has released a new, upgraded dashboard to share its surveillance data. WastewaterSCAN is a project started by researchers at Stanford and Emory universities (with a focus on sites in California) that has since expanded across the country. The new dashboard makes it easier for users to find SCAN testing sites in their areas and answer specific questions with the data.
As official case numbers become less and less reliable, I’m glad to see public agencies and research efforts step up to make wastewater surveillance more accessible. Both the Washington dashboard and new WastewaterSCAN link are now included on my wastewater data resource page.
New York State expands wastewater surveillance program: This week, the New York State health department announced a major investment in the state’s wastewater surveillance program: the program has received a $6.6 million grant from the CDC and $15 million from the governor (over the next three years). With this investment, New York’s wastewater surveillance network will grow from 125 to 215 testing sites and will expand from COVID-19 to include flu, RSV, hepatitis, norovirus, and antimicrobial resistance. This is great news for New York—I hope to see other states make similar investments.
Bivalent boosters vs. XBB lineages: The bivalent, Omicron-specific booster shots provide some protection against XBB.1.5 and related Omicron subvariants, according to a new study published this week in the CDC’s Morbidity and Mortality Weekly Report. CDC researchers used data from COVID-19 testing at pharmacies to compare results among people who had received the new booster and those who hadn’t. Booster recipients were significantly less likely to have a symptomatic XBB/XBB.1.5 infection compared to people who hadn’t received the shot, the researchers found (with a vaccine effectiveness value of 48%). While the boosters work less well against XBB.1.5 than they did against BA.4/BA.5, they’re still a valuable protective measure.
CDC overhauling data communications: The CDC is creating new internal offices that will change how it processes, publishes, and communicates about data, according to POLITICO. The new offices include an Office of Health Equity and an Office of Public Health Data, Surveillance, and Technology—both of which have new acting directors as of this week. It’s currently unclear what the new offices will do, exactly, or how they will improve upon a fractured nationwide health data system (with decisions about how to store and share key data largely left up to state agencies and private companies). Still, it’s good to see movement on the CDC’s efforts.
WHO deliberates ending the global health emergency: On Friday, a World Health Organization committee met to discuss whether the official global health emergency over COVID-19 should be ended. The committee’s decision will be made public tomorrow, as a recommendation to WHO Director-General Tedros Adhanom Ghebreyesus; Tedros will ultimately decide whether or not to end the emergency. Global health experts who spoke to STAT reporter Helen Branswell suggested that the WHO likely isn’t ready to end this emergency yet, but it may happen later in 2023.
KFF compiles Long COVID data: A new report from the Kaiser Family Foundation compiles and provides context for Long COVID data reported by the Census and CDC’s Household Pulse Survey. The share of people who reported ever having Long COVID symptoms following a COVID-19 case has declined slightly over time, the KFF report finds; this number went from 35% in June 2022 to 28% in January 2023. However, the number is still high and Long COVID can be debilitating for many, as 79% of people with Long COVID report limitations to their day-to-day activities.
Health of Congressional Districts: Finally: a new dashboard, published this week by researchers at NYU Langone Health, provides detailed health metrics for all 435 Congressional districts in the U.S. (plus Washington, D.C.). The dashboard is a helpful source for researchers and policymakers looking to understand health patterns in specific districts. One of its key metrics is a “COVID Local Risk Index” that reflects the risk residents face for severe health, social, and economic outcomes of COVID-19.
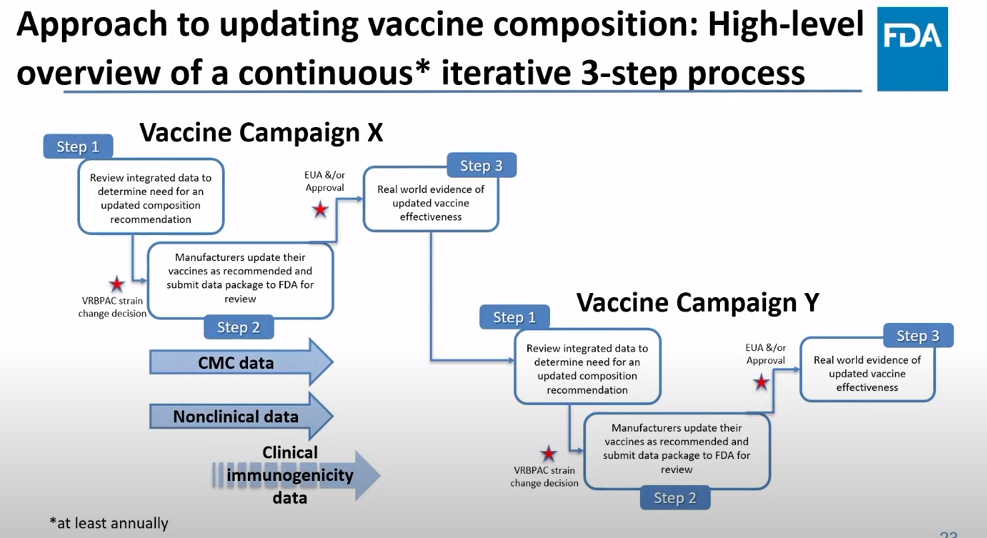
The FDA recommends that the U.S. shifts to annual COVID-19 vaccines, with a variety of data sources feeding into decision-making. Screenshot from the VRBPAC meeting on January 26, 2023.
On Thursday, the FDA’s Vaccines and Related Biological Products Advisory Committee (or VRBPAC) met to discuss the future of COVID-19 vaccines. While the committee readily agreed that our current, Omicron-specific shots are working well and should be used more broadly, it had a hard time answering other questions about future vaccine regimens—largely due to a lack of good data.
Now, the lack of good U.S. data on vaccine effectiveness is not a new problem. I personally have been writing about thissince fall 2021, to the point that I feel like a broken record for bringing it up again. To summarize: the U.S. has a fractured health system in which every state tracks vaccinations differently, with a lot of local public health departments and private companies in the mix, too. As a result, it’s challenging for researchers to determine exactly who is getting COVID-19 after vaccination and how the virus is impacting them.
This lack of detailed vaccine effectiveness data was a problem in fall 2021, when federal officials decided on an initial round of booster shots. And it’s still a problem in winter 2023, as the same officials attempt to plot out a future in which COVID-19 is another disease that we deal with on an annual basis.
But this week’s VRBPAC meeting revealed some other areas of data that are also lacking as we try to answer questions about future vaccines. Here’s my summary of five primary data gaps that came up at the meeting, and some suggestions for potential solutions.
Detailed vaccine effectiveness data
The biggest data gap, of course, is our lack of answers to the question: Who is getting sick with COVID-19 after vaccination? And related questions: How sick did they get? Which variants did they get sick with? What preexisting conditions or comorbidities did they have?
Our lack of standardized medical data in the U.S. makes it tough to answer these questions at the population level. Analyzing variants is particularly tricky, given that variant surveillance in the U.S. tends to be entirely anonymized—with no connections between the genomic sequencing of random PCR tests and the health outcomes (or vaccination statuses) of those patients. And analyzing preexisting conditions can be crucial as officials try to decide which groups of people need extra boosters, but these conditions often are not collected in standard databases or linked to COVID-19 records.
As a result, U.S. officials tend to rely on other countries with more comprehensive, standardized data systems for information on how well the vaccines work. We also have to rely on the pharmaceutical companies producing these vaccines, which often don’t openly share their data—they tend to present clinical trial results in press releases, over peer-reviewed studies. Companies also tend to do trials that align better with their own financial interests, rather than looking at the full scope of vaccine effectiveness.
Even in this week’s VRBPAC meeting, scientists from Moderna presented results from a clinical trial—conducted in the U.K.—that tested the company’s bivalent boosters against the original (non-Omicron) boosters.
Better tracking of variants
The primary reason why our COVID-19 vaccines require updates in the first place is the coronavirus’ continued evolution. Every new lineage of Omicron that rises to prevalence is either a bit better at spreading quickly, a bit better at evading immunity from prior infection or vaccination, or both. To successfully tweak our vaccines in the future, scientists will need to know which variants are out there and how dangerous they are.
Right now, variant tracking largely relies on PCR testing, as researchers randomly select some swab samples to sequence. But with fewer and fewer people getting PCR tests, the sample pool is dwindling. As a result, to stay ahead of new variants, the U.S. needs to diversify its surveillance options. That will likely include more variant sequencing from wastewater (as a population-level COVID-19 sample), more sequencing at hospitals and healthcare centers, and more travel surveillance focused on international variant patterns.
Variant surveillance will also need to inform how suited U.S.-developed COVID-19 vaccines are for the rest of the world. Right now, the pharmaceutical companies that have produced the most effective vaccines (i.e. Pfizer and Moderna) are American—so American regulators are essentially dictating vaccine policy for the world, even though their priority is the U.S. FDA official Jerry Weir said as much at the meeting. U.S. hegemony over COVID-19 vaccines will continue to be a complex, fraught topic going forward.
Tracking different types of immunity
At the VRBPAC meeting, Moderna, Pfizer, and Novavax all presented data on how well their vaccines work against currently-dominant coronavirus variants. While they included some clinical data (case rates, hospitalization rates), the presentations mostly focused on one metric: antibody titers. To calculate if a vaccine works against a certain variant, the easiest strategy is measuring the antibodies produced after a vaccinated blood sample is exposed to that variant.
While this is the easiest strategy, it’s far from the only way to examine how well a vaccine works. Members of the VRBPAC committee frequently asked the pharmaceutical companies for those other metrics: T cells, B cells, and more ways of measuring the immune system’s response to COVID-19. But the companies had little response to these questions. Even FDA and NIH officials at the meeting admitted that they still didn’t have a good understanding of how, exactly, our current vaccines impact our immune systems, beyond generating antibodies.
To better evaluate future vaccines, scientists will need to get better at measuring other aspects of our immune responses. That includes future mRNA vaccines as well as next-generation vaccines in the works right now, such as nasal vaccines (recently authorized in China and India) and vaccines designed to protect against all variants (currently in development at Duke University and other institutions).
I also think it’s worth noting that, as Katelyn Jetelina writes in her coverage of the VRBPAC meeting at Your Local Epidemiologist, the FDA could require pharmaceutical companies to study the immune system more holistically when they submit further vaccine updates for authorization. “The FDA could require sponsors to do detailed investigations, e.g. assessing lymph nodes, bone marrow, and breakthroughs,” she writes. “This would help us understand immunity better, so we can make better recommendations. It’s not clear why they aren’t pushing for this.”
Improving vaccine safety tracking
Two years after the first COVID-19 vaccines were authorized, we now know that the vaccines are overwhelmingly safe and effective. Most people have mild side effects following their shots, like sore arms and fatigue, but the benefits of getting vaccinated far outweigh the risks. However, some discussion at the VRBPAC meeting indicated that federal agencies could do a better job of tracking rare (yet important) serious side effects.
For example, a safety presentation from the Kaiser Permanente Vaccine Study Center suggested that there might be a small increase in stroke risk for older adults who get vaccinated. The risk has only appeared in one vaccine safety database so far and appears to be minimal, per the FDA, but it’s still worth closer examination.
In addition, as Helen Branswell and Matthew Herper discuss in the STAT News liveblog, the VRBPAC meeting didn’t present much new data about vaccine safety risks for children, such as myocarditis among boys and young men. Plus, we have limited data so far on whether vaccination may contribute to autoimmune conditions or Long COVID-like symptoms, a problem that has shown up in some studies and anecdotal reports.
If public health officials are going to continue encouraging Americans to get COVID-19 shots once a year (or more), they will need to thoroughly address concerns about these potential side effects. This is particularly true for young children, a group that’s been vaccinated at fairly low numbers so far.
Navigating COVID-19’s interactions with other vaccines
At the VRBPAC meeting, FDA officials suggested a potential future in which most Americans get one COVID-19 vaccine per year, on a similar timeline to the annual flu shot. Variant strains might be selected in the spring or summer, with vaccines developed and produced in time for a fall vaccination campaign. Some at-risk groups (older adults, people with compromised immune systems, etc.) might get two doses each year.
To make this possible, the VRBPAC committee members suggested that we’ll need to track how COVID-19 vaccines intersect with other vaccines. For example, if an older adult receives their flu shot and COVID-19 shot in the same doctor’s visit, does that dampen how well one or the other vaccine works? Does it increase the risks of severe side effects? We don’t know, at this point.
Another major area of future study will be how COVID-19 vaccines may fit into regular, childhood immunization schedules for young kids. Similarly to the COVID-19 plus flu question, scientists will need to track any potential interactions between COVID-19 shots and other regular shots—along with answering questions about how many shots are needed, timing between shots, and more.
One day, I’m sure, we will have a regular COVID-19 vaccination schedule in the U.S. that runs parallel to our flu vaccination schedule. But it will take time, discussions, and a lot more data to get there.
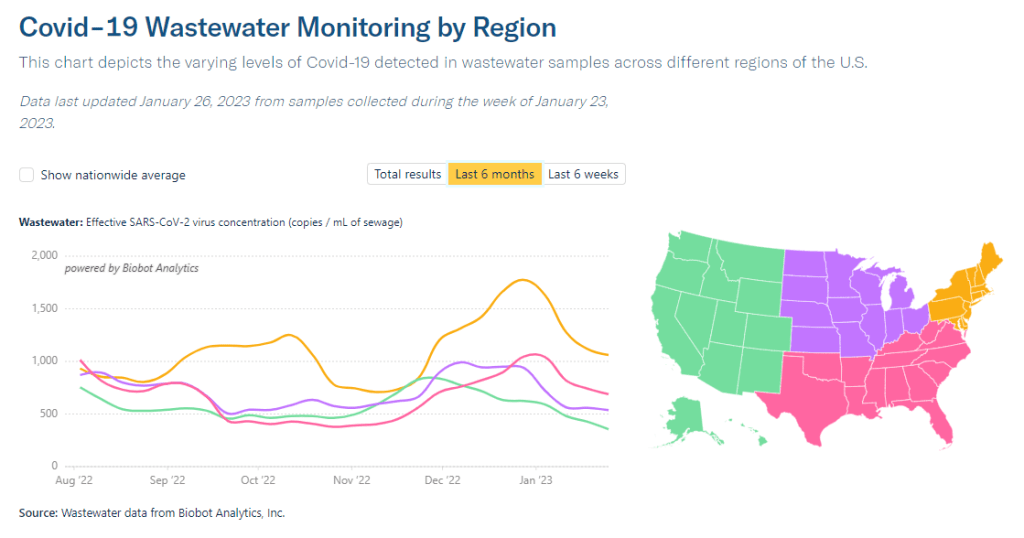
Biobot’s regional data suggest that most of the country is seeing declining COVID-19 spread, but we’re heading into high plateaus.
In the past week (January 19 through 25), the U.S. officially reported about 300,000 new COVID-19 cases, according to the CDC. This amounts to:
An average of 42,000 new cases each day
90 total new cases for every 100,000 Americans
11% fewer new cases than last week (January 12-18)
In the past week, the U.S. also reported about 30,000 new COVID-19 patients admitted to hospitals. This amounts to:
An average of 4,200 new admissions each day
9.0 total admissions for every 100,000 Americans
14% fewer new admissions than last week
Additionally, the U.S. reported:
3,800 new COVID-19 deaths (540 per day)
61% of new cases are caused by Omicron XBB.1.5; 31% by BQ.1 and BQ.1.1; 2% by CH.1.1 (as of January 28)
An average of 100,000 vaccinations per day
At the national level, COVID-19 spread appears to be approaching another plateau. New cases and hospitalizations (as reported by the CDC) are still in decline, but their descent is slowing: reported cases dropped by 11% this week, compared to 24% last week.
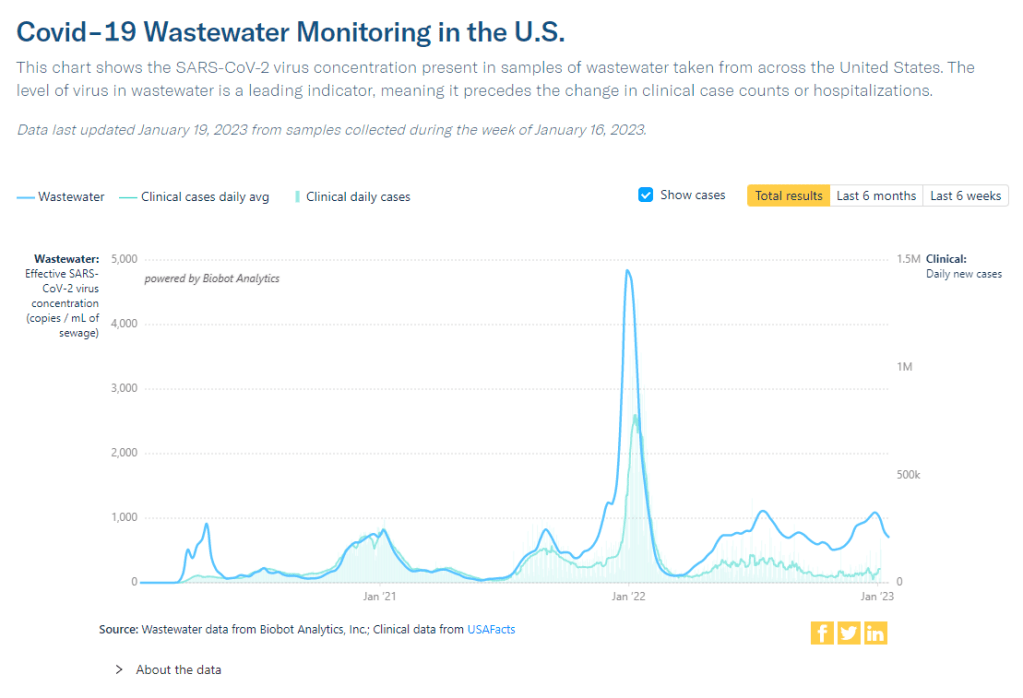
Wastewater surveillance presents the same trends. National data from Biobot suggest that COVID-19 transmission is leveling out in a similar place to where we were in October and November 2022, before the holiday surge drove up spread.
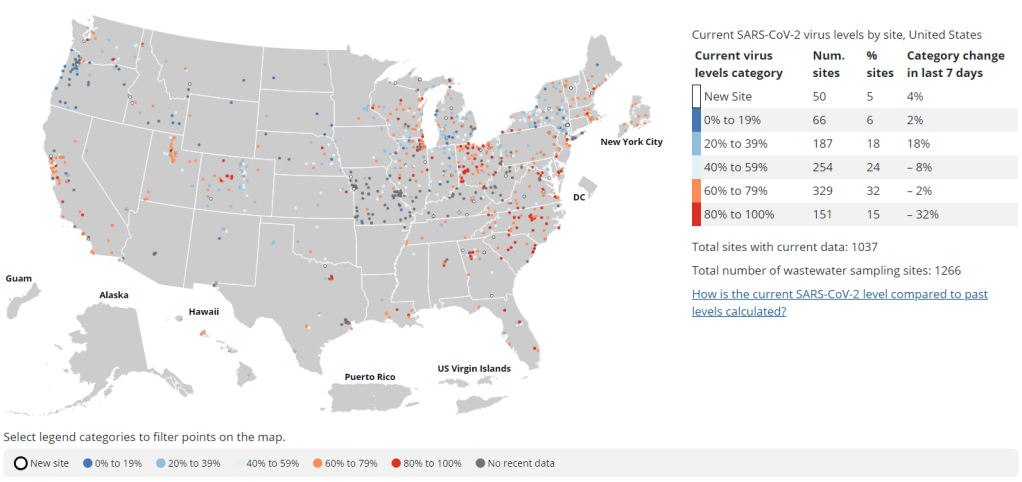
Biobot’s regional data show a slowing decline in the Northeast, plateaus in the Midwest and South, and a somewhat-more-pronounced decline in the West. And wastewater surveillance data from the CDC shows that COVID-19 spread is going up in some places, down in others: out of about 1,000 sites reporting data in the last two weeks, 48% reported decreases in coronavirus levels while 40% reported increases.
Unlike in recent weeks where every state has reported declines in COVID-19 cases and hospitalizations, a few places are now reporting definitive upticks, according to the latest Community Profile Report. These states include Alaska, Vermont, Maine, South Dakota, North Dakota, Nevada, Oklahoma, Minnesota, and Indiana.
Why might some states report COVID-19 upticks just after we emerged from a surge over the holidays? One explanation could be the XBB.1.5 variant, which continues to outcompete other Omicron lineages. XBB.1.5 now comprises about 60% of new cases nationwide (according to the CDC’s estimates); while it is most dominant in the Northeast, it’s growing—and likely reinfecting people—in other regions.
The CDC’s latest variant estimates also now include Omicron CH.1.1, which has been connected to rising cases in the U.K. and New Zealand in recent months. Per the CDC, CH.1.1 has been present in the U.S. at low levels (like, 1% or less) for a few weeks now, without posing a major challenge to XBB.1.5. But it is still a variant worth keeping an eye on.
As flu and RSV cases continue to trend down, the U.S. is confronted with the final weeks of a respiratory disease-heavy winter that was pretty rough on our healthcare system—but fell short of the mind-boggling case numbers that we saw in the prior two winters. Yes, we didn’t see a repeat of “the first Omicron wave”; but still, millions of people got sick, thousands died. Many will likely experience Long COVID as a consequence of their infections this winter.
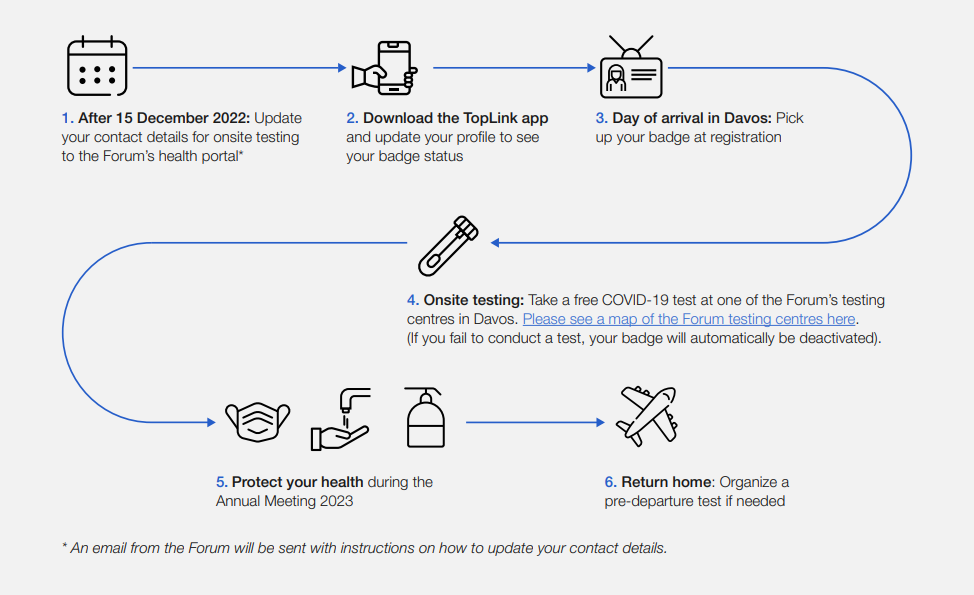
This week, thousands of top political and business leaders gathered in Davos, Switzerland for the World Economic Forum—one of the highest-profile mass events in the world. And the forum, colloquially called Davos after its location, had excellent COVID-19 safety protocols.
The protocols included: PCR tests required onsite (and event badges linked to negative results), masks recommended and available throughout the meeting venue, state-of-the-art ventilation systems, and far-UVC light. Only the best safety measures for the world’s elite, right? Even as many of those elites claim the pandemic is “over”?
News of the Davos COVID-19 protocols has led to media commentary and a Twitter hashtag, #DavosSafe, as public health experts point out that high-quality testing, ventilation, and other measures should not just be for billionaires.
Organizing tip for COVID activists: Highlighting (a) how elites are protecting themselves but not others (#DavosSafe) & (b) higher risk people are being harmed & locked out of society by status quo policies, are the most effective talking points for achieving policy change.
Rather than get angry about the inequities here, I’d like to use Davos as a reminder that many disease mitigation strategies don’t have to be expensive or restricted. Individuals can wear masks, build Corsi-Rosenthal boxes, test before gatherings, and take other relatively cheap measures to cut down on disease spread.
We deserve better. We deserve to be #DavosSafe as the hashtag going around on twitter puts it. Your children deserve to be treated with the care that world leaders are treating each other. Your family deserves to be protected from the disease which is still- unlike the flu- the third leading cause of death in the US. We don’t deserve to be shoved back into poorly ventilated workplaces while our politicians and press assure us that only crazy people would demand to breathe clean air.
New CDC dashboards track respiratory illness hospitalizations: This week, the CDC released two new dashboards that combine COVID-19 data with data on other respiratory illnesses. First, the RESP-NET dashboard summarizes information from population-based hospital surveillance systems in 13 states for COVID-19, the flu, and RSV; it includes overall trends and demographic data. Second, the National Emergency Department Visits dashboard provides data on emergency department visits for COVID-19, the flu, RSV, and all three diseases combined; this dashboard includes data from all 50 states, though not all hospitals are covered.
Early results from NIH at-home test self-reporting: Last week, ABC News shared early results from MakeMyTestCount.org, an online tool run by the National Institutes of Health allowing Americans to self-report their rapid, at-home test results. Between the site’s launch in late November and early January, “24,000 people have reported a test result to the site,” according to ABC. (While the article says “people have reported,” I think this number actually represents the number of test results reported, given that the website doesn’t track when one person submits multiple test results over time.) The majority of results reported are positive and women are more likely to self-report than men, per ABC. It’s unclear how useful these early data may be for any analysis, but I’m glad to see some numbers becoming public.
New preprint updates county-level excess death estimates: A new preprint from Boston University demographer Andrew Stokes and colleagues, posted this week on medRxiv, shares updated estimates on excess deaths and COVID-19 deaths by U.S. county. According to the analysis, about 270,000 excess deaths were not officially attributed to COVID-19 during the first two years of the pandemic, representing 24% of all excess deaths during that time. And the analysis reveals regional patterns: for example, in the South and in rural patterns, excess deaths were less likely to be officially attributed to COVID-19. For more context on these data, see MuckRock’s Uncounted project (which is a collaboration with Stokes and his team).
Factors contributing to low bivalent booster uptake: Another notable paper from this week: results from a survey of Americans who were previously vaccinated about their reasons for receiving (or not receiving) a bivalent, Omicron-specific booster this fall, conducted by researchers at Duke University, Georgia Institute of Technology, and others. Among about 700 people who didn’t get the booster, their most common reasons were a lack of awareness that the respondent was eligible for this vaccine, a lack of awareness that the bivalent vaccine was widely available, and a perception that the respondent already had sufficient protection against COVID-19. This survey shows how governments at every level have failed to advertise the bivalent boosters, likely to dire results.
More wastewater surveillance on airplanes: And one more notable paper: researchers at Bangor University tested wastewater from three international major airports in the U.K., including samples from airplanes and airport terminals. About 93% of the samples from airplanes were positive for SARS-CoV-2, while among the airport terminal samples, 100% at two airports were positive and 85% at the third airport were positive. Similar to the study from Malaysia I shared last week, this paper suggests that there’s a lot of COVID-19 going around on air travel—to put it mildly. The paper also adds more evidence that airplane/airport wastewater can be a useful source for future COVID-19 surveillance.
Nursing home infections ran rampant early in the pandemic: A new report from the Health and Human Services Office of Inspector General examines how much COVID-19 spread through nursing homes in 2020. The report’s authors used Medicare data from about 15,000 nursing homes nationwide, identifying those with “extremely high infection rates” in spring and fall 2020. In more than 1,300 of these facilities, 75% or more of the Medicare patients had COVID-19 during these surges; the same facilities had way-above-average mortality rates. “These findings make clear that nursing homes in this country were not prepared for the sweeping health emergency that COVID-19 created,” the authors write in the report’s summary.
The Open Notebook has launched a new community program, called the Covering Science Slack, which could be a great opportunity for some journalist readers of the COVID-19 Data Dispatch. In this Slack server, general assignment and local journalists who are interested in improving their science reporting skills engage in discussions with experienced science journalists, who serve as mentors.
After a 12-week pilot program in 2022, the Covering Science Slack is now expanding: applications are open for a new cohort to join the Slack community. This iteration of the program has funding for regular discussions and activities through at least September 2023, and it’s free for participants.
Here’s how TON describes the program in their call for applications:
This community includes local and general-assignment reporters and editors, as well as a smaller number of experienced science journalists who serve as mentors within the group. Members are invited to seek (and offer) advice on any topic related to covering science, such as how to exchange ideas on topics such as finding suitable expert sources, refining story angles, evaluating scientific studies and claims, making sense of new findings and their implications, and more. Members can also participate in various types of learning opportunities and activities, including one-on-one peer mentoring, guided Slack discussions, reading groups, webinars centered on core challenges of covering science, and informal virtual gatherings.
With support from the Burroughs Wellcome Fund, we are now accepting applications for new members. The program will run at least through September, 2023, and we hope to establish the program as a sustainable, continuously running community.
I know a lot of COVID-19 Data Dispatch readers are local or general-assignment journalists; if you fit into this category, please consider applying to join the Slack server! It’s a great opportunity to learn more about science reporting in an informal setting, with a relatively low time commitment. Also, I’m now one of the mentors in the server, if that’s a draw for anyone.
Transparency note: This is not a paid advertisement or anything in that capacity, though I have written for The Open Notebook in the past (including a collaborative project between TON and the CDD). I’m just sharing this because I think it’s a valuable opportunity and would love for readers to take advantage of it.
Nearly a year after the CDC’s National Wastewater Surveillance System began reporting public data, the system still has very unequal representation across the U.S.
This week, the National Academies of Sciences, Engineering, and Medicine (NASEM) released a major report about the state of wastewater surveillance for infectious diseases in the U.S. The report, written by a committee of top experts (and peer-reviewed before its release), is an extensive description of the promise and the challenges of wastewater testing.
Its authors describe how a grassroots network of researchers, public officials, and wastewater treatment plant staff developed strategies for sewage testing, analysis, and communicating results. Now, as committee chair Guy Hughes Palmer writes in the report’s introduction, broader collaboration and resources are needed to “solidify this emergency response to the COVID-19 pandemic into a national system” that continues to monitor COVID-19 as well as other public health threats. To this end, the report includes specific recommendations for the CDC’s National Wastewater Surveillance System.
Here are some key findings from the report, taken from its summary section and a NASEM webinar presentation last Thursday:
Overall, the report finds that wastewater surveillance data “are useful for informing public health action and that wastewater surveillance is worthy of further development and continued investment.” The authors recommend that public agencies at all levels keep funding and promoting this monitoring tool.
Wastewater surveillance is not a new technology; it’s been used for decades to monitor the spread of polio. But COVID-19 led to widespread adoption of this technology and innovation into how it could be used, driven by some municipalities and universities that were early to embrace wastewater.
As a population-level tool, wastewater surveillance provides data on how diseases spread through a community without relying on access to clinical testing. This surveillance is becoming more important for COVID-19 as people opt for at-home tests over PCR tests, and should be used specifically to track new variants.
Community sewersheds that may be tested range in size from serving hundreds of people to serving millions; they also differ based on geography, demographics, and many other factors. As a result, early researchers in this space developed testing and analysis methods that were specific to their communities.
Now, however, the CDC faces a challenge: “to unify sampling design, analytical methods, and data interpretation to create a truly representative national system while maintaining continued innovation.” In other words, standardize the system while allowing local communities to keep doing what works best for them.
Sites in the CDC’s National Wastewater Surveillance System (NWSS) are currently not representative of the U.S. as a whole, as the system is based on wastewater utilities and public health agencies choosing to participate.
The CDC needs to expand this system to be more equitable across the country, with targeted outreach, offering resources to sites not currently participating, and other similar tactics. This expansion process should be open and transparent, the report’s authors write.
As NWSS expands, the CDC should select and prioritize “sentinel sites” that can help detect new coronavirus variants and other new emerging health threats early on. These sites might include international airports as well as zoos and livestock farms, where potential animal-to-human transmission may be monitored.
Better public communication is needed: the CDC (and other agencies) should improve its public outreach about wastewater data, including addressing any privacy concerns that people may have. The report specifically recommends that the CDC “convene an ethics advisory committee” to assist with privacy concerns and data-sharing concerns.
In assessing potential new targets for wastewater surveillance, the report recommends three criteria: “(1) public health significance of the threat, (2) analytical feasibility for wastewater surveillance, and (3) usefulness of community-level wastewater surveillance data to inform public health action.”
NWSS needs more funding from the federal government to expand its sites, continue its COVID-19 tracking efforts, fund projects at state and local levels, and pivot to new public health threats as needed. This funding needs to be “predictable and sustained,” the report’s authors write.
In the past week (January 12 through 18), the U.S. officially reported about 330,000 new COVID-19 cases, according to the CDC. This amounts to:
An average of 47,000 new cases each day
101 total new cases for every 100,000 Americans
24% fewer new cases than last week (January 5-11)
In the past week, the U.S. also reported about 35,000 new COVID-19 patients admitted to hospitals. This amounts to:
An average of 5,000 new admissions each day
10.7 total admissions for every 100,000 Americans
16% fewer new admissions than last week
Additionally, the U.S. reported:
4,000 new COVID-19 deaths (560 per day)
49% of new cases are caused by Omicron XBB.1.5; 40% by BQ.1 and BQ.1.1 (as of January 21)
An average of 150,000 vaccinations per day (CDC link)
National COVID-19 metrics continue to suggest that the U.S. is coming out of its holiday surge, though some parts of the country may face increased transmission as the Omicron variant XBB.1.5 spreads.
Official COVID-19 case numbers and new hospital admissions both reported declines this week, according to the CDC (of 24% and 16% respectively, compared to the prior week). Biobot’s wastewater surveillance data also show a decline, with coronavirus concentration at a similar level to mid-November 2022, just before Thanksgiving.
This trend is fairly consistent across states and regions, according to case and hospitalization data from the latest HHS Community Profile Report. However, Biobot’s regional and county-level data suggest that COVID-19 spread is in a plateau or even starting to increase in some parts of the South and Midwest regions.
Hospitalizations for the flu and RSV are following a similar pattern to COVID-19, according to a new CDC dashboard that reports on all three illnesses together. Almost all states reported moderate or low levels of influenza-like activity in the week ending January 14, very different from the patterns we were seeing a few weeks ago. The only areas still reporting high influenza-like activity are California, North Dakota, New Mexico, Texas, Puerto Rico, New York City, and Washington D.C.
All of this is good news, suggesting that the worst of this winter’s respiratory virus surges may be behind us. But COVID-19 is still spreading across the country at fairly high levels, reflecting the high baseline that the U.S. has faced ever since new Omicron subvariants started to hit in spring 2022.
We also need to continue watching XBB.1.5, the latest and most contagious version of Omicron. This subvariant caused about half of new cases in the U.S. in the last week, according to CDC estimates. It’s most prevalent in the Northeast but is quickly gaining ground in the Southeast and other regions. (And the BQ lineages that currently dominate these regions can spread quickly, too.)
In the coming weeks, we’ll see how much XBB.1.5 (and any other variants) contribute to increased transmission in these regions. Meanwhile, COVID-19 deaths went up recently as the holiday surge took its toll: more than 500 people have died from COVID-19 every day in the last two weeks. Deaths are always the most delayed—and the most tragic—metric.
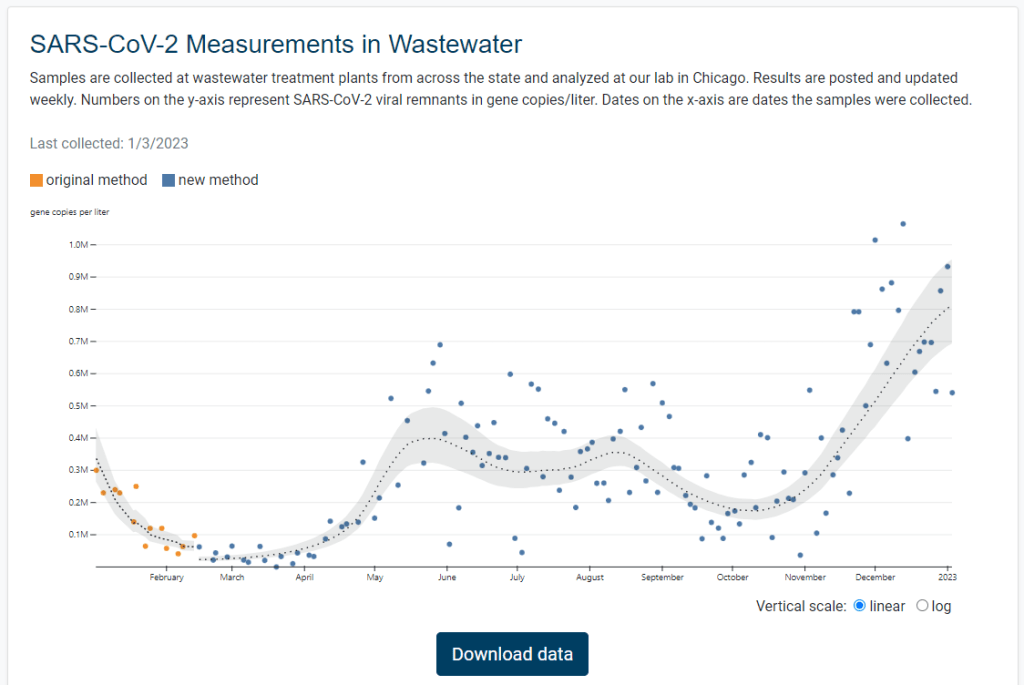
Illinois is the latest state to get its own dashboard for COVID-19 wastewater surveillance, with a new website that launched earlier this week. It includes data for 75 sites across the state.
The new dashboard—like the state’s wastewater surveillance program itself—is a collaboration between the Illinois Department of Public Health and the Discovery Partners Institute, a research center at the University of Illinois. Illinois’ agency received more than $6.5 million in federal grants to fund wastewater testing, according to local TV station WTTW.
I poked around a bit on the new dashboard, and I’m a fan: it includes a map of sampling locations, charts showing COVID-19 trends over time, easily-downloadable data, and ample information on how to interpret results. Nice work, Illinois!