Author: Betsy Ladyzhets

  • COVID source shout-out: Body Politic

    Body Politic, a health justice organization that has led Long COVID organizing over the last three years, shut down its Slack support group this week. The group has been a valuable place for long-haulers to connect and find resources; it’s also helped launch other important projects, such as the Patient-Led Research Collaborative and the Long COVID Survival Guide.

    The organization isn’t ending its support of long-haulers, though: it’s partnered with New Health, a mobile app developed to continue community Long COVID support. “New Health will be hiring Body Politic moderators and board members as their first paid staff, and members of our community are currently testing their app,” Body Politic leaders wrote in an April blog post describing the transition.

    I’ve written previously about Body Politic’s fundraising efforts as the group sought to transition form a grassroots, all-volunteer organization to a format that was more sustainable, and I’m glad to see that the group’s leaders have found this solution. But it’s a bit sad to see the original Slack group close—the end of an era.

    Thank you to all the volunteers who made the Body Politic group possible, from a journalist who has relied on many of its members and resources in my reporting on Long COVID!

  • Sources and updates, June 4

    • Medicaid coverage losses by state: KFF Health News published a story this week sharing new data on the Americans who lost Medicaid coverage due to the end of a COVID-19 policy that prevented states from kicking people off the insurance during earlier stages of the pandemic. More than 600,000 people in 14 states have lost coverage since April 1, according to reporter Hannah Recht’s analysis. That represents about 36% of the people whose Medicaid eligibility was up for review in these states, though the number is much higher in some states (about 80% in Oklahoma). Recht also published the underlying data from her analysis for other reporters to use.
    • Library of Congress COVID-19 history project: The Library of Congress has announced a new project to collect COVID-19 oral history stories, partnering with the StoryCorps interview archive. Congress has provided funding for the COVID-19 project, which will provide grants to researchers working to document the experiences of specific groups. This project is focusing on frontline workers and the survivors of people who died from COVID-19, but other Americans are welcome to share their stories through the StoryCorps website.
    • Children often cause household COVID-19 spread: Researchers at Boston Children’s Hospital and Kinsa, a health tech company, used data from smart thermometers to track how the coronavirus spreads inside households. Among about 39,000 instances of household transmission, a child was the initial case 70% of the time. The study suggests that children are major drivers of disease spread, especially during the school year; it also demonstrates the potential utility of smart thermometer data. (For more about Kinsa, see this post from last fall.)
    • Disproportionate COVID-19 impacts within a city: Another study that caught my attention this week: researchers at the University of Texas at Austin and collaborators evaluated how severe COVID-19 impacts differed by ZIP code within the city of Austin. Their analysis found that ZIP codes with more vulnerable populations (based on the CDC’s Social Vulnerability Index) had higher rates of COVID-19 cases, but were less likely to have their cases reported. When limited surveillance data are available, the researchers suggest, health agencies should direct resources to more vulnerable communities.
    • Assessing who’s not connected to public sewers: One commonly-cited limitation of wastewater surveillance data is that about one in five U.S. households aren’t connected to public sewers. A new preprint from scientists at Harvard University and Biobot Analytics looks at this issue in more detail, using publicly available datasets describing sewer connectivity. The researchers found that, overall, some demographic groups (such as Native Americans, wealthier people in rural areas, etc.) are less likely to be connected to public sewers, as are some regions (such as Alaska and Navajo Nation). But public datasets have many gaps and biases, making it challenging to thoroughly assess this problem. Lead author QinQin Yu has a Twitter thread with more details.

  • Debt ceiling deal will mean even less COVID-19 funding

    You’ve probably seen the news that last weekend, President Joe Biden and Congressional leaders reached a deal to raise the U.S. government’s debt ceiling. The deal passed both houses and Biden signed it yesterday.

    In order to reach this bipartisan deal, Biden had to make a lot of compromises—including limiting funding for COVID-19 and other public health needs. The deal could make it harder for state and local governments to distribute COVID-19 vaccines, track disease through programs like wastewater surveillance, and prepare for future health threats.

    The federal government is essentially taking back $27 billion of COVID-19 funds that it provided to various federal agencies, according to reporting by Ximena Bustillo and Tamara Keith at NPR. The move focuses on funds for programs that concluded or have “no immediate demands,” per a White House document shared by NPR.

    But programs with “no immediate demands” could easily have demands in the coming months. One of NPR’s examples is funding for the federal Department of Health and Human Services (HHS) to research and distribute vaccines, which can be distributed to other agencies (the CDC, NIH, FDA, state and local health departments, etc.). Vaccine distribution might not be a big need right now, but it likely will be in the fall, when new COVID-19 boosters become available.

    Another potential need could be wastewater surveillance for COVID-19 and other health threats. The CDC’s National Wastewater Surveillance System (NWSS) was funded through 2025 by the American Rescue Plan, but it’s possible some of those funds could be in the HHS money pulled back by the debt ceiling deal. This would obviously be a huge loss for the U.S.’s ability to get early warning about future COVID-19 surges, as well as warnings about other pathogens. (Shout-out to Sean Kennedy for pointing this one out.)

    In addition, the debt ceiling deal may lead to a smaller budget for the NIH, as Sarah Owermohle reports in STAT News. This could have implications for the agency’s ability to fund research into many pressing diseases, including Long COVID. The NIH has already wasted a lot of its Long COVID funding so far, according to my reporting, so it would be pretty bad news if more support for this research is not available.

    The White House has claimed that Biden’s deal preserves funds for some key COVID-19 issues, according to NPR, including next-generation vaccines and Long COVID research. It’s hard to verify this, though, because of how convoluted federal COVID-19 funding has been. From a recent brief by the Association of State and Territorial Health Officials:

    “Given the way Congress appropriated COVID-19 funding, and the way funding was later transferred between federal accounts and agencies, it is extremely difficult to discern which federal public health programs are affected by the rescissions.”

    Public health funding often follows a cycle of “panic and neglect.” When a crisis occurs, governments panic and put tons of money into the immediate response. But after that crisis fades, it falls into neglect, with less money devoted to preparedness—even though preparedness efforts could help avert the next crisis. We’re clearly in that neglect part of the cycle for COVID-19 now; the debt ceiling deal is just the latest example.

    More federal data

  • Ask your COVID-19 questions at the CDD community event next Sunday

    It’s a confusing, stressful time for those of us still following COVID-19 news and trying to avoid infection. Services like testing have become more limited, thanks to the end of the federal public health emergency, while changes in data availability make it harder to even recognize the ongoing risk.

    I’d like to give you—readers of the COVID-19 Data Dispatch—an opportunity to share your concerns about this latest stage of the pandemic and connect with others who feel similarly. So, I’m hosting a community event: a live Q&A in a private Slack server.

    Here’s how this will work. Next Sunday, June 11, at 5 PM Eastern time, I will log onto the private COVID-19 Data Dispatch Slack server. I’ll start a live audio chat in a channel labeled “community_events”, using Slack’s huddle feature.

    Attendees will be able to ask questions through audio or through text, in the Slack channel, and I’ll try to answer them in both formats. I also hope that attendees will respond to each other’s questions and connect about shared challenges. Remaining COVID-19 cautious these days can be an isolating experience, and I hope this event will help folks find a bit of community.

    I’ve tried using Slack for the COVID-19 Data Dispatch before; I actually created my server in early 2021, when I launched the publication’s independent website and financial support options. At the time, readers weren’t particularly interested in community discussions. But I suspect that may be different now, with the current phase of the pandemic—so I’m testing this out again. If the event next weekend goes well, I might make it a regular occurrence.

    In order to keep the community event to a manageable size, I’m going to limit it to readers who have financially supported the COVID-19 Data Dispatch. If you’ve donated at any point in the last three years, please expect a Slack invitation in your email later this afternoon.

    If you haven’t donated before but would like to attend the event, please do so before next Sunday. It can be any amount, and can be a one-time donation through my Ko-fi page or a reoccurring contribution through the website. I’ll also reserve a few spots for folks who would like to attend but are unable to donate right now—just email me to ask about that.

    You can also email me with any logistical questions! I’m looking forward to the event and hope to hear from many of you there.

  • National numbers, June 4

    National numbers, June 4

    Both hospital admissions and test positivity for COVID-19 have ticked down in recent weeks. Chart via the CDC.

    In the past week (May 21 through 27), the U.S. reported about 7,600 new COVID-19 patients admitted to hospitals, according to the CDC. This amounts to:

    • An average of 1,100 new admissions each day
    • 2.3 total admissions for every 100,000 Americans
    • 8% fewer new admissions than last week (May 14-20)

    Additionally, the U.S. reported:

    • 4.4% of tests in the CDC’s surveillance network came back positive (a 0% change from last week)
    • A 17% lower concentration of SARS-CoV-2 in wastewater than last week (as of May 31, per Biobot’s dashboard)
    • 54% of new cases are caused by Omicron XBB.1.5; 19% by XBB.1.16; 18% by XBB.1.9 (as of May 27)

    The COVID-19 plateau of the last few weeks continues at the national level, though experts are concerned that a summer surge could occur in parts of the country. Wastewater surveillance and testing data are indicating potential increases in the New York City region.

    Hospital admissions for COVID-19 remain at the levels we’ve seen throughout the spring, with about 1,100 people admitted nationwide each day last week. These numbers are similar to the hospitalizations reported at previous low points for COVID-19, in spring 2022 and 2021.

    Testing data from the CDC’s National Respiratory and Enteric Virus Surveillance System (NREVSS) also suggest a plateau: national test positivity didn’t change from last week to this week. While this CDC system includes a small fraction of the PCR labs that reported COVID-19 tests before the federal emergency ended, it’s still a helpful indicator for testing trends.

    Wastewater surveillance data from Biobot shows a similar picture, with coronavirus levels in sewage remaining consistent at the national level for the last two months. All four major regions of the country are trending down, according to Biobot’s analysis.

    But national data can hide more concerning trends at the local level. Wastewater data from New York City’s fourteen water treatment plants suggest potential increases in COVID-19 spread in the city and outlying suburbs over the last couple of weeks. The city’s wastewater data are reported with a delay (as of today, the most recent update was May 21), so I find it worrying that an increase may have predated the Memorial Day holiday. Test positivity data for the New York/New Jersey region suggest an uptick as well.

    NYC has been a bellwether for the rest of the U.S. at many points during the pandemic, and it’s possible that the city could see a surge before other regions again this summer. Health experts are also closely watching the South, where people gather indoors more in the summer.

    About 96% of Americans over age 16 have some COVID-19 protection from vaccination, past infections, or both, according to a recent CDC study. This protection will help many people avoid severe COVID-19 symptoms this summer even if they get infected. But Long COVID continues to be a risk—potentially even escalating with more infections.

  • Sources and updates, May 28

    • New Long COVID papers from the Patient-Led Research Collaborative: Speaking of new Long COVID research: the Patient-Led Research Collaborative, a group of long-haulers who do and support research on their condition, has recently published two new papers. The first, published in Nature and based on a patient survey, discusses Long COVID’s intersection with common psychiatric conditions such as depression and anxiety. The second, published in Fronteirs in Rehabilitation Science, is a review paper going over the reproductive health impacts of Long COVID. Long COVID frequently causes disruptions to the menstrual cycle, gonad function, fertility, and other areas of reproductive health, yet these symptoms are understudied.
    • FDA fully approves Paxlovid: The FDA has provided full approval to Pfizer for its antiviral COVID-19 pill, Paxlovid. Millions of Americans have received Paxlovid since it earned Emergency Use Authorization in late 2021, and many studies have shown that it’s effective in reducing the risk of severe COVID-19 symptoms. With the federal public health emergency’s end, the FDA has encouraged pharmaceutical companies to apply for full approval for their COVID-19 products so that they can permanently remain on the market; Paxlovid is a high-profile example of that trend.
    • Bivalent COVID-19 vaccines protect, but wane: The CDC published another study this week evaluating the bivalent (or Omicron-specific) COVID-19 booster shots. These vaccines clearly provide additional protection against severe COVID-19 symptoms, the study finds, but this immune system boost goes away after several months. In the study, vaccine effectiveness against hospitalization declined from 62% in early weeks post-vaccination, to 24% at three to six months post-vaccination. The study shows that additional boosters and/or newer vaccines are needed for vulnerable adults.
    • Value of regular testing for controlling outbreaks: Another notable new study: researchers at the University of Wyoming compared how well different mitigation strategies work for preventing the spread of COVID-19 and other diseases, using a model informed by both epidemiological and economic factors. They found that frequent testing—paired with isolation for people who tested positive—was more effective at reducing disease spread than physical distancing measures, like closing businesses or having employees work from home. The paper suggests that testing can help reduce illness while keeping businesses open.
    • Funding for a WHO disease surveillance initiative: The Rockefeller Foundation and World Health Organization recently announced a new partnership, with the foundation providing $5 million to support the WHO’s Hub for Pandemic and Epidemic Intelligence. This Hub was established in 2021, with goals including fostering global collaboration on disease surveillance, providing better (and more complete) data, and improving tools for public health decisions. Rockefeller’s support will help with scaling up genomic surveillance, real-time data collection, and more.

  • Answering reader questions about wastewater data, rapid tests, Paxlovid

    I wanted to highlight a couple of questions (and comments) that I’ve received recently from readers, hoping that they will be useful for others.

    Interpreting wastewater surveillance data

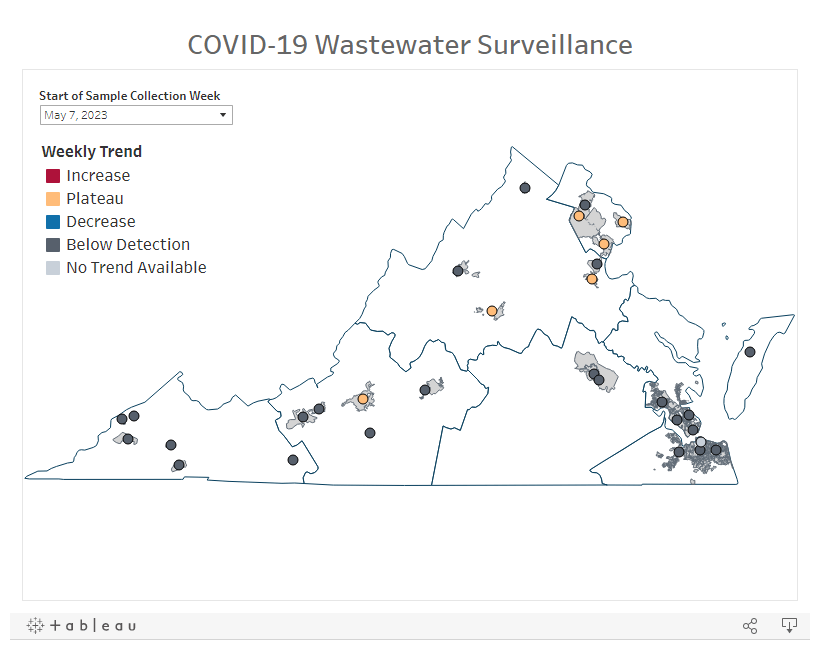
    One reader asked about how to interpret wastewater surveillance data, specifically looking at a California county on the WastewaterSCAN dashboard. She noticed that the dashboard includes both line charts (showing coronavirus trends over time) and heat maps (showing coronavirus levels), and asked: “I’m wondering what the difference is, and which is most relevant to following actual infection rates and trends?”

    My response: Wastewater data can be messy because environmental factors can interfere with the results, and what may appear to be a trend may quickly change or reverse course (this FiveThirtyEight article I wrote last spring on the topic continues to be relevant). So a lot of dashboards use some kind of “risk level” metric in addition to showing linear trends in order to give users something a bit easier to interpret. See the “virus levels” categories on the CDC dashboard, for instance.

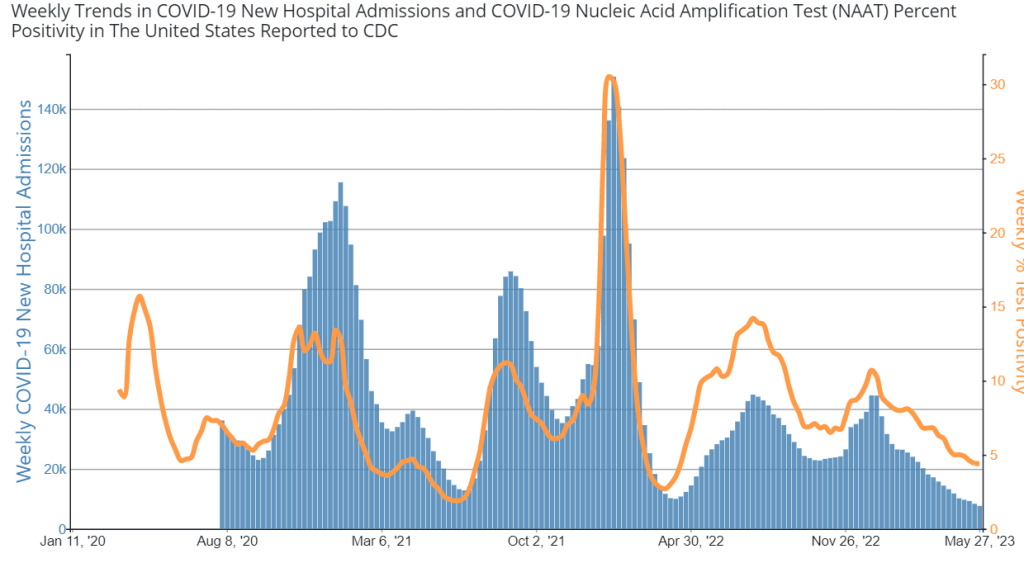
    Personally, I like to look at trends over time to see if there might be an uptick in a particular location that I should worry about, but I find the risk level metrics to be more useful for actually following infection rates. Of course, every dashboard has its own process for calculating these levels—and we don’t yet have a good understanding of how wastewater data actually correlate to true community infections—so it’s helpful to also check out other metrics, like hospitalizations in your county.

    Rapid test accuracy

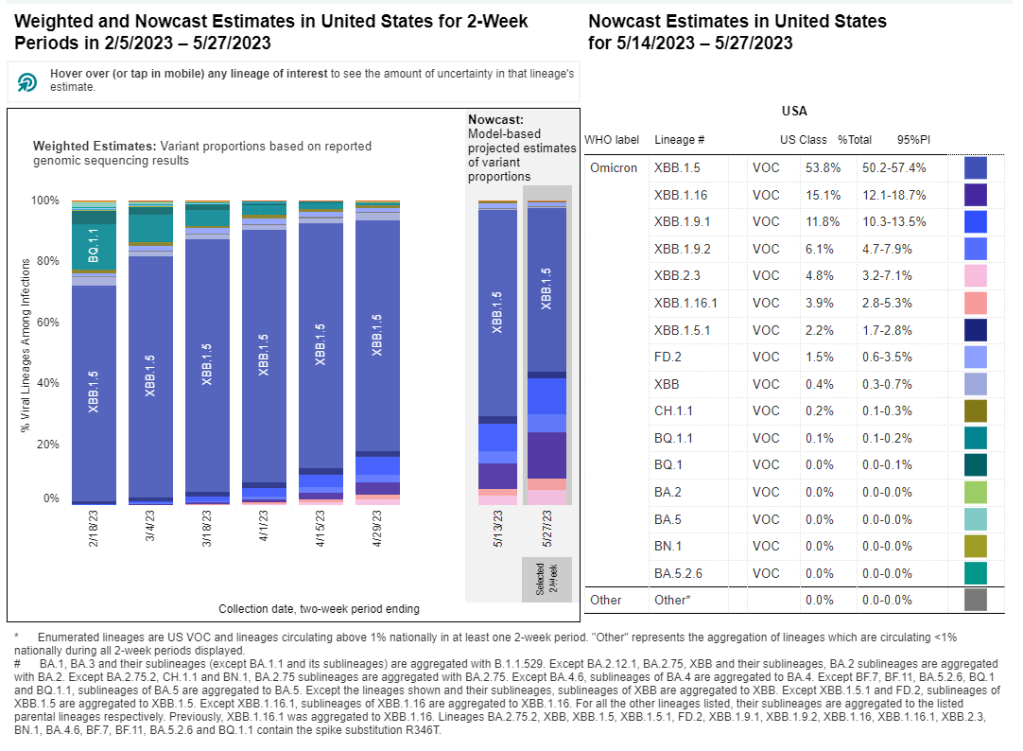
    Another reader asked: “Is there any data on the effectiveness of rapid tests for current variants like Arcturus? I’m hearing more and more that they are working less and less well as COVID evolves.”

    My response: Unfortunately, I’m not aware of any specific data on rapid test effectiveness for recent variants. Early in the Omicron period, there were a few studies that showed the rapid tests still worked for that variant. The virus has obviously evolved a lot since then, but there is less interest in and fewer resources for evaluating these questions at this point in the pandemic, so it’s hard to say whether the continued mutations have had a significant impact on test effectiveness.

    I think it’s important to flag, though, that rapid tests have never been highly accurate. People have tested negative on rapids—only to get a positive PCR the next day—since these tests were first introduced in spring 2021. The tests can be helpful for identifying if someone is contagious, with a high viral load, but are less accurate for people without symptoms. So, my recommendation with these tests is always to test multiple times, and to get a PCR if you have access to that. (Acknowledging there is less and less PCR access these days.) Also, if you were recently exposed to COVID-19, wait a few days to start rapid testing; see more details in this post from last year.

    Double dose of Paxlovid

    Another reader wrote in to share their experience with accessing Paxlovid during a recent COVID-19 case. The reader received a Paxlovid prescription, which led to a serious alleviation of symptoms. But when she experienced a rebound of symptoms after finishing the Paxlovid course, she had a hard time getting a second prescription.

    “Fauci, Biden, head of Pfizer and CDC director got a second course of Paxlovid prescribed to them,” the reader wrote. “When I attempted to get this, my doctors pretended I was crazy and said this was never done.” She added that she’d like to publicize the two-course Paxlovid option.

    My response: I appreciate this reader sharing her experience, and I hope others can consider getting multiple Paxlovid prescriptions for a COVID-19 case. The FDA just provided full approval to Pfizer for the drug, which should alleviate some bureaucratic hurdles to access. I also know that current clinical trials testing Paxlovid as a potential Long COVID treatment are using a longer course; 15 days rather than five days. The results of those trials may provide some evidence to support a longer course overall.

    If you have a COVID-19 question, please send me an email and I’ll respond in a future issue!

  • What the new RECOVER study does—and doesn’t—tell us about Long COVID

    What the new RECOVER study does—and doesn’t—tell us about Long COVID

    The new RECOVER paper identifies 12 major Long COVID symptoms, but this is far from an exhaustive list defining the condition.

    RECOVER, the U.S.’s largest initiative to understand Long COVID, published a major scientific study this week in JAMA. The paper goes over key Long COVID symptoms and other findings from nearly 10,000 adults who have joined the project’s research cohort. Its authors propose a new, more specific definition for Long COVID, which will be used in future studies from this project.

    This is a big milestone for RECOVER; it’s the first paper to actually share data from the study’s patient cohort, rather than from electronic health records. While the paper doesn’t provide any truly novel, previously unreported information about Long COVID, it confirms findings from smaller studies and validates patient experiences. It’ll certainly be valuable for thousands of scientists around the country struggling to understand this debilitating condition, though patients have expressed some concerns about the paper’s central framework.

    This study is also a rather late milestone, considering that the National Institutes of Health received $1 billion in funding from Congress for this initiative in December 2020 (two and a half years ago), and started enrolling patients in fall 2021. For more details on RECOVER’s delays—and many criticisms it’s faced from patients and experts—please check out this investigation by me and Rachel Cohrs, at STAT News and MuckRock.

    Here are a few key things you should know about the paper, and that you should watch out for while reading other articles about it:

    • The authors’ main goal was to determine which symptoms can specifically be used to diagnose long-term symptoms following a coronavirus infection. Using survey data from RECOVER’s participants, the researchers developed a framework that sorts patients into three categories: definitely having symptoms due to a past coronavirus infection (or “infected”), not having symptoms due to a past infection (“uninfected”), and possibly having symptoms due to a past infection (“unspecified”). This framework prioritizes symptoms unique to Long COVID, such as the loss of smell or taste, over those symptoms that are actually more debilitating for patients, such as chest pain or chronic fatigue. Also, as patient-expert Lisa McCorkell pointed out on Twitter, the unspecified category includes people with Long COVID.
    • The paper highlights 12 Long COVID-specific symptoms; there are a lot more. I’ve seen some articles covering this study frame it as, “these are the 12 definitive symptoms of Long COVID.” That’s a misrepresentation of the results. In fact, the authors selected 12 common symptoms that are helpful for their framework (i.e. determining who had a coronavirus infection); we know from other research that Long COVID can include up to 200 different symptoms. RECOVER leader Leora Horwitz even acknowledged in a Twitter thread describing the paper that “these are not the ONLY symptoms that people have, nor are they necessarily the most important to patients, the most common, the most severe or most burdensome.”
    • Long COVID is a spectrum, with different clusters of symptoms. This paper adds more evidence to support a hypothesis I’ve heard from many experts, that Long COVID is not one condition but a variety of overlapping conditions all caused by SARS-CoV-2. Different symptoms might be caused by different biological processes, and different patient groups could require different treatments. RECOVER has identified potential patient groups, which the researchers will study further (including through clinical trials, projected to start this summer).
    • Long COVID has a wide variety of impacts on day-to-day life, but the most severe patients might not have the best proof. Using this paper’s framework, long-haulers can give themselves a “Long COVID score” reflecting how likely they are to have symptoms caused by a past coronavirus infection. But, as patient-expert Chris Maddison explained, a higher score doesn’t necessarily mean Long COVID has more drastically impacted the patient’s day-to-day life. “I would prefer to flip this, i.e., a def. that centers folks who are suffering regardless of whether we can accurately predict prior infection,” he wrote.
    • Infection post-vaccination or with Omicron can lead to lower—but still significant—Long COVID risk, compared to earlier in the pandemic. Since RECOVER started recruiting in fall 2021, the study includes some people who were first infected during the first Omicron wave, then developed Long COVID symptoms afterward. About 10% of the patients infected during Omicron later developed symptoms, which pretty close to the study’s overall estimate of Long COVID prevalence (also about 10%). Vaccination or infection with an Omicron variant may make you less likely to get Long COVID, this study suggests, but the risk is still very present.
    • Repeat infections may increase Long COVID risk. RECOVER was able to follow 2,150 people who got infected during the Omicron wave, including 81 who had multiple infections. Of those with multiple infections, 16 people—or one in five—had Long COVID symptoms within six months. That’s double the prevalence rate of those who just had one infection in the same timeframe (10%). While these are small numbers, the finding is certainly worth further study; see this thread from patient-expert Hannah Davis for more details.
    • This is not a prevalence paper, and it does not provide a clinical definition of Long COVID. Some media coverage might suggest that this paper has “defined Long COVID,” which is a misrepresentation of the study. While the authors do propose a new framework for evaluating potential Long COVID patients, they make it clear that a lot more research and iteration will be needed before any RECOVER findings should be used in the doctor’s office. The paper also doesn’t provide a definitive answer on how many people get Long COVID, since it includes a relatively small number of people who were uninfected when they joined the study. Quoting Lisa McCorkell again: “It is very clear throughout the paper that in order for this to be actionable at all, iterative refinement is needed.”
    • This won’t be the last paper sharing findings from the RECOVER cohort. This study presented data from patients’ symptom surveys, which is just one small part of the RECOVER cohort’s activities. The enrolled patients have also undergone extensive medical testing and symptom tracking over time, which will be the subject of future studies—and will be used to refine RECOVER’s Long COVID framework. Clinical trials will (eventually) provide more data as well.

    To my fellow journalists covering this study: I highly encourage you to present this paper as a small part of a complicated, iterative research process, rather than a definitive answer to long-standing questions about Long COVID. I also encourage you to talk to patient-experts and ask for their criticisms of the study (like those I’ve cited here), rather than just letting the RECOVER leadership go unchallenged.

    More Long COVID reporting

  • National numbers, May 28

    National numbers, May 28

    The CDC is now updating its variant estimates every two weeks.

    In the past week (May 14 through 20), the U.S. reported about 8,300 new COVID-19 patients admitted to hospitals, according to the CDC. This amounts to:

    • An average of 1,200 new admissions each day
    • 2.5 total admissions for every 100,000 Americans
    • 11% fewer new admissions than last week (May 7-13)

    Additionally, the U.S. reported:

    • A 16% lower concentration of SARS-CoV-2 in wastewater than last week (as of May 24, per Biobot’s dashboard)
    • 54% of new cases are caused by Omicron XBB.1.5; 19% by XBB.1.16; 18% by XBB.1.9 (as of May 27)

    The COVID-19 plateau continues, with hospital admissions and viral levels in wastewater (the two main metrics I’m looking at these days) both trending slightly down at the national level. Newer Omicron variants are still on the rise, but don’t seem to be impacting transmission much yet.

    Hospitalizations continue to trend slightly down across the board, though hospitals are still reporting more than 1,000 new COVID-19 patients each day. The vast majority of U.S. counties have low hospitalization levels, according to the CDC, with just 14 counties in the medium or high categories.

    Coronavirus levels in wastewater are following a similar pattern: trending down very slightly, continuing the middling plateau of the last couple of months. All four major regions are still in this holding pattern, according to Biobot’s data.

    We have new variant data this week, as the CDC is now on a biweekly schedule for updates. XBB.1.5 caused just over half of new cases in the U.S. in the two weeks ending May 27, as it slowly gets outcompeted by newer versions of Omicron. XBB.1.16 and XBB.1.9 continue to rise, causing 19% and 18% of hew cases respectively.

    XBB.1.16 is most prevalent on the West Coast, the Northeast, and the Gulf Coast states, while XBB.1.9 is most prevalent in the Midwest, according to the CDC—though these estimates are becoming less reliable over time, since so few COVID-19 samples are sequenced.

    The CDC has also recently added national and regional COVID-19 test positivity data back to its dashboard, representing tests conducted by labs in the CDC’s National Respiratory and Enteric Virus Surveillance System.

    Nationally, test positivity is trending down, at just under 5% of COVID-19 tests (in this lab network) returning positive results in the most recent week of data. Test positivity is trending up slightly in the Northeast and New York/New Jersey regions; I’ll be following to see if this continues in the coming weeks.

    Finally, a bit of good news: excess deaths in the U.S. have returned to baseline in the last couple of months. While hundreds are still dying from COVID-19 every day, the excess death trend suggests that the disease is currently not causing a significant ripple effect on overall mortality the way that it did in earlier stages of the pandemic. (Of course, this could change with a new surge.)

  • COVID source shout-out: Virginia’s new wastewater dashboard

    COVID source shout-out: Virginia’s new wastewater dashboard

    One of the visuals available on Virginia’s new wastewater dashboard.

    With the public health emergency ending, a lot of state and local health departments are sunsetting or paring down their COVID-19 dashboards. Wastewater surveillance data are an exception, though, with agencies continuing to test sewage (and share the results) as other forms of COVID-19 testing become less available.

    Virginia’s Department of Health is one notable example: this past week, the agency added a new wastewater surveillance section to its COVID-19 dashboard. The new section includes a map of testing sites, coronavirus trends by site, viral loads over time, and plenty of text explaining how to interpret the data.

    This dashboard will be a great resource for Virginia residents aiming to continue following COVID-19 spread in their communities. It’ll be updated weekly on Tuesdays, according to the department.