
During the most recent week of data available (July 2 through 8), the U.S. reported about 6,200 new COVID-19 patients admitted to hospitals, according to the CDC. This amounts to:
- An average of 900 new admissions each day
- 1.9 total admissions for every 100,000 Americans
- 1% fewer new admissions than the prior week (June 25-July 1)
Additionally, the U.S. reported:
- 6.3% of tests in the CDC’s surveillance network came back positive
- A 9% higher concentration of SARS-CoV-2 in wastewater than last week (as of July 19, per Biobot’s dashboard)
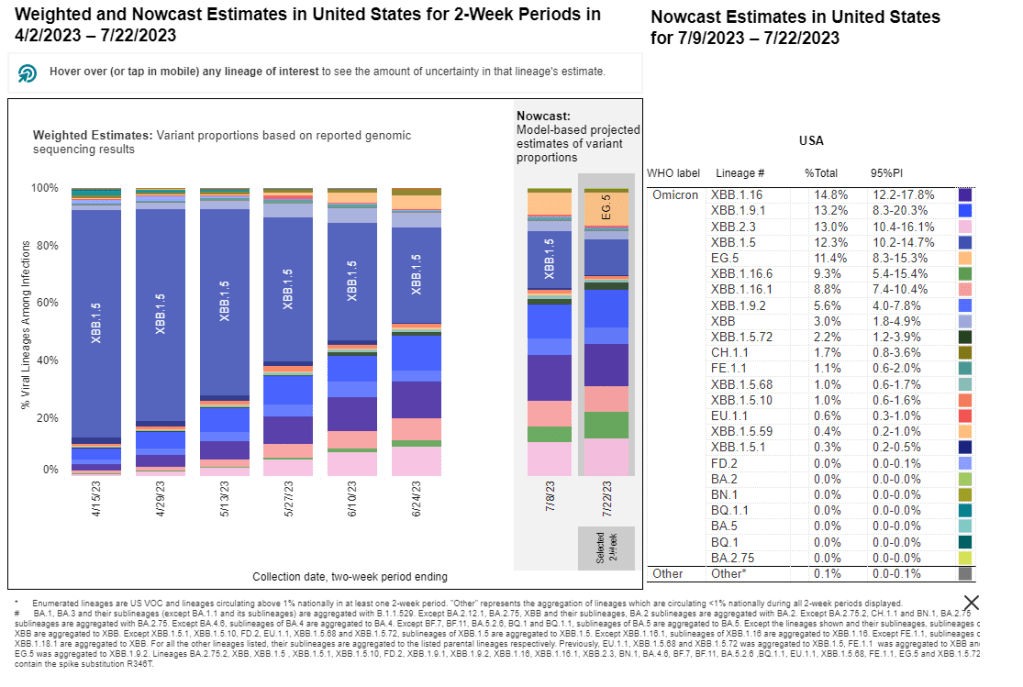
- 24% of new cases are caused by Omicron XBB.1.6; 19% by XBB.1.9; 13% by XBB.2.3 (as of July 22)
COVID-19 data in the U.S. is showing increasingly clear signs of a summer surge, with infections rising across the country. However, thanks to the federal public health emergency’s end, we have less and less data to track this trend.
Wastewater data from Biobot Analytics show that national coronavirus levels have gone up by about 68% in the last month. Current levels are far below this time last year (when the Omicron BA.4/BA.5 surge was in full swing), but still at their highest in several months.
Biobot’s regional data suggest that the COVID-19 uptick is hitting all major regions. But the increases have been most pronounced in the Northeast and South; coronavirus levels have doubled in both regions in the last month, per Biobot.
The CDC’s wastewater surveillance network has picked up these increases as well, with more than half of testing sites in this network (with recent data) reporting coronavirus upticks in the last two weeks. Some major cities, such as Boston and Los Angeles, are also reflecting the increase.
Test positivity data from the CDC also show the increasing COVID-19 spread: nationally, test positivity from the labs in the agency’s surveillance network has gone up from 4.3% one month ago to 6.3% in the most recent week of data. The most prominent increases for this metric are similarly in the Northeast and South, and in the health region including Oregon, Washington, Idaho, and Alaska.
One metric not yet showing an increase is the CDC’s hospital admissions data. But the agency has continued to report these data with a lag: as of today, the most recent hospitalization numbers are as of July 8, two weeks ago. The CDC has yet to provide a clear explanation for this reporting lag.
Either way, the data we do have give us sufficient warnings about this summer’s uptick in COVID-19 spread. One likely culprit is the continued evolution of Omicron XBB: about 15 different subvariants are currently competing, according to the CDC’s latest data. No variant seems to be a clear winner yet.
Regardless of which variant comes to dominate next, the same safety measures continue to work against COVID-19.

Leave a comment