Tag: winter surge

  • National numbers, February 19

    National numbers, February 19

    COVID-19 hospitalization data from the CDC suggest that new hospital admissions haven’t really dipped below a high baseline since spring 2022.

    In the past week (February 9 through 15), the U.S. officially reported about 260,000 new COVID-19 cases, according to the CDC. This amounts to:

    • An average of 37,000 new cases each day
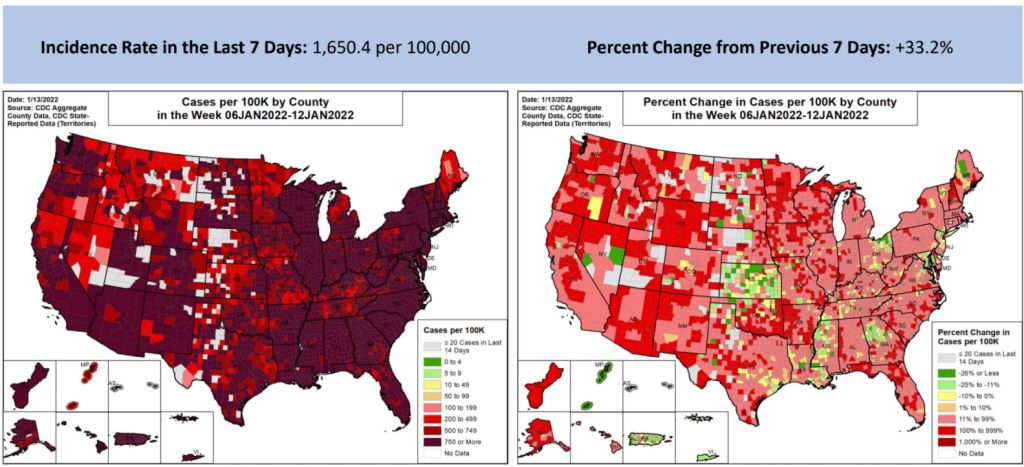
    • 79 total new cases for every 100,000 Americans
    • 8% fewer new cases than last week (February 2-8)

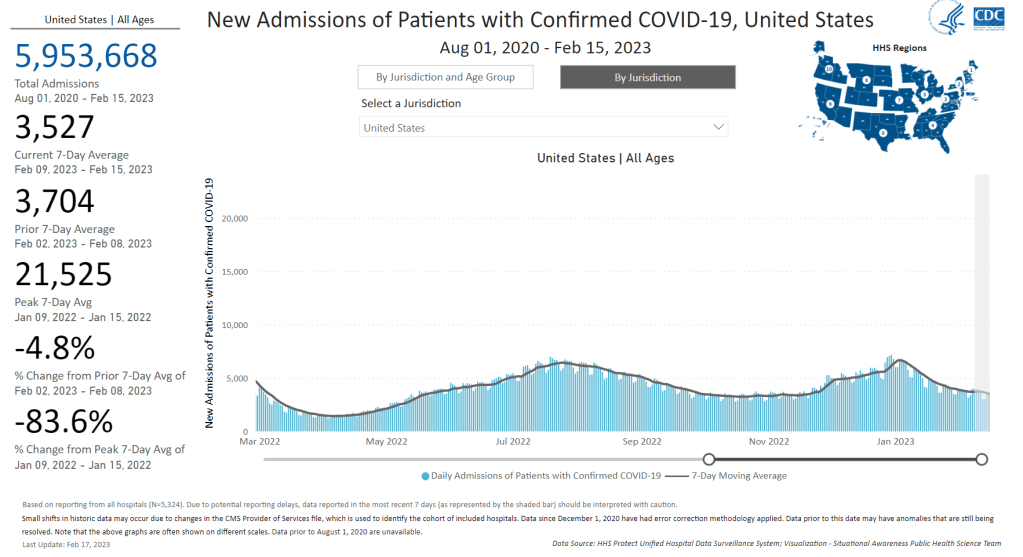
    In the past week, the U.S. also reported about 25,000 new COVID-19 patients admitted to hospitals. This amounts to:

    • An average of 3,500 new admissions each day
    • 7.5 total admissions for every 100,000 Americans
    • 5% fewer new admissions than last week

    Additionally, the U.S. reported:

    • 2,800 new COVID-19 deaths (400 per day)
    • 80% of new cases are caused by Omicron XBB.1.5; 16% by BQ.1 and BQ.1.1; 1% by CH.1.1 (as of February 18)
    • An average of 70,000 vaccinations per day

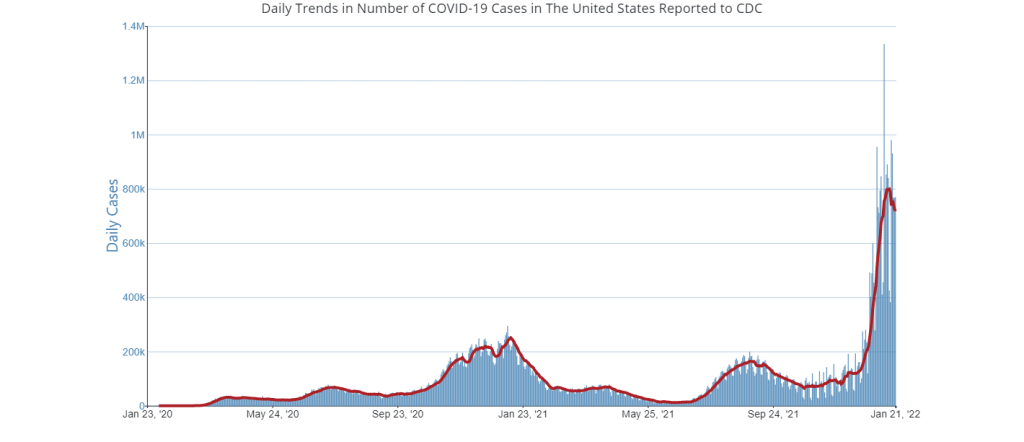
    Nationally, official COVID-19 cases and hospitalizations continue to trend slowly downward, suggesting that we’re in a high plateau of consistent virus spread. Reported cases have only declined by about 18% in the last month, while new hospital admissions have declined by 28%.

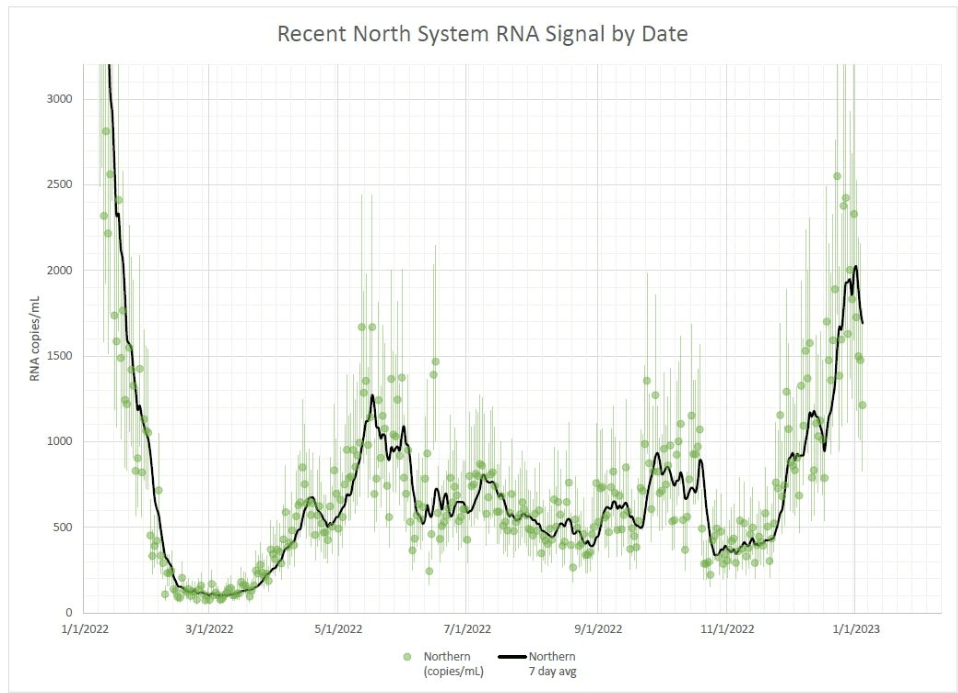
    Wastewater surveillance data from Biobot also continue to indicate that COVID-19 spread has plateaued nationally, with slightly different trends at the regional level: a potential uptick in the Northeast, a trend back down in the Midwest, and slight declines in the West and South.

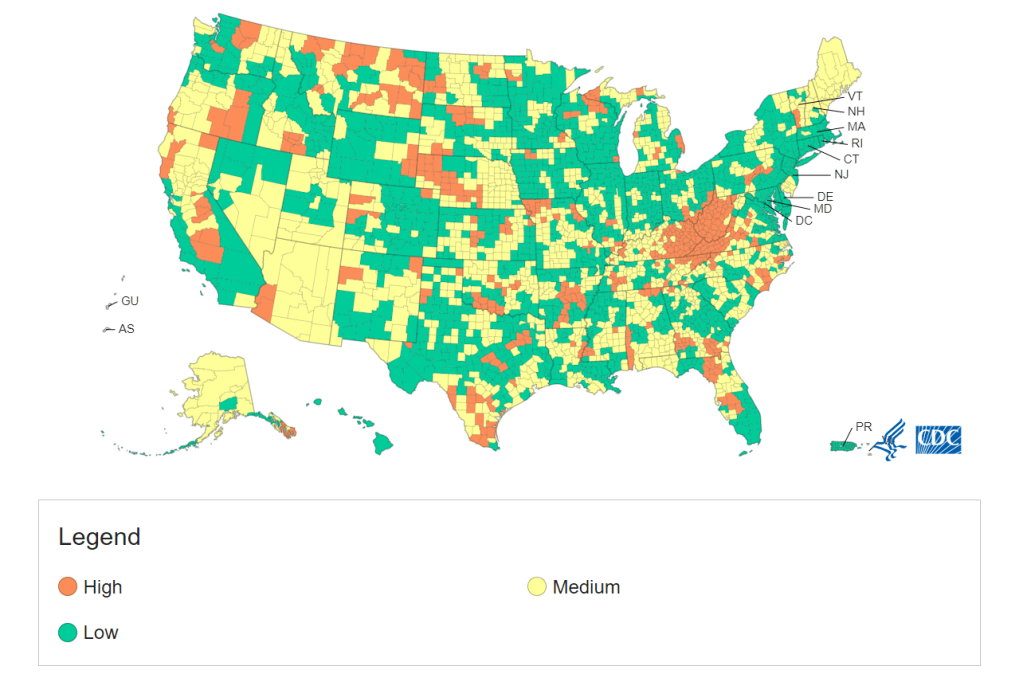
    At the state level, some Midwest states continue to report increases in their COVID-19 cases and hospitalizations. These states include: Wyoming, Alaska, Montana, Utah, Nebraska, Michigan, and Missouri. (Though the wastewater decline could indicate that these trends in clinical case data may turn around soon.)

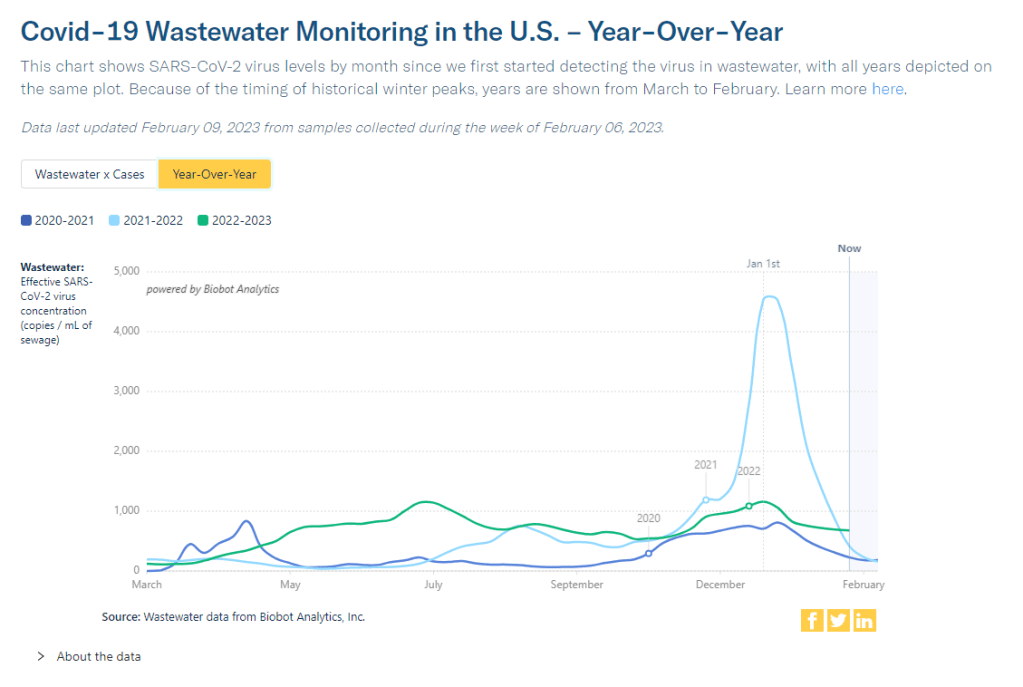
    As I pointed out last week, the current COVID-19 plateau is unique from what the U.S. experienced around this time in 2022 and 2021. In both of those years, virus spread declined significantly after a winter surge, leading to relatively low levels in the spring. But this year, the decline has been shorter and has stopped earlier, leaving us with continued high COVID-19.

    Biobot’s communications team pointed out on Twitter recently that the national average of coronavirus concentrations in wastewater is “about 60% higher than it was at this time in 2022” and “almost two times what it was at this time in 2021.”

    Why isn’t transmission declining more? The XBB.1.5 could be playing a role here, as it spreads further across the country. This highly-contagious version of Omicron accounted for about 80% of new cases in the U.S. last week, according to the CDC’s estimates, and is now heavily dominant in almost every region of the country.

    But I suspect a bigger culprit here is likely the complete lack of COVID-19 safety protocols right now. In spring 2021, first-round vaccines and continued non-pharmaceutical interventions played a big role in preventing disease, while in 2022, the U.S. had a lot of immunity from vaccinations and the recent, massive Omicron BA.1 surge, combined with some continuation of other measures. (Though that immunity quickly faded when BA.2 came on the scene.)

    Now, we have less population immunity, less non-pharmaceutical interventions, and less overall awareness of the continued problems posed by COVID-19. This broad apathy towards the coronavirus hides the fact that over 400 people are still dying from this disease every day.

  • This winter’s COVID-19 surge wasn’t “mild”

    This winter’s COVID-19 surge wasn’t “mild”

    Wastewater surveillance data from Biobot suggests that COVID-19 spread this winter (2022-2023) was higher than all other surges prior to Omicron’s emergence.

    You might have seen some headlines like this in the last few weeks: COVID-19 was “mild” this winter. This winter was “better” than previous winters. COVID-19 is becoming “another seasonal virus” like flu and RSV. But is this true?

    While it’s accurate that the U.S. reported fewer COVID-19 cases this past winter compared to last year (when the country experienced our first, massive Omicron surge) or the prior year (our biggest surge pre-vaccines), this winter still saw an extraordinary amount of severe illness, death, and potential future disability due to COVID-19. Surges of other respiratory viruses also put enormous strain on the healthcare system.

    If we call this winter “mild,” we run the risk of believing this level of disease is acceptable. Such portrayals of COVID-19 seek to make us think future surges will be nothing to worry about, despite clear evidence to the contrary.

    Let’s go through some numbers. Since the beginning of November, the U.S. has reported:

    • More than 5 million new COVID-19 cases (reported). Note that cases are likely underreported by 10 to 20 times in our era of under-testing, so the true number may be closer to 100 million.
    • More than 400,000 new COVID-19 hospitalizations, piling on top of hospitalizations for the flu, RSV, and other diseases, and coming as hospitals deal with staff shortages and worker burnout.
    • More than 40,000 new COVID-19 deaths, amounting to more than 400 new deaths per day. This number is also likely an undercount, as death certificates can take a long time to be processed.
    • The majority of COVID-19 deaths were among vaccinated people. A report from the Kaiser Family Foundation found that breakthrough deaths started to outnumber those among unvaccinated people in summer 2022, a trend that has continued with low booster uptake.
    • Coronavirus levels in wastewater were higher than all surges prior to Omicron, including the winter surge in 2020-2021 and the Delta surge in summer 2021, according to data from Biobot.
    • XBB.1.5, the latest and most contagious Omicron subvariant, evolved in the U.S. this winter, likely in New York State. Unchecked COVID-19 spread makes it easier for the virus to keep mutating.
    • More than 5% of American adults are currently experiencing Long COVID. This number has ranged from 5.5% to 7% since September 2022, according to the CDC and Census’ Household Pulse Survey.
    • Almost 80% of adults with Long COVID report activity limitations due to the condition, including about 25% who report “significant” activity limitations, per the Household Pulse Survey.

    In an average week this winter, the U.S. reported more deaths from COVID-19 than the number of casualties on September 11, 2001. The latter event was a horrific tragedy that inspired lasting changes to national security, while the former has been written off as “mild.”

    Past surveys from many sources—including the CDC itself—have suggested that, when people know COVID-19 is spreading widely in their communities, they’re willing to take basic safety precautions. But when government leaders and mainstream media outlets downplay the risks, people don’t have the information they need to make informed choices. We’ve seen this pattern at a large scale this winter, and I worry that the trend will only continue.

    And here’s what concerns me even more: in previous winters, cases went up over the holidays, then declined through January and February. This year, however, the decline isn’t really happening. Transmission has gone down a bit from its peak, but it’s now plateaued at a level higher than the peaks of previous surges, per Biobot’s data.

    So, not only did we have a bad surge this winter, we’re now stuck at a high-COVID baseline that seems very difficult to shake, in the era of many new variants and few public health precautions. The situation reminds me of a Twitter thread from the evolutionary biologist T. Ryan Gregory, which I shared when writing about XBB.1.5 in early January:

    That “area under the curve” is what the U.S. is seeing now, as COVID-19 spread stays at high levels. Thousands of cases a day, thousands of hospitalizations a day, hundreds of deaths a day.

    As a journalist and as an individual capable of taking precautions, I resist the narrative that any of this is acceptable. If you’re reading this, I hope you can, too.

    More federal data

  • National numbers, January 8

    National numbers, January 8

    Wastewater surveillance in Boston suggests COVID-19 transmission has reached levels not seen since last winter.

    In the past week (December 29 through January 4), the U.S. officially reported about 470,000 new COVID-19 cases, according to the CDC. This amounts to:

    • An average of 67,000 new cases each day
    • 143 total new cases for every 100,000 Americans
    • 16% more new cases than last week (December 22-28)

    In the past week, the U.S. also reported about 46,000 new COVID-19 patients admitted to hospitals. This amounts to:

    • An average of 6,500 new admissions each day
    • 13.9 total admissions for every 100,000 Americans
    • 16% more new admissions than last week

    Additionally, the U.S. reported:

    • 2,700 new COVID-19 deaths (390 per day)
    • 28% of new cases are caused by Omicron XBB.1.5; 56% by BQ.1 and BQ.1.1; 5% by XBB (as of January 7)
    • An average of 150,000 vaccinations per day

    Well, here we are: the winter COVID-19 surge. It may have happened later than some experts predicted, but the U.S. is clearly now experiencing an uptick in virus transmission as the latest, most contagious Omicron subvariants collide with holiday travel and gatherings.

    You might notice that the CDC’s official case numbers didn’t rise too dramatically this week (though the national count is up 16% compared to last week). That’s unsurprising: case increases after holidays are always delayed, because many testing sites and public health officials take time off from processing new data. Christmas and New Year’s tend to deliver the worst of this trend—and in 2022, limited access to PCR testing made case numbers even less reliable.

    Wastewater surveillance, on the other hand, clearly shows a significant rise in coronavirus spread from early December through early January—building on another rise that followed Thanksgiving. Biobot’s dashboard suggests that the U.S. as a whole is seeing about as much COVID-19 transmission now as we saw at the peak of the summer BA.5 wave. In some places, transmission is the highest it’s been since last January (during the original Omicron surge.)

    The CDC’s wastewater data similarly show increasing COVID-19: out of 600 sites with available recent data, more than half were reporting upticks in the two-week period ending January 2. 117 of those sites reported an increase between 100% and 999%, and 87 reported an increase over 1,000%.

    Regionally, the Northeast has reported the biggest recent COVID-19 spike in wastewater, though the trend may already be turning around. We see this both in Biobot’s regional data and in individual cities and counties, like Boston and New York City. The Northeast is also a hotspot for XBB.1.5, a homegrown Omicron subvariant that’s spreading faster than other lineages. (More on that later in the issue.)

    In addition to the wastewater surveillance, hospitalization data have remained uninterrupted by the holidays with clear increases in COVID-19 patients through December and into this week. This week, about 6,600 new COVID-19 patients were admitted to hospitals nationwide, a 16% increase from the prior week and about twice the number of people admitted during the week before Thanksgiving.

    Washington D.C., Connecticut, Massachusetts, and West Virginia reported the highest rates of new COVID-19 patients in the week ending January 3, according to the latest Community Profile Report. They were followed by other Northeast states New Jersey, New York, and Delaware. But states reporting the highest increases in hospitalization are in the South: Louisiana, Mississippi, Florida, Texas.

    Two pieces of good news for this week: the flu and RSV are both trending down after their surges earlier in the fall. High levels of influenza-like activity remain in the majority of states, though. And we may see a second flu peak driven by a second strain, as Katelyn Jetelina reports in Your Local Epidemiologist.

    All the same safety measures we know and love—masks, testing, vaccinations, etc.—continue to help reduce the risk of COVID-19 and other viruses. But uptake of these measures remains low. As of January 5, only 15% of the eligible U.S. population has received an Omicron-specific booster dose, per the CDC.

  • National numbers, March 6

    National numbers, March 6

    About 90% of the U.S. population now lives in a medium- or low-level COVID-19 “Community Level,” according to the CDC.

    In the past week (February 26 through March 4), the U.S. reported about 371,000 new COVID-19 cases, according to the CDC. This amounts to:

    • An average of 53,000 new cases each day
    • 113 total new cases for every 100,000 Americans
    • 29% fewer new cases than last week (February 19-25)

    Last week, America also saw:

    • 30,000 new COVID-19 patients admitted to hospitals (9 for every 100,000 people)
    • 11,000 new COVID-19 deaths (3.3 for every 100,000 people)
    • 100% of new cases are Omicron-caused (as of February 26)
    • An average of 140,000 vaccinations per day (per Bloomberg)

    New COVID-19 cases continue falling in the U.S. as the Omicron wave fizzles out. This week, the CDC reported an average of 53,000 new cases a day—less than one-tenth the cases reported at the peak of this surge.

    Hospitalization metrics also continue falling. About 30,000 new COVID-19 patients were admitted to U.S. hospitals this week, compared to almost 150,000 at the peak of the surge. According to the Hospital Circuit Breaker dashboard, only two states are currently at or over hospital capacity: Nebraska and Vermont.

    We’re now in the second week of the CDC’s new “Community Level” guidance for safety precautions tied to regional COVID-19 metrics. As of this week, “more than 90% of the U.S. population is in a location with low or medium COVID-19 Community Level,” according to the agency.

    Of course, the agency’s old guidance—still available on its COVID-19 dashboard—is less generous. According to these metrics, almost half of the country is still seeing “high community transmission,” with more than 100 new cases per 100,000 people in the last week. Remember, even though case numbers are much lower now than they were in early January, the Omicron surge warped our whole sense of COVID-19 proportion.

    Meanwhile, some parts of the country where Omicron arrived and peaked earlier are now in distinct plateaus. This includes Washington, D.C. and New York City; in NYC, case rates have actually started ticking back up very slightly in the last week.

    I personally trust NYC case numbers more than that metric in other places because the city still has widely available public testing. But as other cities and states close testing sites and redirect people to at-home tests, case numbers will continue becoming less reliable over the coming weeks. So, I am thinking about shifting these national updates to focus more on other metrics, like hospitalizations and wastewater.

    Readers, what do you think? Any recommendations for metrics you’d like to read more about here? Comment below or email me and let me know.

  • National numbers, February 20

    National numbers, February 20

    The majority of U.S. counties are still seeing high transmission, according to the CDC, but a few places like Maryland and New York City are starting to fall below this threshold.

    In the past week (February 12 through 18), the U.S. reported about 850,000 new COVID-19 cases, according to the CDC. This amounts to:

    • An average of 122,000 new cases each day
    • 259 total new cases for every 100,000 Americans
    • 43% fewer new cases than last week (February 5-11)

    Last week, America also saw:

    • 60,000 new COVID-19 patients admitted to hospitals (18 for every 100,000 people)
    • 14,000 new COVID-19 deaths (4.3 for every 100,000 people)
    • 100% of new cases are Omicron-caused (as of February 12)
    • An average of 200,000 vaccinations per day (per Bloomberg)

    New COVID-19 cases continue to drop in the U.S. as the country slowly comes down from its Omicron wave. This week, the country reported a total of 850,000 new cases, according to the CDC; it’s the first week under one million new cases have been reported since early December, though we are still seeing over 100,000 new cases a day.

    Hospitalizations are also going down, with the Department of Health and Human Services reporting about 65,000 beds in use for confirmed and suspected COVID-19 patients as of Saturday. The hospital circuit breaker dashboard (by Jeremy Faust et al.) shows that the vast majority of U.S. hospitals have capacity, as of this week. Still, over 2,000 Americans continue to die of COVID-19 each day.

    At the state level, we continue to see case decreases across the country. The one exception is Maine: this state saw a 350% increase in cases from last week to this week, according to the February 17 Community Profile Report. However, local reports suggest that a number of the new cases reported this week were backlogged—meaning the cases occurred weeks ago and were belatedly added to state tallies.

    After over a month of falling case numbers nationwide, some parts of the country are finally dropping below the CDC’s high transmission threshold (100 new cases for every 100,000 residents reported in a week). Maryland is the first state to do this, with 92 new cases for every 100,000 residents reported in the week ending February 17.

    New York City, where I live, also fell below the high transmission threshold this week, with 83 new cases for every 100,000 residents reported in the week ending February 15, according to city data. Both New York City and Maryland were early Omicron hotspots and have reported falling case numbers since early January.

    While Omicron overall continues to cause 100% of new COVID-19 cases in the country, BA.2, the slightly-more-transmissible sister lineage, is starting to gain ground. The CDC estimates that BA.2 caused 3.9% of new cases in the week ending February 12, compared to 1.5% of new cases in the previous week. As BA.2 continues replacing original Omicron, we’ll see if this subvariant has an impact on the U.S.’s downward case trends.

  • National numbers, February 13

    National numbers, February 13

    Current COVID-19 hospitalizations in the U.S. have fallen under 100,000 for the first time since the Omicron surge started. Chart by Conor Kelly, posted on Twitter on February 9.

    In the past week (February 5 through 11), the U.S. reported about 1.5 million new COVID-19 cases, according to the CDC. This amounts to:

    • An average of 215,000 new cases each day
    • 459 total new cases for every 100,000 Americans
    • One in 218 Americans testing positive for COVID-19
    • 43% fewer new cases than last week (January 29-February 4)

    Last week, America also saw:

    • 85,000 new COVID-19 patients admitted to hospitals (26 for every 100,000 people)
    • 16,000 new COVID-19 deaths (4.9 for every 100,000 people)
    • 100% of new cases are Omicron-caused (as of February 5)
    • An average of 300,000 vaccinations per day (per Bloomberg)

    COVID-19 cases continue to decline across the U.S. as the country comes out of its Omicron surge. Nationwide, the U.S. reported an average of 215,000 new cases a day last week—a drop of about 75% from the peak of the Omicron surge, when nearly 800,000 new cases were reported each day.

    Hospitalizations are also decreasing: this week, the number of confirmed and suspected COVID-19 patients in U.S. hospitals dropped under 100,000 for the first time since the surge started in December. Deaths are decreasing as well, but are still at high levels: over 2,000 Americans are dying of COVID-19 each day.

    All 50 states and the majority of counties continue to report case declines, according to the latest Community Profile Report. But case rates are still very high across the country, well above the CDC’s threshold for high transmission (more on this later in the issue).

    States with high case rates this week include Alaska, Kentucky, West Virginia, Montana, Mississippi, North Dakota, California, and Idaho; all reported over 700 new cases for every 100,000 residents in the week ending February 9.

    Omicron is still causing 100% of new cases in the country, according to CDC estimates. But the agency is now splitting its estimates into the original Omicron and its sister strain BA.2: BA.2 caused between 2% and 7% of new cases nationwide in the week ending February 5, the CDC says. In the coming weeks, we’ll see whether this strain—which is even more transmissible than original Omicron—has an impact on U.S. case numbers.

    New vaccination numbers have been fairly low for the past couple of weeks, with an average of under 300,000 shots given each day (including boosters). And the FDA is now delaying vaccine authorization for children under age 5: the agency has decided to wait for Pfizer to provide data on how well a three-dose series performs in this age group, after initially considering authorization based on data about two doses.

  • National numbers, February 6

    National numbers, February 6

    COVID-19 cases are now on the decline almost everywhere in the U.S. (right), though they are still incredibly high throughout the country (left). Note that Tennessee appears (incorrectly) green on the left because of a data error. Chart from the February 3 Community Profile Report.

    In the past week (January 29 through February 4), the U.S. reported about 2.6 million new cases, according to the CDC. This amounts to:

    • An average of 378,000 new cases each day
    • 806 total new cases for every 100,000 Americans
    • One in 124 Americans testing positive for COVID-19
    • 38% fewer new cases than last week (January 22-28)

    Last week, America also saw:

    • 112,000 new COVID-19 patients admitted to hospitals (34 for every 100,000 people)
    • 17,000 new COVID-19 deaths (5.1 for every 100,000 people)
    • 100% of new cases are Omicron-caused (as of January 29)
    • An average of 300,000 vaccinations per day (per Bloomberg)

    Nationwide, new COVID-19 case numbers have decreased for the third week in a row. The country reported an average of 378,000 new cases each day last week—about half the daily case number reported at the peak of the Omicron surge three weeks ago.

    Hospitalizations are also decreasing, with the HHS reporting about 115,000 inpatient beds used for COVID-19 patients as of February 5—down from a peak of over 150,000. Still, hospitals across the country continue to be overwhelmed as they deal with staffing shortages and limited drugs that work against Omicron compared to past variants.

    National COVID-19 deaths passed 900,000 this week, according to the New York Times and other trackers. More than 2,000 Americans are dying of COVID-19 every day, and this trend is likely to continue as the Omicron surge wanes; as always, patterns in death data follow patterns in case data by several weeks.

    New case rates are dropping in all 50 states and almost all territories, according to the latest Community Profile Report. States with the highest case rates this week include Alaska, North Dakota, Washington, West Virginia, Wyoming, and Tennessee: all reported at or above 1,200 new cases for every 100,000 people in the week ending February 2.

    Remember, even though cases are going down, many parts of the country are still seeing far higher numbers than they did in previous surges. Even in New York City, now about a month past the peak of its Omicron surge, the city health department reported about 220 new cases for every 100,000 people last week—more than double the CDC threshold for high transmission. It’s important that we remain cautious until the numbers are truly low.

    As Omicron continues to spread—and as the U.S. reported record cases in children this past January—Pfizer has announced it plans to ask the FDA to authorize its vaccine for children under age 5. The problem is: Pfizer’s clinical trial data have, so far, demonstrated that a two-dose vaccine series with a very small dosage is effective in the youngest kids (6 months to 2 years), but not in kids ages 2 to 5. COVID-19 experts are split on this rather complicated situation; you can find more details at Your Local Epidemiologist and at STAT News.

  • National numbers, January 30

    National numbers, January 30

    COVID-19 hospitalizations are on the decline nationwide, though they have not yet dropped as steeply as cases. Chart via the CDC, retrieved January 29.

    In the past week (January 22 through 28), the U.S. reported about 4.2 million new cases, according to the CDC. This amounts to:

    • An average of 597,000 new cases each day
    • 1,273 total new cases for every 100,000 Americans
    • One in 79 Americans testing positive for COVID-19
    • 20% fewer new cases than last week (January 15-21)

    Last week, America also saw:

    • 135,000 new COVID-19 patients admitted to hospitals (41 for every 100,000 people)
    • 16,000 new COVID-19 deaths (4.9 for every 100,000 people)
    • 100% of new cases are Omicron-caused (as of January 22)
    • An average of 600,000 vaccinations per day (per Bloomberg)

    Last week, COVID-19 case numbers started to indicate that the U.S.’s Omicron surge was turning a corner; this week, cases are clearly on the decline. National new case reports have dropped by about 24% in the past two weeks, from 784,000 new cases a day in mid-January to 597,000 new cases a day last week.

    COVID-19 hospitalizations are also on the decline, though this metric is not dropping as steeply: the number of patients hospitalized with confirmed COVID-19 nationwide went from nearly 150,000 in mid-January to 138,000 this past week, according to the CDC.

    Deaths, meanwhile, are still increasing, as trends in deaths tend to lag behind trends in cases by several weeks. Over 2,000 Americans died of COVID-19 each day last week, and the country is on track to reach 900,000 total deaths in early February (in the official count, anyway—the true death toll is likely much higher).

    Cases have been dropping in Northeast hotspots like New York, New Jersey, D.C., Maryland, and Delaware for several weeks now. In New York City, for example, the number of new COVID-19 cases last week was one-ninth the cases reported during the city’s Omicron peak in early January—though the city and state overall are still at case levels far above the CDC threshold for high transmission.

    At the same time, cases continue to increase in some Western states, including Montana, Idaho, and Washington. The states with the highest COVID-19 case rates per capita right now are Alaska, Oklahoma, Kentucky, North Dakota, and California; all reported about 2,000 new cases per 100,000 residents in the last week, according to the latest Community Profile Report.

    The Omicron surge has inspired many Americans to get vaccinated. About 75% of the U.S. population has now received at least one vaccine dose, per the CDC, and more than 40% of those fully vaccinated have received a booster shot. But vaccines are still unavailable for the youngest Americans, contributing to a rise in pediatric cases: in the week ending January 20, a record 1.1 million COVID-19 cases were reported among children.

  • National numbers, January 23

    National numbers, January 23

    Has Omicron peaked in the U.S.? Nationally, it seems possible, but the situation is more complicated at the state and local level. Chart via the CDC, retrieved on January 23.

    In the past week (January 15 through 21), the U.S. reported about 5.2 million new cases, according to the CDC. This amounts to:

    • An average of 745,000 new cases each day
    • 1,588 total new cases for every 100,000 Americans
    • One in 63 Americans testing positive for COVID-19
    • 5% fewer new cases than last week (January 8-14)

    Last week, America also saw:

    • 147,000 new COVID-19 patients admitted to hospitals (45 for every 100,000 people)
    • 12,200 new COVID-19 deaths (3.7 for every 100,000 people)
    • 100% of new cases are Omicron-caused (as of January 15)
    • An average of 300,000 vaccinations per day (per Bloomberg)

    Has Omicron peaked in the U.S.? Looking at the national data, you might think so: new COVID-19 cases in the U.S. have dropped 5% from 5.5 million last week to 5.2 million this past week. While those numbers are astronomically high compared to past pandemic waves, it’s encouraging to think that they might not get higher.

    Hospitalization data also seem to have reached a peak; while about 150,000 Americans are currently hospitalized with COVID-19, according to the HHS, this number is no longer rapidly increasing. Patient numbers are starting to decline in the states and cities that were first hit by Omicron.

    It’s too soon to say that we’re actually coming down on the other side of the Omicron curve, though. For one thing, as Dr. Katelyn Jetelina pointed out in a recent issue of Your Local Epidemiologist, holiday reporting and test capacity could be playing a role here.

    Last Monday was Martin Luther King Jr. Day, a federal holiday that many health agencies and test providers took off—though not a holiday on the reporting disruption level of Christmas or New Year’s. And tests are incredibly hard to find in some parts of the country, meaning that our current system simply isn’t catching a large number of COVID-19 cases. (Remember: most COVID-19 case counts do not include cases identified with at-home antigen tests.) In short, the current trend is encouraging, but we’ll have to see next week if it continues.

    While the national picture is hard to interpret, it’s clear that the Northeast states that dealt with Omicron first are now on the decline. In New York City, the case rate has been reduced by over a third, from 3,500 new cases per 100,000 in a week at the beginning of January to 1,000 new cases per 100,000 in the last week. Case rates are also going down in New Jersey, Maryland, D.C., Connecticut, and Massachusetts.

    At the same time, other parts of the country are still in the first half of their Omicron surges. Cases rose by over 40% from last week to this week in Wisconsin, Wyoming, Oklahoma, Idaho, Ohio, and New Mexico, according to the latest Community Profile Report. In fact, Wisconsin now has one of the highest per capita case rates in the country, at 2,800 new cases per 100,000 in the week ending January 19.

    A recent NBC News article explains that the urban regions first exposed to Omicron have higher vaccination rates and more available hospital beds, making them more prepared to weather the variant. But now, Omicron is beginning to reach rural parts of the country that are less vaccinated, less capable of taking on patients, and still reeling from Delta. For these communities, the next few weeks are bound to be rough.

  • National numbers, January 16

    National numbers, January 16

    The entire country has extremely high COVID-19 transmission right now. Chart via the January 13 Community Profile Report.

    In the past week (January 8 through 14), the U.S. reported about 5.5 million new cases, according to the CDC. This amounts to:

    • An average of 783,000 new cases each day
    • 1,669 total new cases for every 100,000 Americans
    • One in 60 Americans testing positive for COVID-19
    • 33% more new cases than last week (January 1-7)

    Last week, America also saw:

    • 144,000 new COVID-19 patients admitted to hospitals (44 for every 100,000 people)
    • 12,100 new COVID-19 deaths (3.7 for every 100,000 people)
    • 98% of new cases are Omicron-caused (as of January 8)
    • An average of 1.3 million vaccinations per day (per Bloomberg)

    The U.S. once again broke COVID-19 records this week, reporting about 5.5 million new cases in total. Last winter, the highest number of cases reported in a single week was about 1.7 million; this past week, the country reported over one million cases just on Monday (though that number included backlogs from the prior weekend).

    Last week, I wrote that one in eighty Americans had tested positive for COVID-19. This past week, that number is one in sixty—again, not including people who tested positive on rapid, at-home tests.

    The U.S. also broke last winter’s hospitalization record this week: 157,000 patients are now hospitalized with COVID-19 across the country, according to the Department of Health and Human Services (HHS). Last winter’s record was about 125,000. But this number doesn’t capture the dire situations in ICUs, staff shortages, and other issues that hospitals are facing right now. (More on that later in the issue.)

    Northeast states continue to report the highest case numbers: Rhode Island, New York, Massachusetts, New Jersey, Delaware, and Florida all reported over 2,000 new cases for every 100,000 people in the week ending January 12, according to the latest Community Profile Report. Some of the earliest Omicron hotspots appear to have peaked; in New York City, for example, the weekly case rate is back under 2,000 new cases per 100,000 in the week ending January 11, down from a height of 3,500 new cases per 100,000 on January 3.

    But talking about specific state hotspots obscures from the fact that every single state is seeing insane COVID-19 numbers right now. Only four states reported fewer than 1,000 new cases per 100,000 last week—Wyoming, Montana, Idaho, and Maine—but their cases are climbing fast. Remember, the CDC threshold for high transmission is 100 new cases per 100,000.

    Speaking of hotspots: I have a new story in FiveThirtyEight this week, explaining that the most important Omicron hotspots actually can’t be seen on case maps. Right now, we need to identify outbreaks among the people most vulnerable to severe disease and those most capable of shutting down society; but the deluge of cases right now makes it hard to see and protect those people.

    Here’s the kicker of the piece:

    Still, the toolkit for addressing omicron hot spots is the same as it has been throughout the pandemic, said [Julia Raifman, a professor of health law, policy and management at the Boston University School of Public Health]. New federal requirements for vaccinations, masks, testing and ventilation would help protect the people most vulnerable to severe symptoms while also reducing case numbers in settings that can shut down society.

    “Federal guidance on mask mandates tomorrow would likely reduce deaths by tens of thousands,” Raifman said. “The perfect doesn’t need to be the enemy of the good, you don’t need every state to pass it. But you can put in place a mask policy during the surge, and it will reduce transmission and reduce the harms to health care workers and businesses.”

    In other words: When you can’t pinpoint specific hot spots, you need broad measures that can impact everyone. That strategy was made harder on Thursday, as an Occupational Safety and Health Administration rule that would have required around 80 million workers to get vaccinated or comply with regular testing was blocked by the Supreme Court. Without this rule, low-income workers will continue to face heightened risk of COVID-19 infection — and their cases will continue to ripple out.