- New toolkit for estimating COVID-19 risk from wastewater: Researchers at Mathematica published a new, open-source toolkit for interpreting wastewater data. It includes an algorithm that scientists and health officials can use to identify when a new surge might be starting based on wastewater results, as well as a risk estimator tool that combines wastewater data with healthcare metrics. The researchers developed this toolkit using data from North Carolina during the Delta and Omicron surges; their paper in PNAS last month describes it further, as does a blog post by the Rockefeller Foundation (which funded the project). This tool doesn’t provide real-time updates, as it only includes wastewater data through December 2022, but it offers a helpful model for using this source to inform public health policies.
- Vaccine delays for uninsured Americans: The CDC estimates that new COVID-19 boosters will become available in late September or early October, as I wrote last week. But Americans without health insurance may have to wait longer to get the shots or pay a hefty price tag, according to recent reporting from POLITICO. A federal government program with national pharmacy chains, which will provide the shots for free to uninsured people, is not slated to start until mid-October. Instead, uninsured people will need to pay out-of-pocket or find one of a small number of federal health centers to get vaccinated; this is likely to discourage vaccinations, POLITICO reports. And the number of uninsured people is only growing thanks to Medicaid redeterminations.
- Budget cuts at the CDC could mean layoffs: A recent op-ed in STAT News, written by two researchers familiar with the CDC’s organizational structure, warns that budget cuts at the agency could lead to a significant reduction in public health workers. The CDC’s budget was cut as part of the federal government’s debt ceiling negotiations last month, the authors explain. It faces a cut of about 10%, or $1.5 million a year, which could lead to significant layoffs. The reduced jobs are particularly likely to impact staff at the state and local levels, the op-ed’s authors argue, rather than at the CDC’d headquarters in Atlanta. “Reductions there will cut public health services and will have their greatest impact on the most vulnerable populations,” they write.
- Vaccine effectiveness for young children: Speaking of the CDC: the agency published a study this week in its Morbidity and Mortality Weekly Report describing COVID-19 vaccine effectiveness for the youngest children who are eligible (i.e. under five years old). Researchers at the CDC and partners at healthcare centers across the country tracked COVID-related emergency department and urgent care visits among young children, from July 2022 through July 2023. Effectiveness for the primary series was low: Moderna’s two-dose series scored just 29% effective at preventing ED and urgent care visits, while Pfizer’s three-dose series was 43% effective. Children who received a bivalent (Omicron-specific) follow-up dose were much more protected, however: this regimen was 80% effective. Bivalent boosers should be a priority for young kids along with adults, the study suggests.
- Immune system changes following COVID-19: Another notable study from this week, from scientists at Weill Cornell Medicine and other institutions, describes how severe COVID-19 cases may damage patients’ immune systems. The researchers analyzed how specific genes were expressed in immune system cells taken from people who had severe cases of COVID-19. They found expression changes as long as a year after patients’ initial infections, and connected those changes to inflammation, organ damage, and other long-term issues. These genetic changes may point to one cause for Long COVID symptoms, though the study is somewhat limited by its focus on patients who had severe symptoms early on (as most people with Long COVID have initially milder cases).
- Smell and taste loss following COVID-19: While smell loss has long been considered a classic COVID-19 symptom, a new study shows that taste loss is also common, even among people who don’t lose their sense of smell. Researchers at the Monell Chemical Senses Center (a nonprofit center in Philadelphia) studied these symptoms through an online survey, which included about 10,000 participants between June 2020 and March 2021. COVID-positive participants were more likely to report smell issues, taste issues, and both together, compared to people who didn’t get sick, the researchers found. Their survey methodology—which included asking people to self-assess their senses by smelling common household objects—could be used for further large-scale studies of these symptoms, the researchers write.
Tag: Wastewater
-
Sources and updates, August 20
-
National numbers, August 20

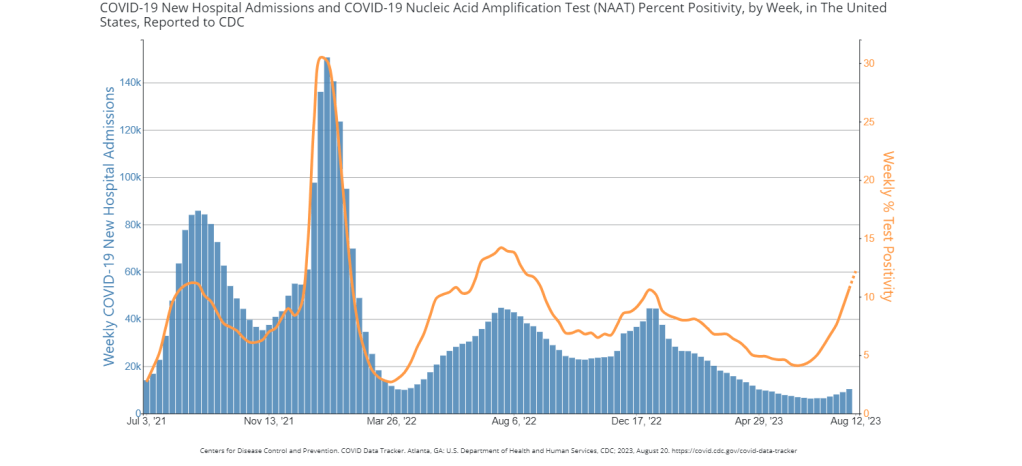
While the rise in hospitalizations has been modest, test positivity is on a similar level to the last couple of surges, per the CDC. Data as of August 18. During the most recent week of data available (July 30 through August 5), the U.S. reported about 10,300 new COVID-19 patients admitted to hospitals, according to the CDC. This amounts to:
- An average of 1,500 new admissions each day
- 3.1 total admissions for every 100,000 Americans
- 14% more new admissions than the prior week (July 23-29)
Additionally, the U.S. reported:
- 12.2% of tests in the CDC’s surveillance network came back positive
- A 10% higher concentration of SARS-CoV-2 in wastewater than last week (as of August 16, per Biobot’s dashboard)
- 25% of new cases are caused by Omicron XBB.1.6; 21% by EG.5; 11% by XBB.2.3; 13% by FL.1.5.1 (as of August 19)
The summer COVID-19 surge continues. While wastewater surveillance data suggest that transmission trends may be turning around in some places, the virus is largely still increasing across the U.S. New variants are on the horizon, too.
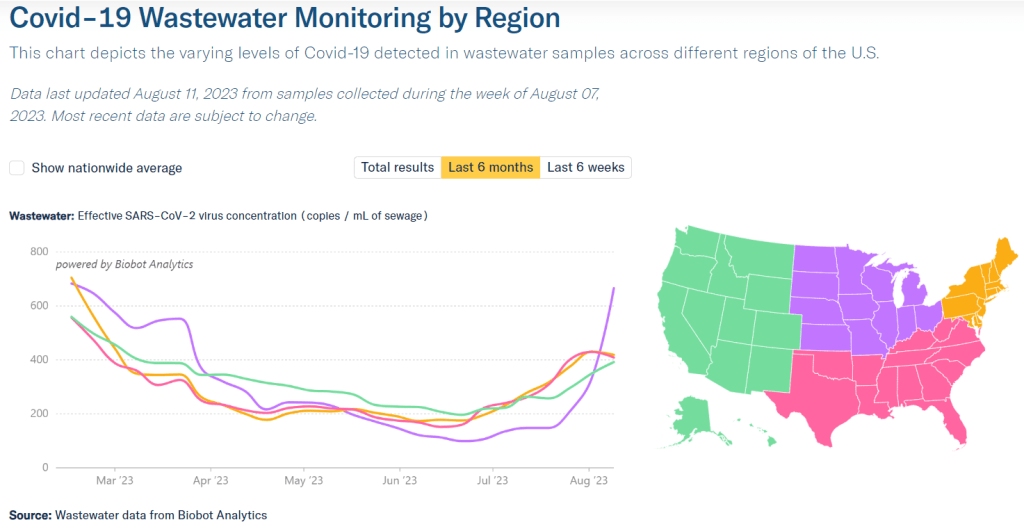
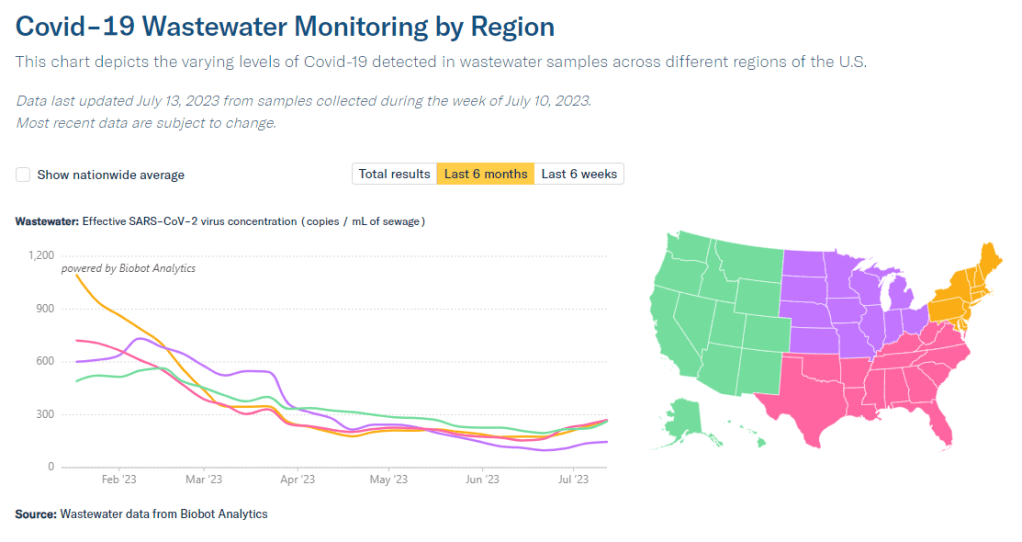
Nationally, coronavirus levels in wastewater are the highest they’ve been since last winter’s holiday surge, according to data from Biobot Analytics. Viral concentrations have tripled since mid-June, and continue to follow a similar pattern to the Delta surge that we experienced at about the same time in summer 2021.
Biobot’s regional data suggest that the Midwest—which reported a serious spike last week—may have turned a corner in this surge, with viral levels going into a plateau. This pattern is based on just one week of data, though, so we’ll have to see what next week’s numbers show.
Wastewater data from the CDC and WastewaterSCAN similarly show continued increases in COVID-19 spread. Some counties in Southern states, such as Florida, Georgia, and Alabama, are reporting particularly large upticks. Hawaii may be a state to watch, too, as residents face health access challenges following the recent wildfires.
Test positivity also continues to increase, with the CDC reporting that about 12% of COVID-19 tests reported to its respiratory network returned positive results in the week ending August 16. Hospital admissions and emergency department visits are still going up as well, though these metrics are reported with two-week delays.
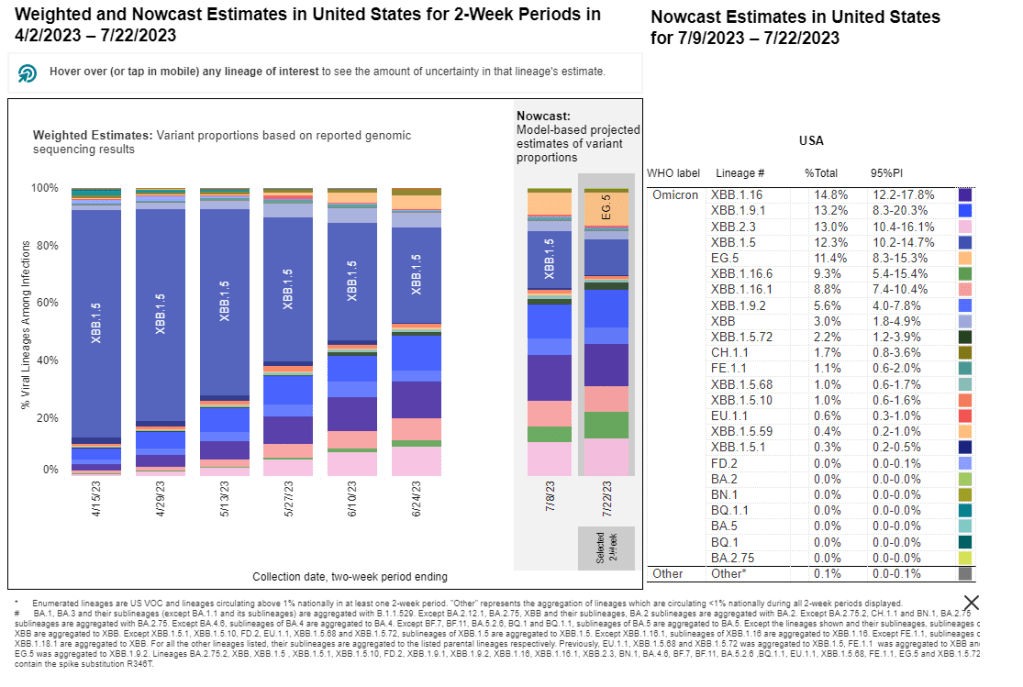
The CDC updated its variant data this week, reporting that Omicron EG.5 continues to outcompete other XBB lineages. EG.5 doesn’t have a huge advantage in transmission, though, so it’s increasing relatively slowly amid a sea of other similar variants.
But a new variant, called BA.2.86, may be one to watch more closely. Health officials are on the alert after seeing just a few cases in the U.S., Israel, and Denmark due to a number of mutations in this variant’s spike protein, which diverge significantly from other strains. (More on this variant later in today’s issue.)
While the CDC says it’s monitoring this new variant, the agency’s genomic surveillance is far sparser than it was a year or two ago. The agency and its research partners are now sequencing under 5,000 coronavirus samples a week, compared to almost 100,000 a week at the height of Omicron. With this small sample pool, the CDC is less equipped to catch BA.2.86, or any other variants that may arise.
-
Sources and updates, August 13
- CDC identifies continued Long COVID risk: A new study from the CDC this week, published in the agency’s Morbidity and Mortality Weekly Report, summarizes data from the CDC and Census Household Pulse Survey examining Long COVID prevalence in the U.S. According to the survey, Long COVID prevalence declined slightly from summer 2022 to early 2023, but has remained consistent this year at about 6% of all U.S. adults. The survey also found that about one in four adults with Long COVID consistently report “significant activity limitations” from the condition, meaning they are less able to work and participate in other aspects of daily life. Treating Long COVID and supporting long-haulers should be priorities for the healthcare system, the study’s authors write.
- Mitochondrial dysfunction in Long COVID: Another new paper, published this week in Science Translational Medicine, demonstrates the role that mitochondria may play in Long COVID. Researchers at the Children’s Hospital of Philadelphia studied tissue samples from autopsies and animals infected with COVID-19, finding that the coronavirus led to malfunctioning mitochondria in several key organ systems. These malfunctions may contribute to Long COVID symptoms such as fatigue and brain fog, and could be a target for future treatments. Elizabeth Cooney at STAT News covered the study in more detail.
- Benefits of vaccination during pregnancy: One more notable new study: researchers at the National Institute of Allergy and Infectious Diseases (or NIAID, part of the NIH) tracked the impacts of COVID-19 vaccination for pregnant people. The study included 240 vaccinated participants who contributed blood samples, between July 2021 through January 2022. Both the parents and their newborns developed antibodies against the coronvirus following infection, the researchers found. While previous papers have demonstrated the value of vaccination for new parents, this study is one of the largest so far to show that protection is conferred to newborns.
- Wastewater surveillance webinar from the People’s CDC: If you’ve been following wastewater data to keep up with COVID-19 trends but have had questions about how this form of surveillance works, you may find it helpful to watch this recorded webinar from health advocacy organization the People’s CDC. In the video, Marc Johnson, a professor at the University of Missouri and director of the state’s wastewater surveillance program, talks through how wastewater is tested for the coronavirus (and variants), how to interpret wastewater data, cryptic lineages, and more. Understanding this novel data source is increasingly important now, as traditional healthcare data on COVID-19 are less reliable.
- New federal heat surveillance dashboard: Finally, in other public health news, the federal government has launched a new dashboard to track heat-related health issues. The dashboard compiles data from Emergency Medical Services reports across the country, representing responses to 911 calls for any health reason related to heat stress. (You can see the list of potential health events in the dashboard’s documentation.) Currently, many southern states are experiencing high levels of heat-related health problems, according to the dashboard. Many of the same states are also experiencing COVID-19 upticks right now—trends that may be related, as more people gather inside during hot weather.
-
National numbers, August 13

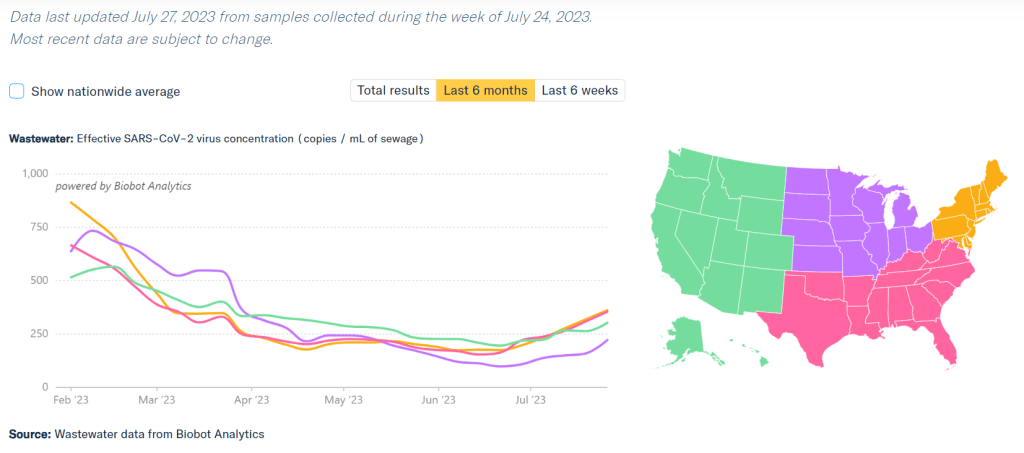
Wastewater data from Biobot Analytics suggest that coronavirus levels in the Northeast and South may be leveling off, while the Midwest is seeing a major spike. During the most recent week of data available (July 23 through 29), the U.S. reported about 9,000 new COVID-19 patients admitted to hospitals, according to the CDC. This amounts to:
- An average of 1,300 new admissions each day
- 2.8 total admissions for every 100,000 Americans
- 13% more new admissions than the prior week (July 16-22)
Additionally, the U.S. reported:
- 10.6% of tests in the CDC’s surveillance network came back positive
- A 9% higher concentration of SARS-CoV-2 in wastewater than last week (as of August 9, per Biobot’s dashboard)
- 31% of new cases are caused by Omicron XBB.1.6; 17% by EG.5; 11% by XBB.2.3; 10% by XBB.1.9 (as of August 5)
All major COVID-19 metrics continue to increase in the U.S., as we deal with a late-summer surge. Wastewater surveillance suggests that current virus spread is on pace with the Delta surge in 2021, though other data sources are less reliable these days.
Wastewater data from Biobot continue to show an uptick nationally, following the same upward trend that started in late June. The CDC’s wastewater surveillance system and WastewaterSCAN network report similar trends.
Biobot’s regional data suggest that the Northeast and South, the first two regions to see COVID-19 increases this summer, might be approaching their peaks, but it’s too early to say for sure. Regional test positivity numbers, from the CDC, show no sign of slowing their rise.
Meanwhile, COVID-19 spread is going way up in the Midwest, per Biobot and WastewaterSCAN. Some sewersheds in Iowa, Michigan, Ohio, and nearby states have reported their viral levels in wastewater more than doubling over the last couple of weeks.
Test positivity nationwide is now over 10%, per the latest data from the CDC’s respiratory virus testing network. Walgreens’ COVID-19 dashboard, which displays testing data from its pharmacies (i.e. a smaller sample size than the CDC network), reports a record high: of about 2,400 COVID-19 tests conducted in the week ending August 6, 45% were positive.
Hospital admissions for COVID-19 are also on the rise, with about 1,300 new hospitalizations for COVID-19 each day in the week ending July 29, per the CDC. While it’s true that these numbers are far lower than peaks during prior surges, the data are also less reliable now— with fewer hospitals reporting to the CDC and fewer measures in those hospitals (like masking) to control infections.
A lot of articles in the last couple of weeks have connected the recent surge to EG.5, the latest Omicron subvariant gaining ground in the U.S. However, this variant is not necessarily causing the surge; it doesn’t seem to be meaningfully more contagious or more severe than other recent strains, scientists are finding.
Rather than a variant, I would personally attribute this surge to summer travel and gatherings, combined with waning immunity—it’s been many months since most Americans had contact with the virus through vaccination or infection.
All of the virus-spreading activities going on right now will give SARS-CoV-2 more avenues to mutate. And there are other variants circulating globally that could cause more problems in the U.S. as well, as Eric Topol outlines in a recent Substack post. The next booster can’t come soon enough.
-
Sources and updates, July 30
- New papers show wastewater’s predictive value: This week, I noted three recently-published papers that all demonstrate wastewater surveillance’s value for flagging changes in COVID-19 trends before other metrics, such as hospitalizations. One paper, in Nature, found that wastewater trends preempted hospitalization trends by one to four weeks, in 150 U.S. counties. Another paper, in JAMA Network Open, found that wastewater trends tracked with case trends in 268 U.S. counties from January through September 2022; however, the correlation became weaker with reduced clinical testing over time. And a third paper, in PNAS, shares an algorithm that can flag community-level COVID-19 surges before they show up in other metrics, using data from North Carolina’s wastewater surveillance.
- Long COVID’s impact on employment: The Urban Institute, a think tank focused on economic and social policy research, published a report exploring employment challenges and related hardships among people with Long COVID. The researchers (a group that included Lisa McCorkell from the Patient-Led Research Collaborative) analyzed results from Long COVID questions included in an Urban Institute survey, conducted among more than 7,500 American adults across the country in December 2022. Among the findings: 10% of adults with Long COVID stopped working for a period due to their symptoms while another 5% reduced their work hours; 24% limited activities outside of work; 42% reported food insecurity in the last year; 20% reported difficulty paying their rent or mortgage.
- Characterizing potential Long COVID phenotypes: Another Long COVID study from this week, published in The Lancet: a research consortium including several medical centers across Europe tracked patients over time, seeking to better understand different subtypes of the condition. The study included about 1,000 people with at least one Long COVID symptom, tracked over one year from their initial COVID-19 diagnosis. Researchers found four potential subtypes: one similar to ME/CFS (including fatigue and cognitive symptoms), one with respiratory symptoms, one with chronic pain, and one with changes to taste and smell. The researchers also noted some patient characteristics and aspects of acute illness that may contribute to increased risk of different subtypes.
- Outdoor transmission at a night market: One more notable new paper: researchers at local health agencies in China’s Zhejiang province reported on coronavirus transmission at an outdoor night market, in Frontiers in Public Health. In one day at the night market, three infected visitors led to 131 secondary cases, the researchers found. Based on samples from both people at the market and surfaces, the researchers estimated that particles of an Omicron BA.5 strain could linger for over an hour and still be contagious. The study suggests that, even in outdoor settings, transmission is still possible when other precautions aren’t taken.
- Acute Hospital at Home data: The Data Liberation Project, which collects and shares data from public records requests, recently published a dataset from a COVID-era program by the Centers for Medicare and Medicaid Services (CMS) which allowed hospitals to treat patients in their homes. Early this year, the project filed a FOIA request for data indicating which hospitals applied to participate in the program and how their patients fared. CMS completed the request in June, and DLP is working to process and understand the resulting data. If you’re interested in using the data, you can check out the documentation and sign up for updates.
- Diagnosis challenges with alpha-gal syndrome: Finally, a bit of non-COVID public health news: the CDC recently released some data showing challenges with diagnosing alpha-gal syndrome—a disease transmitted by tick bites that leads to new allergies—despite recent increases in its spread. The CDC estimates that up to 450,000 people in the U.S. may have been impacted by this disease, potentially developing new allergies to meat and other animal products. Yet in one CDC study, the majority of health providers surveyed were not confident in their ability to diagnose the syndrome. This trend reflects similar challenges for other chronic diseases that might be new or unfamiliar to providers, such as Long COVID.
-
National numbers, July 30

COVID-19 is spreading more in all regions of the country, according to Biobot’s data. Data as of July 27, based on samples collected the week of July 24. During the most recent week of data available (July 9 through 15), the U.S. reported about 7,100 new COVID-19 patients admitted to hospitals, according to the CDC. This amounts to:
- An average of 1,000 new admissions each day
- 2.2 total admissions for every 100,000 Americans
- 10% more new admissions than the prior week (July 2-8)
Additionally, the U.S. reported:
- 7.6% of tests in the CDC’s surveillance network came back positive
- A 17% higher concentration of SARS-CoV-2 in wastewater than last week (as of July 26, per Biobot’s dashboard)
- 24% of new cases are caused by Omicron XBB.1.6; 19% by XBB.1.9; 13% by XBB.2.3 (as of July 22)
Several major metrics continue to point to a summer increase in COVID-19 spread. Coronavirus levels in wastewater are up in all major regions, as is test positivity from the CDC’s network. Hospitalizations have started ticking up as well.
Nationally, coronavirus levels in wastewater have doubled in the last month, according to Biobot Analytics. Viral levels are on par with this period in summer 2021, at the start of that year’s Delta surge, and are the highest they’ve been since this year’s holiday surge concluded.
Data from the WastewaterSCAN network similarly shows COVID-19 upticks in the last month, though the team’s latest national update notes that current levels are still low compared to the start of 2023. WastewaterSCAN recently added national wastewater levels to its dashboard, making it easier to track broad trends from this sewage testing network.
Test positivity data from the CDC’s respiratory lab network are still increasing as well. National test positivity was 7.6% in the week ending July 22, compared to 4.5% about a month ago, an increase of about 70%.
The CDC’s hospitalization data are also showing an increase now: new COVID-19 patients admitted to hospitals went up by about 10% from the week ending July 8 to the week ending July 15. These are the most recent hospitalization numbers available, as the CDC is still reporting this metric with a delay.
Wastewater and positivity data suggest that COVID-19 spread is increasing in all major regions of the country. All regions are also dealing with the virus’ continued evolution, as a variety of XBB lineages circulate and compete with each other.
Several national publications reported on these COVID-19 increases in the last week, pointing to the potential for a summer surge. I personally liked this article from Dylan Scott at Vox, which also covers implications for COVID-19 this winter.
But the COVID-19 Data Dispatch was on this potential surge weeks before any mainstream media news site. If you appreciate our early warnings, please donate to support this work!
-
National numbers, July 23

A wide variety of XBB-related Omicron variants are competing across the U.S. Data from the CDC, as of July 22. During the most recent week of data available (July 2 through 8), the U.S. reported about 6,200 new COVID-19 patients admitted to hospitals, according to the CDC. This amounts to:
- An average of 900 new admissions each day
- 1.9 total admissions for every 100,000 Americans
- 1% fewer new admissions than the prior week (June 25-July 1)
Additionally, the U.S. reported:
- 6.3% of tests in the CDC’s surveillance network came back positive
- A 9% higher concentration of SARS-CoV-2 in wastewater than last week (as of July 19, per Biobot’s dashboard)
- 24% of new cases are caused by Omicron XBB.1.6; 19% by XBB.1.9; 13% by XBB.2.3 (as of July 22)
COVID-19 data in the U.S. is showing increasingly clear signs of a summer surge, with infections rising across the country. However, thanks to the federal public health emergency’s end, we have less and less data to track this trend.
Wastewater data from Biobot Analytics show that national coronavirus levels have gone up by about 68% in the last month. Current levels are far below this time last year (when the Omicron BA.4/BA.5 surge was in full swing), but still at their highest in several months.
Biobot’s regional data suggest that the COVID-19 uptick is hitting all major regions. But the increases have been most pronounced in the Northeast and South; coronavirus levels have doubled in both regions in the last month, per Biobot.
The CDC’s wastewater surveillance network has picked up these increases as well, with more than half of testing sites in this network (with recent data) reporting coronavirus upticks in the last two weeks. Some major cities, such as Boston and Los Angeles, are also reflecting the increase.
Test positivity data from the CDC also show the increasing COVID-19 spread: nationally, test positivity from the labs in the agency’s surveillance network has gone up from 4.3% one month ago to 6.3% in the most recent week of data. The most prominent increases for this metric are similarly in the Northeast and South, and in the health region including Oregon, Washington, Idaho, and Alaska.
One metric not yet showing an increase is the CDC’s hospital admissions data. But the agency has continued to report these data with a lag: as of today, the most recent hospitalization numbers are as of July 8, two weeks ago. The CDC has yet to provide a clear explanation for this reporting lag.
Either way, the data we do have give us sufficient warnings about this summer’s uptick in COVID-19 spread. One likely culprit is the continued evolution of Omicron XBB: about 15 different subvariants are currently competing, according to the CDC’s latest data. No variant seems to be a clear winner yet.
Regardless of which variant comes to dominate next, the same safety measures continue to work against COVID-19.
-
Sources and updates, July 16
- Real-time detection of coronavirus in the air: A new study, published this week in Nature Communications, describes a tool to detect airborne SARS-CoV-2 particles. Researchers at Washington University in St. Louis developed this tool; it works by collecting aerosols in a container and screening them for chemical properties matching the coronavirus spike protein. In the researcher’s proof-of-concept study, the detector tool was able to detect coronavirus particles with 77% to 83% accuracy, and could detect the virus when it was present at relatively small volumes. If the tool holds up to further tests, it could be valuable for monitoring healthcare settings and other public places.
- Routine respiratory virus testing at K-12 schools: Another study about testing, published in the CDC’s Morbidity and Mortality Weekly Report: researchers in Kansas City, Missouri regularly tested students and staff members at the public school district for SARS-CoV-2, the flu, RSV, and several other common respiratory viruses. About 900 participants opted into monthly testing for the 2022-23 school year, for a total of 3,200 tests conducted. Overall, about one in four tests were positive for at least one respiratory virus. Pre-K students had the highest positivity rate (40%), while rhinovirus/enterovirus was most commonly detected. The study shows how many viruses are going around in school settings, as well as the potential value of testing for reducing spread.
- Predicting COVID-19 activity with Google searches: COVID-19 data commentators have long suspected that online trends indicating people were losing their sense of smell or taste in large numbers could predict an upcoming surge. (Remember the Yankee Candle Index?) Well, a new study in the CDC’s Emerging Infectious Diseases journal provides some evidence for this pattern. Researchers at Yale and Columbia Universities compared Google search trends for “loss of smell” and “loss of taste” to COVID-19 hospitalization and death numbers in five countries. They found a strong correlation between these searches and COVID-19 increases for major COVID-19 waves. So, even as official data become less available, online trends may still be a good indicator.
- Estimating infection rates from mortality data: COVID-19 mortality data can be used to work backward and estimate true infection rates, according to a new paper in Science by researchers at the University of California Davis and the University of the Basque Country (in Spain). The scientists used a machine learning model to analyze death reports from several European countries, essentially predicting infection rates in reverse. Their analysis found that lockdowns and mask requirements, among other COVID-19 safety measures, had a major impact on transmission, one of the authors said in a press release. Mortality data continues to present a useful tool for tracking COVID-19’s full impact.
- Long COVID cohort study suggests full recovery may be rare: One more notable new study, shared by The Lancet as a preprint: researchers at a hospital in Barcelona shared the results of a study following Long COVID patients for two years. The study followed 548 people, including 341 with Long COVID and 207 who did not have long-term symptoms after acute COVID-19. Only 26 (7.6%) of the Long COVID patients recovered during the two-year follow-up period, according to symptom surveys and diagnostic testing. Hannah Davis, a patient-researcher at the Patient-Led Research Collaborative, shared additional highlights and takeaways from the study in a Twitter thread.
- New bill to strengthen wastewater surveillance: Finally, a bit of hopeful news: three U.S. senators just introduced a bipartisan bill that would strengthen the CDC’s National Wastewater Surveillance System (NWSS). The bill would specifically expand NWSS to include surveillance for other public health threats, and would enable it to provide more funding to state and local health agencies. Cory Booker from New Jersey, Angus King from Maine, and Mitt Romney from Utah are the three sponsors. I’m not a political reporter, so I won’t pretend to know how likely this bill’s chances are of passing, but I hope it’s a step toward making the U.S.’s wastewater surveillance infrastructure permanent.
Editor’s note, July 23, 2023: An earlier version of this post misstated the virus most commonly detected in the Kansas City schools study. (It was rhinovirus/enterovirus, not RSV.)
-
National numbers, July 16

Wastewater surveillance data from Biobot indicate that three out of four major U.S. regions are experiencing increased COVID-19 spread. In the past week (July 2 through 8), the CDC did not update COVID-19 hospitalization data for unclear reasons. During the most recent week of data available (June 25 through July 1), the U.S. reported about 6,200 new COVID-19 patients admitted to hospitals, according to the CDC. This amounts to:
- An average of 900 new admissions each day
- 1.9 total admissions for every 100,000 Americans
- 1% fewer new admissions than the prior week (June 18-24)
Additionally, the U.S. reported:
- 5.5% of tests in the CDC’s surveillance network came back positive
- A 13% higher concentration of SARS-CoV-2 in wastewater than last week (as of July 12, per Biobot’s dashboard)
- 32% of new cases are caused by Omicron XBB.1.6; 15% by XBB.1.9; 13% by XBB.2.3 (as of July 8)
National COVID-19 data are showing signs of a summer uptick in infections across multiple regions. Newer variants, summer travel, and holidays are likely contributing to this increase, though it’s hard to say if we will see a real surge or a continued shifting of the U.S.’s high COVID-19 baseline.
Wastewater surveillance data from Biobot Analytics show a significant uptick in coronavirus levels over the last month, with an increase of about 50% from June 14 to July 12. Three out of four major U.S. regions (the Northeast, South, and West Coast) report notable increases, while the Midwest reports a slower uptick.
The CDC’s National Wastewater Surveillance System (NWSS) is not yet showing a pronounced increase. Of the testing sites in this network that reported data in the last two weeks, about half reported upticks while the others reported declines or plateaus. However, NWSS data tend to be updated on a more delayed schedule than Biobot’s dashboard, since the CDC compiles information from a number of state and local health agencies.
As epidemiologist Caitlin Rivers points out in her Substack post describing the wastewater trend, COVID-19 summer waves in the U.S. tend to start in the South. Some experts attribute this to more indoor summer activities in the region, but there’s little data to back this up, Rivers writes. Plus, this year, the summer uptick has appeared to start in multiple regions of the country at the same time.
In addition to the wastewater data, test positivity data from the CDCs National Respiratory and Enteric Virus Surveillance System (NREVSS) show a similar uptick in the last month: from 4.1% of COVID-19 tests returning positive results in the week ending June 10 to 5.5% in the week ending July 8. Remember, this NREVSS doesn’t share data from all PCR tests done in the U.S. (as the CDC no longer has authority to collect this information); but it is set up to provide national and regional estimates.
According to NREVSS, COVID-19 test positivity is going up in several major regions, including New York and New Jersey, the Mid-Atlantic, the South, the Gulf Coast, and the Northwest. All of these regions are dealing with the Omicron XBB variant’s continued evolution; in the CDC’s most recent variant update on July 8, the agency listed 12 different XBB subvariants competing for hosts.
The CDC failed to update its COVID-19 hospitalization data this week, so the most recent available data are from the week ending July 1. Typically, the agency’s data scientists will add notes to their dashboard explaining update delays or errors, but this week, I couldn’t find anything.
As I wrote on June 25: sometimes, I wonder if the CDC doesn’t think anyone is checking their dashboard anymore. But we are! COVID-19 data may be more limited than ever, but we still have enough information to know when cases are ticking up again—and we know the measures needed to protect ourselves and our communities.
-
National numbers, June 25

Wastewater data from Boston show some small increases and decreases in transmission this spring, reflecting our uncertain baseline. In the past week (June 11 through 17), the CDC did not update COVID-19 hospitalization data due to changes in its reporting process.
During the most recent week of data available (June 4 through 10), the U.S. reported about 6,600 new COVID-19 patients admitted to hospitals, according to the CDC. This amounts to:
- An average of 950 new admissions each day
- 2.0 total admissions for every 100,000 Americans
- 8% fewer new admissions than the prior week (May 28-June 3)
Additionally, the U.S. reported:
- 4.0% of tests in the CDC’s surveillance network came back positive
- A 16% lower concentration of SARS-CoV-2 in wastewater than last week (as of June 21, per Biobot’s dashboard)
- 30% of new cases are caused by Omicron XBB.1.6; 24% by XBB.1.9; 11% by XBB.2.3 (as of June 24)
The CDC failed to update its primary COVID-19 metrics this week, so I have no national updates to share about hospital admissions, deaths, or test positivity. The most recent available data from the agency and wastewater surveillance sources suggest that the U.S. is still experiencing a transmission plateau.
According to the CDC’s dashboard, the agency didn’t update its hospitalization data “due to a change in required reporting cadence from daily to weekly,” following the end of the public health emergency in May. The dashboard note is a bit unclear, but I’m assuming this refers to a change in requirements for state public health departments reporting to the CDC, as the national agency lost its authority to require daily data reporting when the PHE ended.
Still, it’s confusing to me that the CDC’s dashboard note only refers to hospitalization data, because deaths, test positivity, and other metrics also weren’t updated this week. These data points don’t rely on state reporting systems, so they shouldn’t be impacted by the reporting change.
Either the note is incomplete, or the CDC staff in charge of this dashboard took an issue with one metric as an excuse not to update several metrics. I don’t love the outcome either way. Like, do they think nobody is checking this dashboard? Because we still are.
Anyway, the CDC’s most recent data (from the week of June 10, now about three weeks ago), suggested that the U.S. was in a continued COVID-19 plateau, with hospital admissions and test positivity from the CDC’s surveillance network declining very slightly.
Wastewater data from Biobot Analytics indicates a similar plateau at the national level. Regionally, the Northeast and West coast experienced slight upticks in COVID-19 spread in the last few weeks, but the coronavirus levels in their wastewater now appear to be trending back down. (These are small changes, though, compared to what we’ve seen in past surges.)
The sewage in Boston and New York City, two large Northeast cities that are often bellwethers for larger COVID-19 trends, similarly slow slight viral increases in May followed by downturns in June. NYC data are delayed by up to two weeks, though, so take this with a grain of salt.
The CDC did update its variant estimates this week, showing that XBB.1.5 is now causing less than one-third of cases nationwide. XBB.1.6 and its relatives are now the most popular lineages in the U.S., causing a combined 30% of new cases in the two weeks ending June 24. Other XBB variants, including XBB.1.6 and XBB.2.3, are also on the rise.
As health agencies put fewer and fewer resources into tracking COVID-19, the data we still have show continued severe ramifications for this disease’s unchecked spread. This disease still kills over 100 people per day.
