Two quick updates about the CDC’s surveillance efforts for COVID-19 and other diseases:
The CDC has provided a short-term wastewater surveillance contract to Verily, the biotech company that’s affiliated with Google, so that data collection can continue at about 400 sewage testing sites while a longer-term contract is in dispute. This temporary measure will help keep up surveillance during the winter respiratory virus season, though Verily still has a lot of logistical work ahead to actually start testing at sites where another company, Biobot Analytics, was previously in charge. (Verily will need to contact the sites, send them equipment, set up sample collection procedures, etc.) The CDC’s National Wastewater Surveillance System is also working on an updated COVID-19 dashboard, according to POLITICO’s story about the short-term contract. For more context, see my coverage of the contract switch and POLITICO’s previous reporting.
The CDC is expanding its testing program for international travelers arriving at U.S. airports, in a three-month pilot program for the winter virus season. This program, called the Traveler-Based Genomic Surveillance program, has screened travelers for coronavirus variants over the last two years, primarily using PCR tests among travelers who volunteer for a nasal swab. This winter’s pilot program expands surveillance in two ways: adding about 30 testing targets (including flu, RSV, other common diseases, and markers of antimicrobial resistance), and adding wastewater testing at three airports. One airport, San Francisco’s international airport, was already providing samples from plane sewage. See my article in Science News for more details.
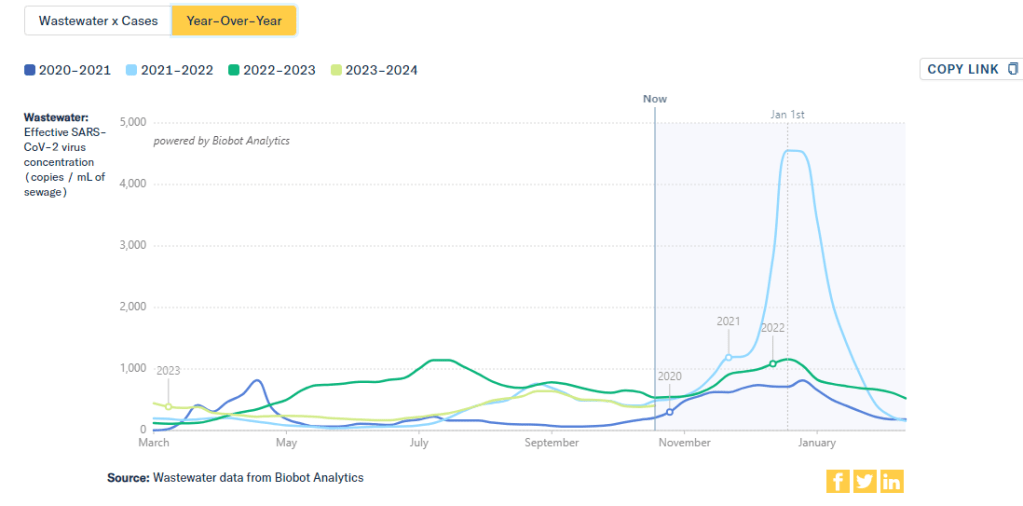
This chart from Biobot Analytics shows that current coronavirus levels in wastewater (the light green line) have followed a similar pattern to fall 2021 (light blue).
The U.S. is heading into our first winter since the end of the federal public health emergency for COVID-19. Those of us still following COVID-19 trends might need to change which data sources we use to track the disease this winter, and how we think about trends.
The pandemic certainly hasn’t ended: COVID-19 still leads to hundreds of hospitalizations and deaths each day, not to mention millions with Long COVID. Since the U.S. government ended its emergency response to this disease, we now have significantly less information—but not zero information—about how it’s spreading.
The CDC is no longer collecting case data, as it lost authority to require reporting from PCR testing labs.
Following the CDC’s lead, many state and local health departments have also stopped tracking COVID-19 cases.
The CDC is still tracking COVID-19 hospitalizations, though these data are more delayed and less comprehensive following the PHE’s end.
Death reporting is also more delayed and less comprehensive.
The CDC is using networks of testing labs and healthcare centers (like the National Respiratory and Enteric Virus Surveillance System) to estimate COVID-19 trends, similar to its strategies for tracking flu and RSV.
To track variants, the CDC is relying on a mix of continued PCR samples, wastewater testing, and travel surveillance.
In short, we lost a few of the primary data sources that people have used to follow COVID-19 over the last three years. But there’s still a lot of data available, primarily from wastewater surveillance, the CDC’s sentinel networks, and local health agencies.
Here are my tips for tracking COVID-19 this winter.
Look at multiple sources for your community.
Following COVID-19 in your city or state used to be easy: you could just look at case numbers. Now, with that metric unavailable in many places, I would recommend having two or three go-to data sources that you check in tandem. Don’t be certain about a trend (like a new surge) until you’ve seen it in multiple sources at once. These sources might be local wastewater pages, local health department pages, and regional trends from the CDC.
For example, when I want to check on COVID-19 spread in New York City (where I live), I look at:
It’s pretty universally acknowledged among epidemiologists and public health experts at this point in the pandemic that, without case data, wastewater surveillance is now our best way to spot new changes in COVID-19 spread. When a new surge occurs, coronavirus levels in wastewater tend to go up days or weeks before other metrics, like hospitalizations.
So, as you track COVID-19 for your community, I would highly recommend that one of your top sources is a wastewater surveillance dashboard.
In addition to local health dashboards, you might find an academic project near you that’s monitoring wastewater. Check the COVIDPoops19 dashboard for a more comprehensive repository of wastewater surveillance projects.
Test positivity is still helpful for trends.
Test positivity—the rate of COVID-19 tests that returned positive results—was a popular indicator early in the pandemic, with policy decisions like whether students could attend school in-person tied to this metric. While test positivity numbers are less available now, people are still getting tested for COVID-19: these tests mostly occur in healthcare settings among people who present with COVID-like symptoms or had recent exposures to the virus.
I still find test positivity to be a helpful metric for watching trends in COVID-19 spread. When the positivity rate goes up, more people are getting COVID-19; and when the rate goes over 10%, that’s a decent indicator that the disease is spreading in significant magnitudes.
Two places to find test positivity data:
The CDC’s COVID-19 trends page provides positivity data for the U.S. as a whole and HHS regions, based on one of the agency’s respiratory virus surveillance networks;
Acknowledge data delays, especially around holidays.
Many COVID-19 dashboards used to update on a daily basis. Now, we get weekly updates from most health agencies—and even less frequency in some places. With these update schedules, all data are inevitably delayed by at least a few days. So, when you look at a dashboard, it’s important to keep the update schedule in mind and ask yourself how a trend might have continued following the most recent data available.
Data delays become particularly prominent after holidays: remember, public health officials take days off just like the rest of us. Holiday reporting delays often lead to appearances of low COVID-19 during the immediate week of a holiday, followed by appearances of higher COVID-19 in the weeks after as cases (and other metrics) are retroactively reported. The weeks around Christmas and New Year’s are particularly bad, as most people take both of those holidays off.
Compare current trends to past surges and lulls.
With interpreting COVID-19 data, context is everything. Spread of the virus is usually either rising or falling; comparing current numbers to historical data can help you understand the magnitude of those recent patterns. Is your community seeing as much COVID-19 as it has at past times commonly recognized as surges? Or are you in more of a lull between waves?
One helpful tool that I often use for such context is a chart on Biobot’s COVID-19 dashboard that provides year-over-year comparisons between coronavirus levels in wastewater in the U.S. Right now, for example, you can see that current viral levels have followed a similar trendline to what we observed in the fall 2021 Delta surge (before Omicron appeared), but lower than this time last year (when different BA variants were spreading quickly).
The original Omicron surge in winter 2021-22 is often a popular point for these comparisons, as pundits love to assure us that a new variant won’t cause as intense a wave as we saw with Omicron’s first appearance. While this can be reassuring, I think it’s important to not just look at the highest peaks for comparison. The summer/fall of Delta in 2021 wasn’t a great time either, and we’re on track to repeat it right now even if no wildly competitive new variants appear.
Keep an eye on variants.
As we watch for a likely COVID-19 surge this winter, viral variants could have an impact on how much the virus is able to spread during our holiday travel and gatherings. You can keep an eye on variant development through a couple of CDC data pages:
Variant patterns from wastewater, which the CDC and local health departments track from select sewage testing sites (many state and local wastewater dashboards include these data as well);
Travel-based genomic surveillance, a CDC program in which international travelers can opt into PCR testing as they return to U.S. airports, contributing to the agency’s understanding of variants circulating globally.
If you have further data tracking questions or suggestions, please reach out via email or in the comments below.
During the most recent week of data available (October 22-28), the U.S. reported about 15,700 new COVID-19 patients admitted to hospitals, according to the CDC. This amounts to:
An average of 2,200 new admissions each day
4.8 total admissions for every 100,000 Americans
0.1% more new admissions than the prior week (October 15-21)
Additionally, the U.S. reported:
9% of tests in the CDC’s surveillance network came back positive
A 6% higher concentration of SARS-CoV-2 in wastewater than the prior week (as of October 25, per Biobot’s dashboard)
25% of new cases are caused by Omicron HV.1, 22% by EG.5, 17% by XBB.1.6, 12% by FL.1.5.1 (as of October 28)
After an early-fall lull in COVID-19 transmission, there are now signs that the coronavirus is starting to spread more as we head into winter (or, respiratory virus season). This slight uptick is expected, but could still be prevented if we had better public health measures in place.
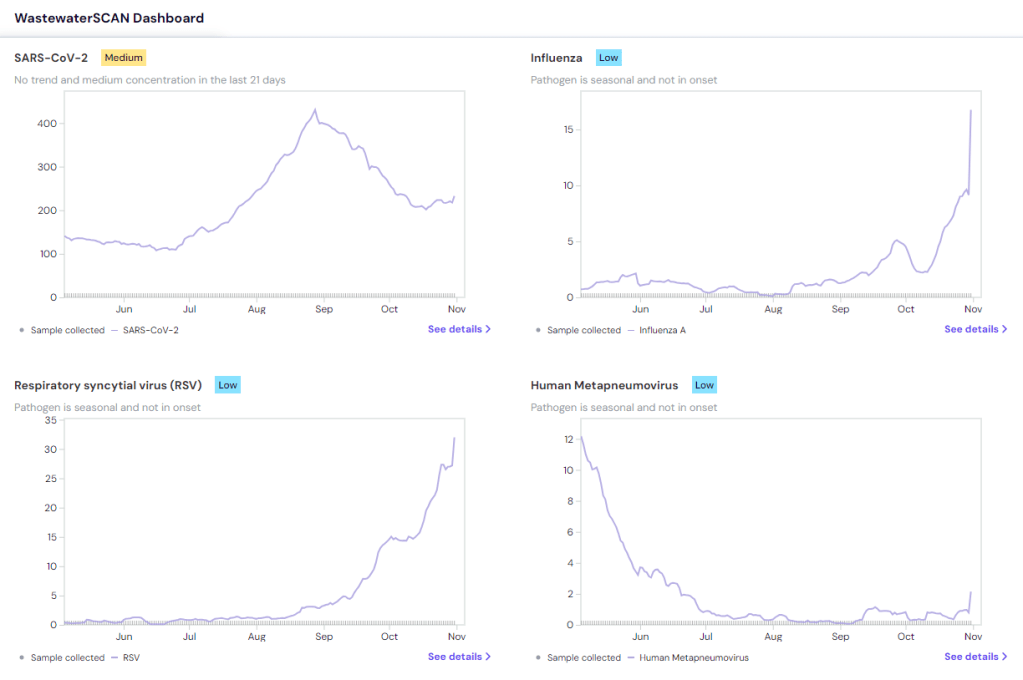
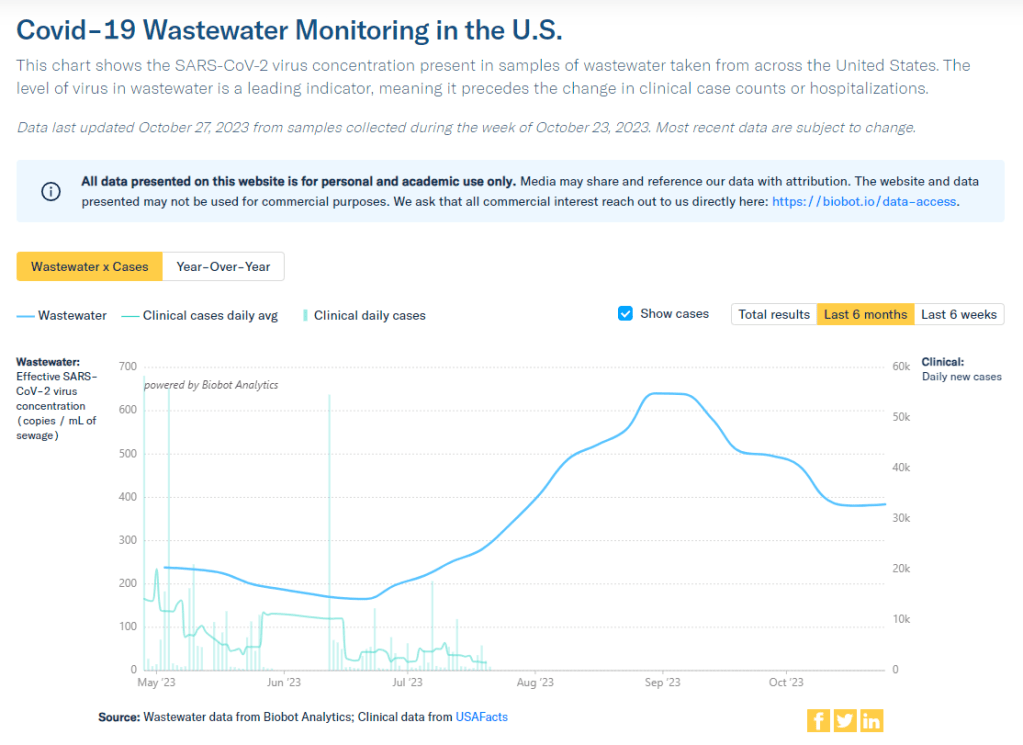
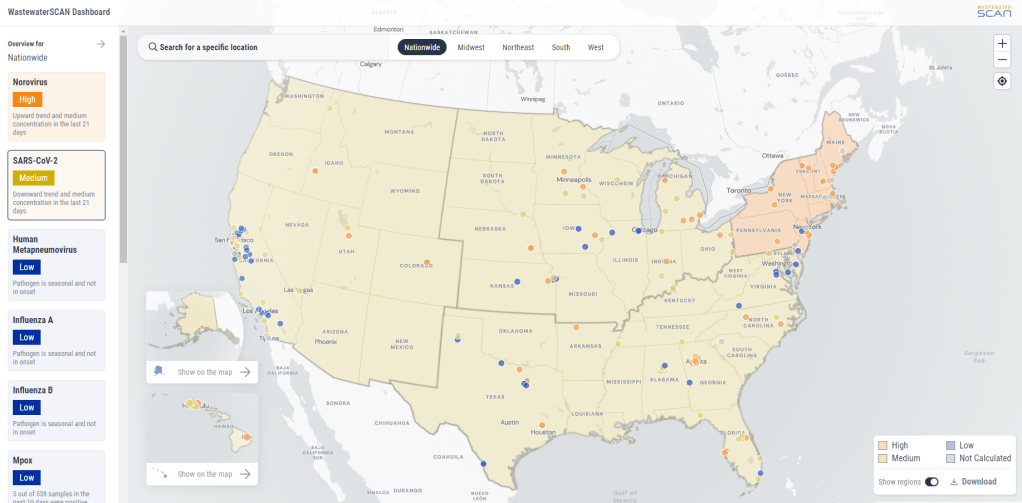
Wastewater surveillance data from both Biobot Analytics and WastewaterSCAN suggest that COVID-19 spread might be increasing again. Biobot’s dashboard shows a 6% increase in sewage coronavirus levels nationally between October 18 and October 25, the most recent week of data available.
WastewaterSCAN’s dashboard similarly shows a slight increase in coronavirus levels, as of October 30. Regional data from both sources suggest that the Northeast and Midwest are seeing more COVID-19 spread than other regions at the moment, though the South might catch up in the coming weeks.
As I’ve discussed over the last couple of weeks, we are currently working with limited wastewater surveillance data: 400 sewage testing sites, about one-quarter of the CDC’s wastewater network, are currently in limbo while government officials navigate a potential switch between testing contractors. (See last week’s National Numbers and my original coverage of the new contract.) Still, we have enough information to identify national trends from wastewater.
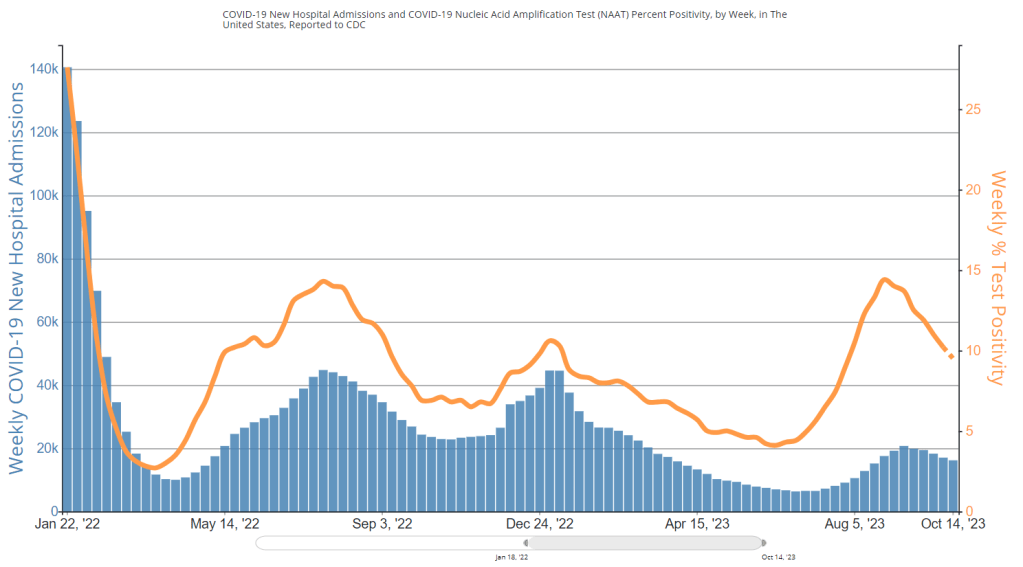
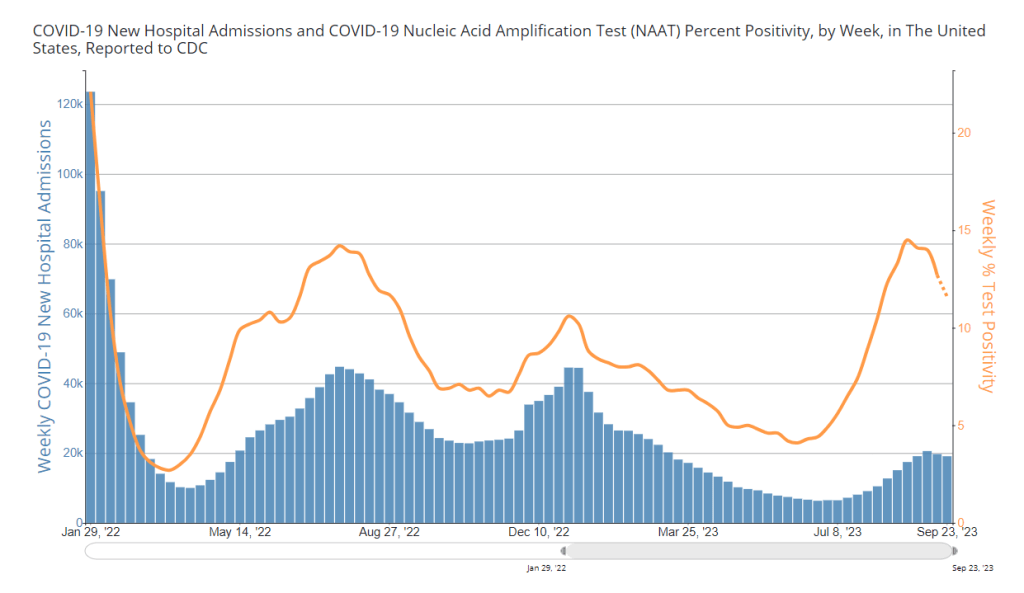
Along with the wastewater surveillance data, hospitalization data reported by the CDC show a very slight increase in COVID-19 patients as of October 28. Test positivity and emergency department visits have plateaued after declines over the course of October, as seen in both the CDC’s data and the Walgreens dashboard (which provides data from testing done at this pharmacy chain).
COVID-19 isn’t the only respiratory disease spreading right now. RSV transmission has picked up, according to the CDC’s surveillance: hospitalization rates for this disease have risen sharply over the last month. Similarly to last year, RSV appears to be reaching its peak earlier in the fall than health officials typically expect.
WastewaterSCAN’s data show RSV and flu spread ticking up, particularly in the South. This project’s data align with the CDC’s reports of influenza-like illness, which suggest southern states, Washington D.C., and Alaska now have moderate to high levels of people with flu-like symptoms, compared to low levels in the rest of the country.
While health experts are expecting a lot of respiratory virus spread this winter, these trends aren’t inevitable. All individual and collective measures towards public health—getting vaccinated, wearing masks, testing, prioritizing ventilation—help mitigate these diseases.
During the most recent week of data available (October 15-21), the U.S. reported about 16,200 new COVID-19 patients admitted to hospitals, according to the CDC. This amounts to:
An average of 2,300 new admissions each day
4.9 total admissions for every 100,000 Americans
0% fewer new admissions than the prior week (October 8-14)
Additionally, the U.S. reported:
8.7% of tests in the CDC’s surveillance network came back positive
A 1% higher concentration of SARS-CoV-2 in wastewater than the prior week (as of October 25, per Biobot’s dashboard)
25% of new cases are caused by Omicron HV.1, 22% by EG.5, 17% by XBB.1.6, 12% by FL.1.5.1 (as of October 28)
Our mid-fall COVID-19 lull continues in the U.S., with major metrics showing plateaus in disease spread nationally. A disruption in wastewater surveillance may make it harder to follow these trends in the coming weeks.
Biobot Analytics has resumed weekly updates to its COVID-19 dashboard as of this Friday. While the company is no longer testing about 400 sites in the CDC’s surveillance network due to a contract switch, its independent network still represents more than 100 counties across the U.S., according to Biobot’s Twitter.
Meanwhile, Biobot has filed a formal protest about the CDC contract change. According to reporting by POLITICO, the new contractor, Verily, cannot start testing at those 400 wastewater treatment sites while the Government Accountability Office (GAO) evaluates Biobot’s appeal. The protest will extend the data gap that I described in my previous posts about this contract, possibly delaying surveillance for months as we head into the winter respiratory virus season.
With these gaps in mind, here’s what the limited wastewater surveillance data tell us. Biobot’s national dashboard shows declines in coronavirus spread from mid-September through mid-October, followed by a very slight (1%) increase in the week ending October 25. Regionally, spread is down in the Northeast and West Coast and up slightly in the South and Midwest.
WastewaterSCAN’s latest update shows similar trends: a decline nationally in the last month, and recent upticks in the Midwest, South, and possibly West as well. There’s not a clear pattern as to which states are seeing more increases right now; it’s more of a slight uptick across the board, as the WWSCAN team describes the trend.
Test positivity and hospitalization data from the CDC also suggest lulls. New hospitalizations for COVID-19 have not changed significantly in the last couple of weeks, staying at about 2,300 per day. The variant picture is still dominated by versions of XBB; more on this below.
As we get further into respiratory virus season, COVID-19 is likely to join forces with other common pathogens to put pressure on the healthcare system, just like we saw last year. But the tools needed to control those viruses’ spread are less available than ever, with masks, tests, vaccines, and surveillance data all harder to find.
So far, just 12 million people have received this year’s COVID-19 vaccines, per CDC estimates. POLITICO reports that CDC Director Dr. Mandy Cohen considers this number “on track” for the year, suggesting the agency is unlikely to put more resources into making the shots accessible.
Two weeks ago I wrote an article explaining that the CDC has a new wastewater contract, essentially transferring responsibility for COVID-19 testing at hundreds of wastewater treatment plants across the country from Biobot Analytics to a company called Verily, which is affiliated with Google. In the time since that post, I have seen some other articles and social media posts alleging that, thanks to the contract change, Biobot will no longer be posting any COVID-19 data on their dashboard. This is inaccurate!
It is true that Biobot no longer has access to data from about 400 sites that were part of the CDC contract. But Biobot still has its own testing network separate from the CDC’s—which actually predated its contract with the agency—and which includes hundreds of other sites across the country that either have individual contracts with Biobot or are receiving free testing in exchange for sharing data.
Copying from my post two weeks ago: on Biobot’s dashboard, “County-level data won’t change. National and regional data will still be available, but are likely to be less comprehensive pictures of wastewater trends across the U.S., if I’m right about Biobot no longer including CDC contract sites in those visualizations.” In fact, Biobot updated its dashboard this past Friday and will resume weekly updates soon, after making some changes to its data processing systems, according to social media posts from the company.
Meanwhile, it is currently unclear how the new contract will impact data on the CDC’s wastewater dashboard as well as on Verily’s own dashboard. On the CDC dashboard, you can see that contract sites are not reporting wastewater data while they switch testing providers. Verily has a dashboard that currently shows data from WastewaterSCAN, a separate program that already uses Verily to test its samples; this dashboard hasn’t added CDC sites yet as far as I know.
I’m not sharing the inaccurate posts I mentioned to avoid giving them extra attention, but I wanted to provide this extra update in case any readers had seen those posts and were confused. Once again: Biobot is still sharing data, it’s just less comprehensive, and I would still recommend going to their dashboard for COVID-19 trends. In this era of fragmented surveillance, it’s always good to rely on multiple dashboards (eg. CDC, Biobot, WastewaterSCAN) rather than just one.
Test positivity has dipped below 10% for the first time since July, per CDC data.
During the most recent week of data available (October 8-14), the U.S. reported about 16,200 new COVID-19 patients admitted to hospitals, according to the CDC. This amounts to:
An average of 2,300 new admissions each day
4.9 total admissions for every 100,000 Americans
5% fewer new admissions than the prior week (October 1-7)
Additionally, the U.S. reported:
9.5% of tests in the CDC’s surveillance network came back positive
A 14% lower concentration of SARS-CoV-2 in wastewater than the prior week (as of October 11, per Biobot’s dashboard)
24% of new cases are caused by Omicron EG.5, 20% by XBB.1.6, 20% by HV.1, 14% by FL.1.5.1 (as of October 14)
Major metrics suggest the U.S. is still in a lull of COVID-19 spread, as we’ve seen decreases in wastewater levels and test positivity for several weeks. Transmission is still high, though, and it seems likely that cold weather will drive up COVID-19 as well as other respiratory viruses in the coming weeks.
Biobot updated its COVID-19 wastewater dashboard this week, showing a continued decline in national coronavirus levels (with a decrease of about 35% from early September through October 11). Regionally, the company reports an increase in transmission in the Midwest and decreases in other regions, though the Northeast still has the highest coronavirus levels.
WastewaterSCAN’s dashboard similarly shows a national decline in recent weeks, and higher coronavirus levels in the Northeast and Midwest compared to the West and South. Some Northeast and Midwest sewersheds in SCAN’s network, including those in Maine, New Hampshire, Iowa, and Michigan, have reported significant recent increases.
As we discuss wastewater data, it’s worth a reminder that the CDC’s new contract with Verily has disrupted the existing surveillance landscape. Verily is working on onboarding CDC contract sites, leading to data gaps on the CDC dashboard, while Biobot’s network of sites for its national visualizations has become less comprehensive.
COVID-19 test positivity, reported by the CDC’s respiratory virus testing network, is under 10% nationally for the first time since July. Northeast and Midwest regions report higher test positivity than the West and South. Hospital admissions for COVID-19 have plateaued as well.
Influenza-like activity is mostly low across the U.S., according to the CDC’s FluView network. Only Alaska and the Northern Mariana Islands report high levels as of the week ending October 14.
COVID-19 spread so far this fall is in line with the transmission levels we saw in fall 2021, during that year’s Delta surge, and a bit below last year’s levels, per Biobot. If we continue following these trends, we will be due for increased spread in November through the end of 2023.
During the most recent week of data available (October 1-7), the U.S. reported about 16,800 new COVID-19 patients admitted to hospitals, according to the CDC. This amounts to:
An average of 2,400 new admissions each day
5.1 total admissions for every 100,000 Americans
8% fewer new admissions than the prior week (September 24-30)
Additionally, the U.S. reported:
10.1% of tests in the CDC’s surveillance network came back positive
24% of new cases are caused by Omicron EG.5, 20% by XBB.1.6, 20% by HV.1, 14% by FL.1.5.1 (as of October 14)
COVID-19 data signals point to a continued lull in transmission across the U.S., ahead of likely increases as the weather gets colder. The Northeast is still reporting higher COVID-19 levels than other regions, according to wastewater and test positivity data.
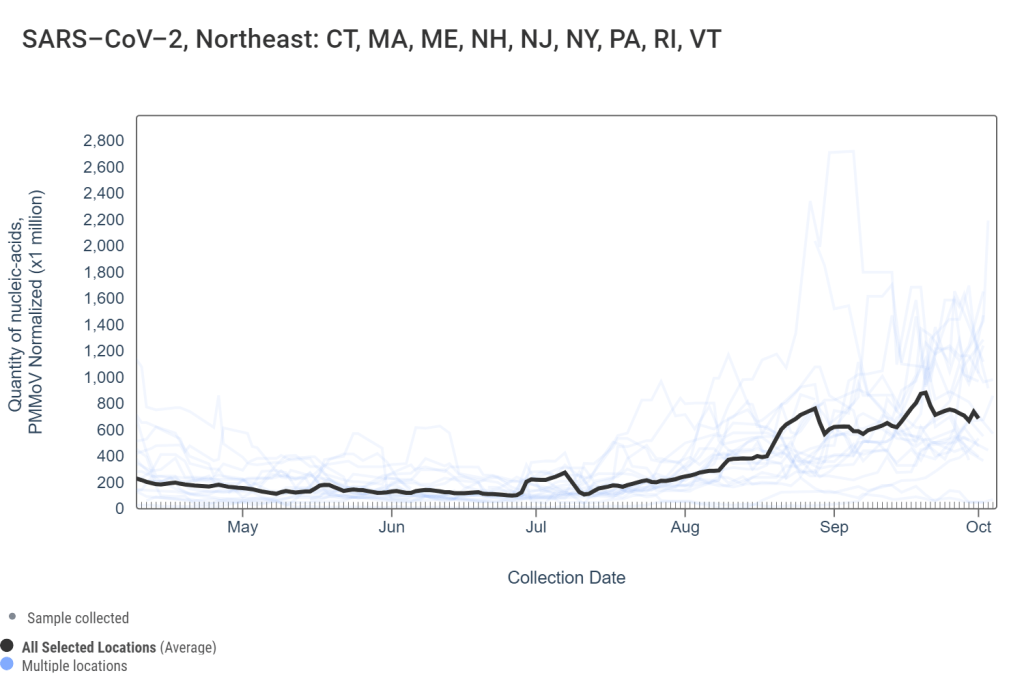
National wastewater surveillance patterns suggest that coronavirus spread is trending slightly downward, according to WastewaterSCAN’s dashboard. Viral levels are high in the Northeast and medium in the other major regions, per WastewaterSCAN’s metrics, with sites in Massachusetts, New York, Vermont, New Hampshire, and Maine reporting upticks.
Wastewater data from Boston and New York City similarly show recent coronavirus increases. As I noted last week, these Northeast cities are frequently the first sites of late fall/winter surges, as colder temperatures contribute to more indoor gatherings.
Biobot Analytics, typically one of my main sources of wastewater data, hasn’t updated its COVID-19 dashboard since October 2. The company is currently “making some improvements to [its] data infrastructure,” leading to less frequent updates at this time, a representative from Biobot wrote on Twitter last week. Data updates are planned on October 20 and November 3.
Biobot’s data infrastructure updates might be related to the CDC contract change (which I covered last week), though the Twitter post didn’t mention this specifically. The CDC’s wastewater dashboard, while missing updates from a couple hundred sites as they switch contractors, also shows higher COVID-19 spread in the Northeast.
The CDC’s test positivity data similarly report a continued lull at the national level: about 10% of tests in the agency’s lab testing network reported positive results in the week ending October 7, compared to a high of 15% in late August. Test positivity, like wastewater data, suggests higher spread in New England states and New York/New Jersey, as well as in some Midwest states, compared to other regions.
Variant surveillance by the CDC suggests that most cases in the U.S. are still caused by a variety of XBB.1.5 relatives: EG.5, HV.1, XBB.1.6, etc. This is a good time to get one of the updated COVID-19 vaccines, which are designed to target XBB.1.5, if you haven’t already. BA.2.86, a variant of interest that emerged a few weeks ago, hasn’t shown up in major numbers yet, but is beginning to appear in the CDC’s data and may drive more spread later in the fall.
Flu season has officially started, as of this week. Influenza-like illness (i.e. numbers of patients who go to their doctors’ offices with respiratory symptoms) is currently at lower levels than it was at this time last year, but is starting to “creep up,” Dr. Katelyn Jetelina wrote in a recent newsletter. Last year’s respiratory virus season “hit early and hard,” she said; we’ll see what happens this year.
Editor’s note, October 15: This article has been updated with comments from Verily.
This week, the CDC and life sciences company Verily announced that the agency awarded a five-year wastewater surveillance contract to Verily. The announcement marks a shift in the U.S. sewage monitoring landscape and will impact our public COVID-19 data, with short-term gaps and changing coverage in a couple of sources—but ultimate improvements in the long term.
First, some background:
In fall 2020, the CDC launched the National Wastewater Surveillance System (NWSS), a network of sewage testing sites around the country all reporting data to a central location. While some state and local health agencies quickly developed in-house systems for testing wastewater and reporting their data to NWSS, others lacked the resources (staff, lab capacity, data infrastructure, etc.) to start doing this new type of health surveillance.
As a result, the CDC began working with private testing companies to fill gaps in the NWSS network and expand surveillance more quickly across the country. The first contactor was a diagnostic company headquartered in Canada called LuminUltra. Then, last spring, the CDC awarded a contract to Biobot Analytics, a startup focused on wastewater surveillance. Biobot did a lot of work to extend the NWSS, helping bring the total CDC network up to nearly 1,400 sites; but the contractor switch initially led to a few weeks of missing data for about 150 sites covered by the CDC contract, as they transitioned from one set of testing protocols to another. (See my coverage at the time for more details.)
One advantage of Biobot working with the NWSS, if you’re someone who cares about public wastewater data, is that the company added data from many CDC contract sites to its COVID-19 wastewater dashboard, making that dashboard more comprehensive in its view of national COVID-19 patterns. You couldn’t view the CDC sites in Biobot’s county-level visualizations; those present data from other sites that have individual contracts with the company or are participating in the free Biobot Network program. But Biobot added CDC sites that opted into data-sharing to its national and regional visualizations, a company spokesperson told me last year.
What’s changing with the new contract:
Biobot’s contract with the CDC ended last month. The CDC’s new contract with Verily replaces it. Verily’s contract covers five years (as opposed to shorter periods for prior CDC wastewater testing contracts), and includes additions of more pathogens that may be tested through NWSS, in addition to SARS-CoV-2. These are both great improvements, adding to the surveillance system’s longevity and expanding its capacity beyond COVID-19—though additional federal funds will likely be needed past this contract.
However, in the short term, we will see data gaps on NWSS as contracted sites change over to Verily from Biobot. These testing sites may have to adjust how they collect samples, how they package and ship samples, and other logistical changes. The CDC NWSS dashboard already indicates a reporting dip in the last couple of weeks, coinciding with the contract change.
Meanwhile, Biobot will no longer have the same direct access to the CDC contract testing sites. While all the sites’ data will still be published publicly by the CDC, the Biobot-Verily switch will likely lead to changes in sample processing and analysis that make data from those sites no longer directly comparable with the hundreds of other sites covered by Biobot. My guess here is that Biobot may no longer be able to include the CDC contract sites in its national and regional visualizations.
I reached out to Biobot for comment about this shift, and haven’t heard back from them yet. I’ve also reached out to Verily asking about the contract changeover and any data-sharing plans they may have, and haven’t heard back there yet either. I will update this post with more details from the companies as I receive them.
How this new contract may impact major data sources:
CDC NWSS: Data from all sites participating in NWSS will continue to be available on the CDC’s dashboard, though the sites covered by the CDC’s national testing contract (previously with Biobot, now with Verily) may have missing data for a couple of weeks. NWSS continues to be the most comprehensive place to find wastewater data in the U.S., but unfortunately doesn’t share national or regional trends because it is compiling from many different testing programs with different methodologies.
Biobot Analytics: County-level data won’t change. National and regional data will still be available, but are likely to be less comprehensive pictures of wastewater trends across the U.S., if I’m right about Biobot no longer including CDC contract sites in those visualizations. Also worth noting, Biobot shifted its update schedule recently to once a week on Mondays (with a longer delay in data, but likely less retroactive updating).
WastewaterSCAN: No changes due to this contract switch, though WastewaterSCAN has been working with Verily for a while to test sewage samples from its network. This project also recently announced that it’s adding six more disease targets to its program: parainfluenza, rotavirus, adenovirus group F, enterovirus D68, Candida auris, and hepatitis A. See the statement from WastewaterSCAN below for more details.
In the long-term: The CDC’s new five-year contract will enable continued expansion of the NWSS, potentially with both more sites and more disease targets. I also expect public data offerings will continue to improve as scientists and public health officials learn more about how to interpret wastewater surveillance data.
Statement from WastewaterSCAN about the new contract
WastewaterSCAN was pleased to learn that the CDC selected Verily to support the National Wastewater Surveillance System (NWSS). As our lab partner, Verily has an important role managing sample collection logistics from wastewater treatment plants participating in the WastewaterSCAN network, processing samples, and supporting our research to advance the science of wastewater-based epidemiology.
WastewaterSCAN continues to demonstrate that wastewater monitoring can provide comprehensive, efficient, community-wide tracking of seasonal and emerging diseases. We recently added six disease targets to our program and are helping many communities prepare for the respiratory virus season with a public data dashboard to communicate what wastewater is telling us about the diseases circulating in our communities.
At this time, only data from our program will appear on WastewaterSCAN’s data dashboard. WastewaterSCAN will continue to make our methods public and to collaborate and share data with NWSS and contribute to its important, mission-critical work.
Statement from Verily, responding to COVID-19 Data Dispatch questions
CDD: Will the WastewaterSCAN dashboard start including data from wastewater testing sites included in the CDC contract, as they come online? Or is Verily planning to launch its own dashboard that will share data from those sites (perhaps in aggregate, national trends, similar to the current Biobot dashboard)?
Verily: WastewaterSCAN representatives have responded. On the question of sharing aggregated, national trends data from these sites: This is a CDC decision for the NWSS testing program.
CDD: Besides public dashboards, will there be alignment between WastewaterSCAN and Verily in how wastewater data are processed, analyzed, and interpreted?
Verily: There are many methods for analyzing the concentration of pathogens in wastewater. Verily offers several methods for wastewater analysis to its customers and ones chosen by the CDC NWSS and WastewaterSCAN programs differ primarily in what part of the wastewater is analyzed and how the pathogens are concentrated and extracted before measurement of pathogen concentrations. Beyond these initial steps, Verily’s lab processes all samples similarly.
The liquid fraction (of influent samples) will be concentrated and tested for the CDC NWSS program, similar to the approach previously used for NWSS contract testing.
The solid fraction of samples (from the primary clarifier or influent) has been shown to concentrate many pathogens and is tested for the WastewaterSCAN program.
Results from methods have shown agreement with case data in the literature. However, differences between the methods make them complementary to each other.
CDD: When the CDC previously switched contractors in spring 2022, some testing sites covered by the contract didn’t report to NWSS for several weeks while they transferred to a new process. What is Verily doing to help transition sites during the current switch?
Verily: Verily has an established system and team dedicated to onboarding new sites with the ability to rapidly initiate testing. This is informed by our previous experience providing logistics and lab services to over 200 sites in wastewater monitoring programs.
As we receive information from the CDC NWSS program about which sites will transition, we will get sites up and running as soon as possible. Our goal is to have up to 200 sites testing within the first four weeks of the contract.
During the most recent week of data available (September 24-30), the U.S. reported about 18,100 new COVID-19 patients admitted to hospitals, according to the CDC. This amounts to:
An average of 2,600 new admissions each day
5.5 total admissions for every 100,000 Americans
6% fewer new admissions than the prior week (September 17-23)
Additionally, the U.S. reported:
10.9% of tests in the CDC’s surveillance network came back positive
A 1% higher concentration of SARS-CoV-2 in wastewater than the prior week (as of September 27, per Biobot’s dashboard)
29% of new cases are caused by Omicron EG.5, 23% by XBB.1.6, 14% by FL.1.5.1 (as of September 30)
After a couple of weeks’ decline, COVID-19 spread in the U.S. may be leveling off ahead of more increases in late fall and winter. We’re seeing plateaus in wastewater data, paired with slight declines in test positivity and hospital indicators.
Biobot’s COVID-19 wastewater dashboard suggests that national COVID-19 spread reached a plateau last week, increasing very slightly from September 20 to September 27. The company’s regional data suggest that this plateau is consistent in all four regions, but the Northeast has significantly higher (and potentially rising) viral levels. It’s worth noting Biobot’s data may have become less comprehensive recently; see below for more details.
The WastewaterSCAN project similarly shows that COVID-19 spread hasn’t changed much at the national level in recent weeks: it is high with no significant trend up or down, according to the project’s assessment. Per WastewaterSCAN, the Northeast and Midwest continue to have more coronavirus transmission than the West and South.
Some Northeast cities are reporting significant upticks in the last week, including South Boston, Portland, Maine, and Montpelier, Vermont (the latter two report to WastewaterSCAN). In past years, late fall/winter surges have started in the Northeast and Midwest, as these regions see colder weather earlier, sometimes paired with the introduction of new variants. It seems likely that a similar trend will occur this year.
In non-wastewater indicators: test positivity from the CDC’s laboratory network continues to trend slightly down, reported at 10.9% for the week ending September 30. Hospitalizations have also dipped slightly, though more than 2,500 people have still been hospitalized daily with COVID-19 in recent weeks.
I wish I could update you about the fall vaccine rollout, but we literally don’t have national data on it, thanks to the end of CDC vaccination reporting requirements tied to the federal public health emergency. The CDC’s last vaccination data update occurred on May 11.
Respiratory virus season is about to start, meaning that other common viruses (flu, RSV, etc.) will join COVID-19 in causing easily preventable illnesses. Remember that masks, ventilation, and shifting activities outdoors help reduce risks of all these viruses, not just SARS-CoV-2.
Test positivity for COVID-19 is declining while hospitalizations are starting to plateau, according to the CDC’s data.
During the most recent week of data available (September 17-23), the U.S. reported about 19,100 new COVID-19 patients admitted to hospitals, according to the CDC. This amounts to:
An average of 2,700 new admissions each day
5.8 total admissions for every 100,000 Americans
3% fewer new admissions than the prior week (September 10-16)
Additionally, the U.S. reported:
11.6% of tests in the CDC’s surveillance network came back positive
A 13% lower concentration of SARS-CoV-2 in wastewater than the prior week (as of September 20, per Biobot’s dashboard)
29% of new cases are caused by Omicron EG.5, 23% by XBB.1.6, 14% by FL.1.5.1 (as of September 30)
COVID-19 spread is on the decline nationally, following a trend from the last couple of weeks. But levels are still very high, and it’s unclear how long this decline will continue before colder weather and indoor gatherings push transmission up again.
Wastewater surveillance (from Biobot, WastewaterSCAN, and the CDC’s network) reports national COVID-19 declines for the last two to three weeks. Patterns differ at the regional level, though, likely due to different behavioral patterns and variants.
Biobot Analytics’ dashboard shows that national coronavirus levels in wastewater have dropped by about 20% from August 30 to September 20. While all four regions report declines, the Northeast is experiencing more of a plateau compared to starker drops in the South, West, and Midwest.
Biobot announced this week that they will be updating COVID-19 data weekly on Mondays, a change from their prior biweekly reports on Tuesdays and Thursdays. This shift will lead to a greater delay in Biobot’s data; the most recent data on their dashboard are now as of September 20, over a week ago. But, as a tradeoff, the data may now be more accurate in incorporating samples from Biobot’s entire network, reducing retrospective updates.
WastewaterSCAN’s dashboard shows a similar picture to Biobot’s: a slow decline in SARS-CoV-2 levels nationally, with more coronavirus spreading in the Northeast and Midwest than West and South. The WastewaterSCAN team recently updated their dashboard to more easily show national and regional trends—I’m a fan of the change.
Aligning with wastewater data, test positivity from the CDC’s lab testing network has declined by about 20% in the last month. This metric also differs by region; test positivity is higher in Health Region 2 (including New York and New Jersey) as well as 5 and 7 (including some Midwestern states) than in other parts of the country.
Hospitalizations (a more delayed indicator) are starting to plateau, according to the CDC. But it’s important to recognize that our limited wastewater and testing data suggest, while COVID-19 levels may be declining, they are still quite high compared to past lulls in transmission. Biobot’s data, for example, suggest that current spread is comparable to this time in early fall 2021, during the Delta wave.
There hasn’t been much change in the variant picture during recent weeks: XBB.1.5-related variants EG.5 and XBB.1.6 caused the majority of cases in September, according to the CDC’s latest estimates. (EG.5 is an offshoot of XBB.1.9.) BA.2.86 has yet to show up in significant numbers, suggesting it might not be as competitive as some experts initially expected; though it could still accumulate and cause problems later this fall.
The CDC is now updating its COVID-19 data weekly on Fridays, timed with its updates to other respiratory virus data pages. This suggests—as I noted last week—that the agency is now incorporating COVID-19 into its regular fall/winter virus surveillance systems.