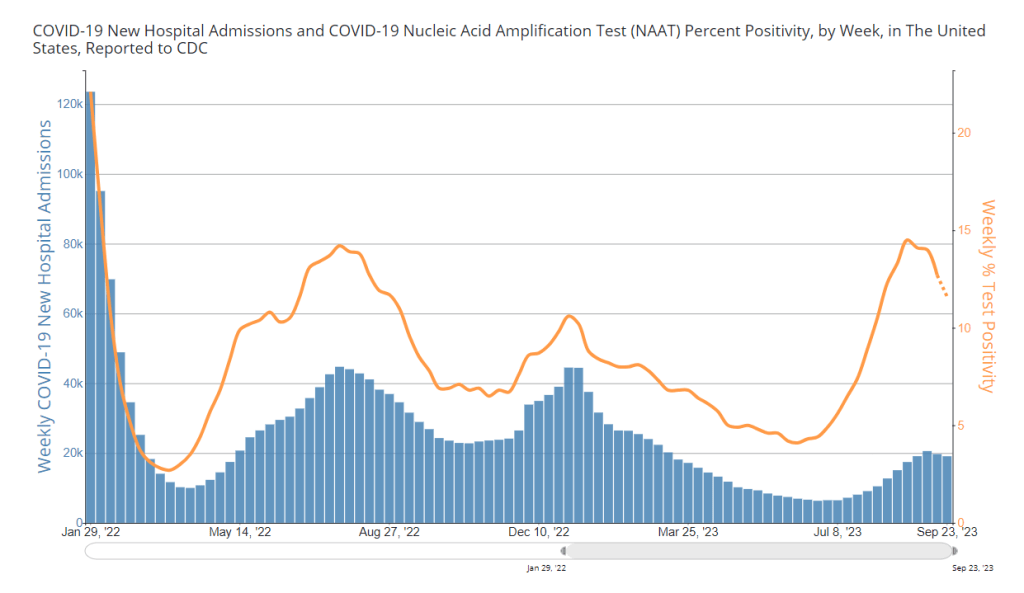

During the most recent week of data available (September 17-23), the U.S. reported about 19,100 new COVID-19 patients admitted to hospitals, according to the CDC. This amounts to:
- An average of 2,700 new admissions each day
- 5.8 total admissions for every 100,000 Americans
- 3% fewer new admissions than the prior week (September 10-16)
Additionally, the U.S. reported:
- 11.6% of tests in the CDC’s surveillance network came back positive
- A 13% lower concentration of SARS-CoV-2 in wastewater than the prior week (as of September 20, per Biobot’s dashboard)
- 29% of new cases are caused by Omicron EG.5, 23% by XBB.1.6, 14% by FL.1.5.1 (as of September 30)
COVID-19 spread is on the decline nationally, following a trend from the last couple of weeks. But levels are still very high, and it’s unclear how long this decline will continue before colder weather and indoor gatherings push transmission up again.
Wastewater surveillance (from Biobot, WastewaterSCAN, and the CDC’s network) reports national COVID-19 declines for the last two to three weeks. Patterns differ at the regional level, though, likely due to different behavioral patterns and variants.
Biobot Analytics’ dashboard shows that national coronavirus levels in wastewater have dropped by about 20% from August 30 to September 20. While all four regions report declines, the Northeast is experiencing more of a plateau compared to starker drops in the South, West, and Midwest.
Biobot announced this week that they will be updating COVID-19 data weekly on Mondays, a change from their prior biweekly reports on Tuesdays and Thursdays. This shift will lead to a greater delay in Biobot’s data; the most recent data on their dashboard are now as of September 20, over a week ago. But, as a tradeoff, the data may now be more accurate in incorporating samples from Biobot’s entire network, reducing retrospective updates.
WastewaterSCAN’s dashboard shows a similar picture to Biobot’s: a slow decline in SARS-CoV-2 levels nationally, with more coronavirus spreading in the Northeast and Midwest than West and South. The WastewaterSCAN team recently updated their dashboard to more easily show national and regional trends—I’m a fan of the change.
Aligning with wastewater data, test positivity from the CDC’s lab testing network has declined by about 20% in the last month. This metric also differs by region; test positivity is higher in Health Region 2 (including New York and New Jersey) as well as 5 and 7 (including some Midwestern states) than in other parts of the country.
Hospitalizations (a more delayed indicator) are starting to plateau, according to the CDC. But it’s important to recognize that our limited wastewater and testing data suggest, while COVID-19 levels may be declining, they are still quite high compared to past lulls in transmission. Biobot’s data, for example, suggest that current spread is comparable to this time in early fall 2021, during the Delta wave.
There hasn’t been much change in the variant picture during recent weeks: XBB.1.5-related variants EG.5 and XBB.1.6 caused the majority of cases in September, according to the CDC’s latest estimates. (EG.5 is an offshoot of XBB.1.9.) BA.2.86 has yet to show up in significant numbers, suggesting it might not be as competitive as some experts initially expected; though it could still accumulate and cause problems later this fall.
The CDC is now updating its COVID-19 data weekly on Fridays, timed with its updates to other respiratory virus data pages. This suggests—as I noted last week—that the agency is now incorporating COVID-19 into its regular fall/winter virus surveillance systems.

Leave a comment