We have two featured sources this week, both related to vaccination data:
US COVID-19 Vaccination Tracking: This is a new vaccination dashboard focused on demographics, developed by researchers at Georgetown University’s Bansal Lab. The dashboard compiles data on vaccination by race, ethnicity, sex, and gender from state reporting. Users can also hover over counties to see what share of the county’s population has been vaccinated, based on county or state data. Here’s a Twitter thread from lead researcher Shweta Bansal on the dashboard’s methodology and findings so far.
COVIDcast vaccination survey results: I’ve featured COVIDcast, a project by the Delphi Group at Carnegie Mellon University, before. The project’s dashboard interactive maps for a variety of COVID-19 indicators ranging from movement trends to antigen tests. But I’m featuring the source again this week because recently, the Delphi Group collected survey data on vaccine acceptance. You can download the data and compare vaccine hesitancy across counties; read more about the release in MIT Technology Review.
Earlier this week, I got a frantic email from my grandma. She wanted my help in finding a vaccination appointment. She’d talked to her primary care provider and looked at her state public health agency’s website, but wasn’t sure how to actually secure her own spot in line. She lives in California, which is still officially in Phase 1A (vaccinating healthcare workers and long-term care facility residents), but is allowing some providers to start vaccinating seniors and essential workers based on “available supply.”
My uncle did help my grandma get an appointment—one month from now and an hour’s drive away. Despite living in Berkeley, near several research universities, she’ll be heading to Palo Alto for her shots. I told her to keep a close eye on her county public health department’s website in case something becomes available there (which would be my advice to anyone else in this position), but I couldn’t guarantee that she’d be able to find an appointment any closer than the one she has now.
And she’s not alone: a lot of grandmas are having trouble getting vaccination appointments. In fact, recent survey data from the Kaiser Family Foundation suggests that the majority of American seniors “do not have enough information about when and where they will be able to get the vaccine.” Black, Hispanic, and low income adults also report not having enough information about vaccinations, according to KFF. The minority communities that continue to be heavily impacted by the pandemic are supposed to be first in line for vaccines, but barriers to information and technology—particularly to vaccine registration portals—are leaving them behind once again.
It would be easy to say the problem here is a lack of vaccine doses. But that’s not exactly it. The federal government is distributing millions of doses each week, and many of those doses are making it into arms: according to Bloomberg’s vaccine tracker, an average of 1.1 million shots were reported each day this past week. By sheer numbers, we are already on track to meet President Biden’s 100 million vaccinations in 100 days goal.
Our current problem is, in fact, a logistics one. It’s a build up of infrastructure failures, with all the weight falling on those underfunded local public health departments I mentioned in the previous section. Right now, these public health workers are trying to set up vaccination appointments, while also dealing with constantly-changing information from their state on how many doses they will get, while also stretching out a depleted budget, while also probably short on personnel because half of their staff quit or got COVID-19 in 2020, while also dealing with backlash from their communities, while also fielding endless calls from confused grandmas… and all of this while still testing, contact tracing, and communicating basic pandemic safety measures. Whew. I got tired just writing that sentence.
Some dimensions of this problem, such as the funding and lack of community trust, are years in the making. But there’s one piece the federal government may be able to solve soon, and it’s a data issue. The federal government is not giving states—and by extension, local public health agencies—enough lead time to coordinate their vaccine distribution. ProPublica reporters Caroline Chen, Isaac Arnsdorf and Ryan Gabrielson explained the situation in a detailed feature this week: unpredictable shipments at the national level mean that vaccine providers are unable to use up all of their shots in some weeks and cancelling appointments in others. The whole piece is worth reading, but I want to highlight the one quotation near the end:
Starting Wednesday, it will be up to the Biden administration to provide clear visibility for states, according to a member of the president-elect’s COVID-19 team, who asked not to be identified because he wasn’t authorized to speak on behalf of the new administration.
“The government can point at the manufacturer, but it’s like asking the [Defense Department], ‘How many planes do you have?’ and them saying, ‘I don’t know, ask Boeing,’” the person said.
Reporters at POLITICO similarly found that public health workers simply don’t trust the dose allocation system. While the Biden administration may want to ramp up vaccine production in order to vaccinate more Americans, this goal may be more easily achieved by ensuring vaccines are properly tracked. At every part of the vaccination pipeline, stakeholders should know how many doses they’re getting and when. Shipments should be predictable, and appointments should be easily managed, freeing up public health workers’ time to take on the important task of actually vaccinating people.
It also bears mentioning that Pfizer will now be shipping out fewer vaccine vials to account for the “surprise 6th dose” that providers are often able to get out of each vial—since Pfizer charges by the dose. It is unclear whether this reduction in dose availability will affect the rollout.
One piece of good news, on the vaccination data front: the CDC vaccination tracker stepped up its reporting to include weekend updates, as of yesterday. But the agency still isn’t reporting demographic data, comprehensive data on long-term care facilities, or even a time series of doses administered per day. Vaccination tracking has a long way to go.
Following the end of the federal public health emergency in May, the CDC has lost its authority to collect vaccination data from all state and local health agencies that keep immunization records. As a result, the CDC is no longer providing comprehensive vaccination numbers on its COVID-19 dashboards. But we still have some information about this year’s vaccination campaign, thanks to continued CDC efforts as well as reporting by other health agencies and research organizations.
This week, the FDA authorized Novavax’s updated COVID-19 vaccine. Here’s why some people are excited to get Novavax’s vaccine this fall, as opposed to Pfizer’s or Moderna’s.
Every week, I come into your inbox and I say, the vaccine rollout is going badly. And you’re probably like, yeah, Betsy, I know, it’s on the news every single day.
You probably don’t need me to tell you about the announcement this past Tuesday, from Health and Human Services Secretary Alex Azar, telling states to stop saving their second doses and start prioritizing all adults over the age of 65… or the Washington Post scoop this past Friday, revealing that states couldn’t actually vaccinate more people because the federal vaccine reserve was already used up. (I salute all the policy reporters following this madness. Seriously.)
So instead, today, I’m focusing on a vaccination issue that hasn’t gotten as much press: who is actually getting vaccinated? On the national level, we largely can’t answer this question, thanks to a lack of demographic data.
While the CDC’s vaccination tracker has seen some upgrades recently (such as the inclusion of people receiving two doses and downloadable data), it does not report any information on the race, ethnicity, age, gender, or occupation of those Americans who have gotten shots. And the data aren’t much better at the state level, according to recent analysis from the COVID Tracking Project.
The COVID Tracking Project analysis discusses 17 states which report race and/or ethnicity data for vaccine recipients. Since the post was published, two more states—Missouri and West Virginia—have started reporting such data. Still, just reporting these data isn’t sufficient. Alice Goldfarb, Kara Schechtman, Charlotte Minsky, and other Project volunteers who compiled detailed annotations on the vaccine metrics reported by each state found that, even when states do report demographic data, each state uses vastly different categories, making it difficult to compare or combine this state-level information into a useful national dataset.
Using the limited data that are available, though, we can still see that the vaccination effort thus far is incredibly inequitable—despite government promises to prioritize vulnerable populations.
White Americans are getting vaccinated at much higher rates than Black Americans, according to a Kaiser Health News analysis of state data published yesterday. Reporters Hannah Recht and Lauren Weber discuss access issues and mistrust of the healthcare system—tied to systematic racism against Black Americans seeking healthcare—as reasons why Black Americans may be left behind.
But the disparities so far, at a stage of the vaccine rollout that has largely prioritized healthcare workers, means that both national and local public health agencies have a lot of work to do:
“My concern now is if we don’t vaccinate the population that’s highest-risk, we’re going to see even more disproportional deaths in Black and brown communities,” said Dr. Fola May, a UCLA physician and health equity researcher. “It breaks my heart.”
In New York—a state which finally released a vaccine dashboard today, but is not yet reporting demographic data—vaccination trends by hospital suggest a similar pattern. The hospitals with the highest shares of vaccinated workers are, by and large, private hospitals located in Manhattan. The hospitals with fewer vaccinated workers, on the other hand, include those located in Harlem, Brooklyn, and other working-class neighborhoods.
Data are also lacking for long-term care facilities. The CDC reports total vaccine doses administered in these facilities (which include nursing homes, assisted living facilities, and other care homes). But a national total is unhelpful in analyzing where states have been most successful at getting vaccines to this high-priority population. A COVID Tracking Project analysis, published on Thursday, found vaccine data for LTCs in only seven states. South Carolina is the only state releasing detailed data on individual facilities.
Meanwhile, CVS has published a state-by-state dataset of LTC vaccinations administered by this pharmacy chain. The COVID Tracking Project reports that Walgreens may release a similar dataset. It seems pretty wild that independent pharmacy chains are reporting more detailed vaccine data than the federal government itself—until you remember, well, how data reporting has gone this entire pandemic.
Vaccination data, right now, are about as messy as testing data were back in spring 2020. Every state is doing its own thing, and the federal government has yet to provide sufficiently detailed information for meaningful analysis. Readers: I urge you to push for better vaccine demographic data, both in your own region and nationally.
The COVID-19 Vaccine Communication Handbook is a new resource from communication initiative SciBeh aimed to help journalists, healthcare workers, and other communicators talk about COVID-19 vaccines and challenge misinformation.
Following the end of the federal public health emergency in May, the CDC has lost its authority to collect vaccination data from all state and local health agencies that keep immunization records. As a result, the CDC is no longer providing comprehensive vaccination numbers on its COVID-19 dashboards. But we still have some information about this year’s vaccination campaign, thanks to continued CDC efforts as well as reporting by other health agencies and research organizations.
This week, the FDA authorized Novavax’s updated COVID-19 vaccine. Here’s why some people are excited to get Novavax’s vaccine this fall, as opposed to Pfizer’s or Moderna’s.
Despite the holiday, many jurisdictions have begun reporting COVID-19 vaccination data since my last issue. Here are the major updates:
CDC added vaccinations to its dashboard: Mere hours after I published last week’s newsletter questioning when the federal government would release a national count of how many Americans had been vaccinated, the CDC began posting just that. The CDC COVID Data Tracker now includes both a count of how many vaccine doses have been distributed and a count of how many people have received their first dose—1.9 million as of Saturday, December 26. The count includes both Pfizer and Moderna’s vaccines, and incorporates reporting from states, local public health agencies, and federal entities including the Bureau of Prisons, Veterans Administration, and Indian Health Services. More detailed geographic and demographic data are not yet available from the CDC.
27 states are now reporting COVID-19 vaccination data: While the COVID Tracking Project is not tracking vaccinations, the Project is keeping a running list of states that are reporting vaccine-related metrics. As of December 25, 27 states are reporting vaccine doses administered or another similar metric. Of the states reporting vaccinations, nine are reporting race and ethnicity of the residents vaccinated—that’s a huge jump from last Sunday, when only Florida was reporting this information. In other demographic metrics: 14 states are reporting age of those vaccinated, 10 are reporting sex or gender, and 14 are reporting county.
How the COVID Tracking Project hopes vaccines will be tracked: In addition to its state dashboard annotations, the Project released a blog post last week detailing key information that Project leads believe should be prioritized by state and federal public health departments, as well as what states are reporting so far. Key metrics include: the number of people fully vaccinated (not just the number of doses administered), demographic data reported in absolute numbers (not percentages), county-level data, and data on vaccinations in long-term care facilities.
New Mexico will notify residents when they qualify for vaccination: This past Wednesday, the New Mexico Department of Health launched a website where state residents can sign up to learn when they will be eligible to receive a COVID-19 vaccine. The sign-up form is currently somewhat confusing to use, as a new user must click “Schedule a New Appointment” to put in their contact details—even if they aren’t eligible for vaccination yet. Still, this effort to provide transparency about vaccination progress on such an individual level is unique among states thus far.
Our World in Data is tracking COVID-19 vaccinations worldwide: As of December 26, the open-source data repository Our World in Data is compiling vaccination counts from 10 countries: the U.S., the U.K., China, Russia, Israel, Canada, Bahrain, Chile, Mexico, and Costa Rica. So far, the U.S. has administered the most doses at 1.9 million, while Bahrain has administered the most doses when adjusted for population, at 3 doses for every 100 people.
Initial COVID-19 vaccine data in North Carolina reveals racial disparities: Samantha Kummerer, reporter for ABC11 in Raleigh-Durham, North Carolina, used the state’s early demographic data to draw attention to healthcare disparity. “When compared to the overall population of North Carolina, both Black and Latino communities are severely underrepresented in COVID-19 vaccination data,” Kummerer writes. She goes on to explain that these data reflect the hospital workforce in North Carolina, which was the first group to be vaccinated—and which is overwhelmingly white. This story reflects why it is so important for states to be transparent about their vaccination demographics, even at such an early stage of vaccine deployment.
With this past Monday’s announcement from the University of Oxford and the pharmaceutical company AstraZeneca, three COVID-19 vaccine candidates have now demonstrated clinical trial results which could land them Emergency Use Authorization from the Food & Drug Administration (EUA from the FDA, for short). Pfizer, the first vaccine manufacturer to release its trial results, applied for EUA on November 20. The FDA advisory committee will meet on December 10 to review this application, and vaccines could start shipping out as early as December 12.
These dates are incredibly exciting—December 12 is only three weeks away. But that first vaccine shipment will likely include 50 million doses, at most. Since two doses are required for a patient to be protected against COVID-19, this means up to 25 million people will be able to get vaccinated. That represents just 7.6% of the country’s population. So, who will get vaccinated first?
As per usual in America’s fractured pandemic response, the answer to this question will largely depend on state and local public health authorities. Still, national guidances and data on health disparity allow us to see who should get the vaccine first—and evaluate our local public health authorities when the doses start rolling out.
Earlier this week, the Advisory Committee on Immunization Practices (ACIP) released a report which aims to help local authorities make these decisions. The ACIP is a group of medical and public health experts affiliated with the Centers for Disease Control and Prevention (CDC), which develops recommendations on how vaccines should be used among U.S. residents. The committee has been considering COVID-19 vaccine ethics since April, through a Work Group which conducted literature reviews and presented its findings to the rest of the team.
The ACIP recommends that four ethical principles guide COVID-19 vaccine distribution:
Maximize benefits and minimize harms. The first people to get vaccinated should be those who, when they are healthy, are better able to protect the health of others in their community. This includes healthcare workers, other essential workers, and people with preexisting health conditions who would likely need to be hospitalized if they became sick with COVID-19.
Promote justice. Americans of all backgrounds and communities should have an equal opportunity to be vaccinated. The ACIP recommends that public health authorities work with external partners and community representatives to help make vaccines available (and attractive) to everyone—both when vaccine supply is limited and when everyone is able to get inoculated.
Mitigate health inequities. People of color, especially Black Americans, Native Americans, and Native Hawaiians/Pacific Islanders, have been disproportionately impacted by COVID-19 in the U.S. The legacy of systemic racism in this nation’s healthcare system and economy, as well as disparities in testing availability and care, have contributed to these inequitable outcomes. Vaccine distribution must directly address such inequities by prioritizing racial and ethnic minorities, low-income communities, rural communities, and other marginalized groups.
Promote transparency. All the decisions that public health authorities make about who gets the vaccine, when, and how must be communicated clearly to the public. Furthermore, communities should be invited to participate in the decision-making process whenever possible. This kind of transparency helps promote trust in both the vaccines and the people who administer them.
The ACIP’s recommendations are also laid out more practically in two tables at the end of the report. The first table poses essential questions for public health authorities to consider for each ethical principle, while the second applies these principles to four key groups who will be prioritized in the first round of vaccinations: healthcare workers, other essential workers, adults with high-risk medical conditions, and adults over the age of 65.
Dr. Uché Blackstock, the founder of Advancing Health Equity, critiqued the recommendations on Twitter for failing to specifically call out the role of systemic racism in shaping how COVID-19 has impacted Black communities. Still, these principles are a good start in providing us reporters and community members with a framework for watching how our public health authorities distribute vaccines.
The federal government will simply be sending vaccine doses to states based on their overall populations rather than taking the ACIP’s recommendations, according to NPR’s Pien Huang. So, it will be entirely up to states and more local public health departments to prioritize justice, equity, and transparency. What tools should public health departments use in order to apply these principles?
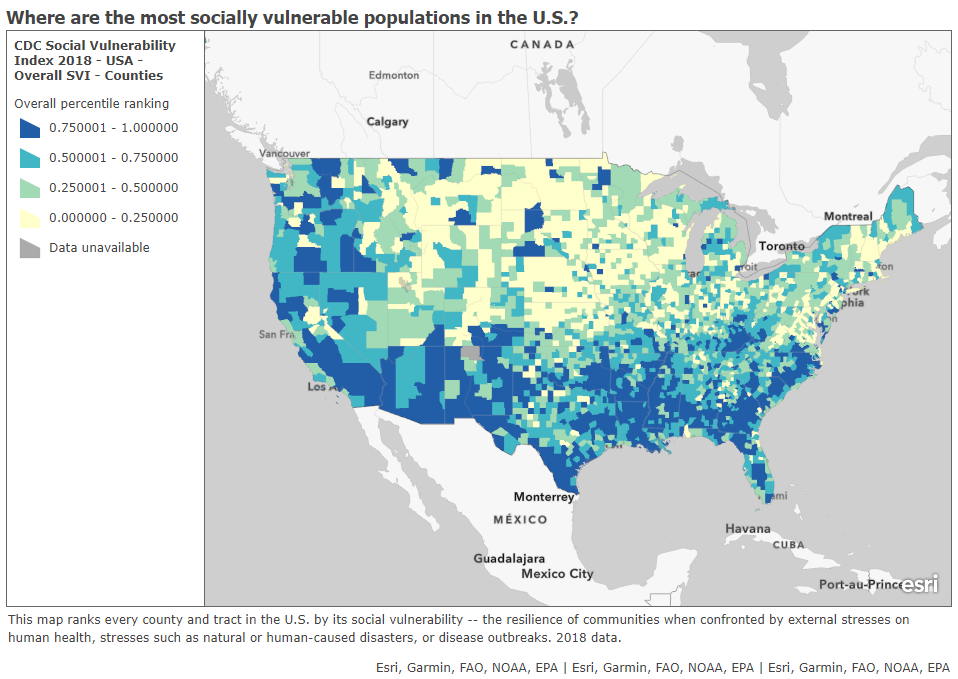
In a webinar last week on vaccine distribution, STAT News reporter Nicholas St. Fleur suggested turning to the CDC’s Social Vulnerability Index. Social vulnerability, as the CDC defines it, measures a community’s ability to recover from events that are hazardous to human health. These events can include tornados, chemical spills, and—of course—pandemics. CDC researchers have calculated the social vulnerability of every Census tract in the U.S. based on 15 social, economic, and environmental factors such as poverty, lack of vehicle access, and crowded housing.
The most recent update of this index was released in March 2020 based on analysis of 2018 Census data. Here’s what it looks like, mapped by Esri’s Urban Observatory:
The CDC’s Census tract-level Social Vulnerability Index, as mapped by Esri’s Urban Observatory. Communities colored in dark blue are more vulnerable to hazardous health events.
St. Fleur also recommends checking out how your state, city, or county defines essential workers, as these distinctions may vary from region to region. In New York, for example, essential workers include teachers, pharmacists, and grocery store workers. In Texas, essential workers include law enforcement and the Texas Forest Service. The Kaiser Family Foundation report which I featured in last week’s issue compiles links to draft COVID-19 vaccination plans for every state, some of which include these definitions.
I anticipate that vaccine distribution and reporting will continue to be a major topic for this newsletter in the coming months. Questions and topic suggestions are always welcome; you can drop me a line at betsyladyzhets@gmail.com, on Twitter, or in the comments.
This past Monday, pharmaceutical company Pfizer announced preliminary clinical trial results for its COVID-19 vaccine. In an interim analysis of the vaccine’s phase 3 study, the vaccine was shown to be 90% effective in preventing COVID-19. In other words, based on the people in Pfizer’s study who have become diagnosed with COVID-19 so far, those who got vaccinated were 90% less likely to get sick compared with the people who did not.
90% is an exciting number. The Food & Drug Administration (FDA) set a threshold of 50% effectiveness for COVID-19 vaccines to be authorized, and experts have been telling us for months that even a 60% or 70% effectiveness would still be incredibly useful in reducing infections across the population. Pfizer’s initial 90% rate blows those expectations out of the water.
Plus, this effectiveness value bodes well for other vaccine candidates. Pfizer’s vaccine, developed through a partnership with German biotech BioNTech, uses a new vaccine technology based on synthetic messenger RNA, or mRNA; so does the vaccine developed by Moderna, which is also currently in clinical trials. (For more backstory on mRNA, BioNTech, and Moderna, I highly recommend Damian Garde’s feature in STAT News.)
But we can’t get too excited. Pfizer reported its preliminary data not in a peer-reviewed scientific paper, but in a press release, and some key details about the company’s clinical trial are not yet public. I used information from STAT News, KHN, and SciLine to compile a few key questions that should be in all of our minds as we think about this and future vaccine data releases.
What is the sample size? Or, how many people were involved in the trial, and how many of them were diagnosed with COVID-19? For Pfizer’s trial, this is a question we can answer: about 44,000 people are enrolled in the study, and the 90% effectiveness rate is based on results from 94 people who contracted COVID-19, the majority of whom did not receive a vaccine dose. This may seem like a tiny fraction of the participants, but many experts are cautiously optimistic in hoping the 90% rate will hold up for a larger group.
Who is included in the sample size? COVID-19 has disproportionately impacted the elderly, people of color, people with certain medical conditions, and other marginalized groups. It is thus crucial that a vaccine is effective for people in these groups—in other words, these people must be represented in the vaccine trial. Pfizer reports that 42% of the overall study participants have “diverse backgrounds,” but the specific backgrounds of the patients who got sick are unknown.
Does the vaccine work for severe cases? While the majority of people diagnosed with COVID-19 are able to survive the disease with mild symptoms in their own homes, the minority of people who become seriously ill constitute the pandemic’s massive loss, as well as its burden on our nation’s healthcare system. A vaccine that reduces the disease’s severity through boosting immune system defenses may be incredibly valuable, even if it does not entirely prevent infection.
Does the vaccine work for mild or asymptomatic cases? A vaccine that prevents mild cases would help keep COVID-19 spread at bay, even if this vaccine does not reduce the disease’s severity. Pfizer’s press release does not include any specifics on the 94 patients who were diagnosed with COVID-19; experts are hoping that such details may be revealed in a forthcoming scientific paper.
Does the vaccine have any adverse effects? In other words, is the vaccine safe? We all know that flu vaccines make our arms sore, and other vaccines can give us mild colds. These types of common effects are usually nothing to worry about, but vaccines may pose a more severe danger to a small fraction of the population; for example, one in every ten thousand patients might have an allergic reaction that sends them to the hospital. So far, Pfizer has not reported any severe effects of its vaccine, but the current clinical trial gives the company a much wider pool of people in which dangerous reactions might be observed.
What are the vaccine’s logistical needs? One dose or two? At what temperature does the vaccine need to be stored? How long can it be at room temperature before it needs to be administered? How many doses can be manufactured in a day, a week, a year? What’s the price tag? Pfizer has given preliminary answers to some of these questions (two doses, -70 degrees Celsius) but the company is finalizing its manufacturing and distribution strategies as it completes its clinical trial.
Even when a vaccine is authorized by the FDA, distributing and tracking it poses a whole new set of questions. I’ve written about vaccine data before, and I expect that this will be a topic I cover in increasing detail during the months to come.