Tag: test positivity

  • National numbers, September 10

    National numbers, September 10

    COVID-19 test positivity and viral levels in wastewater may be turning around, but hospitalizations are still going up. Chart from the CDC, data as of September 7.

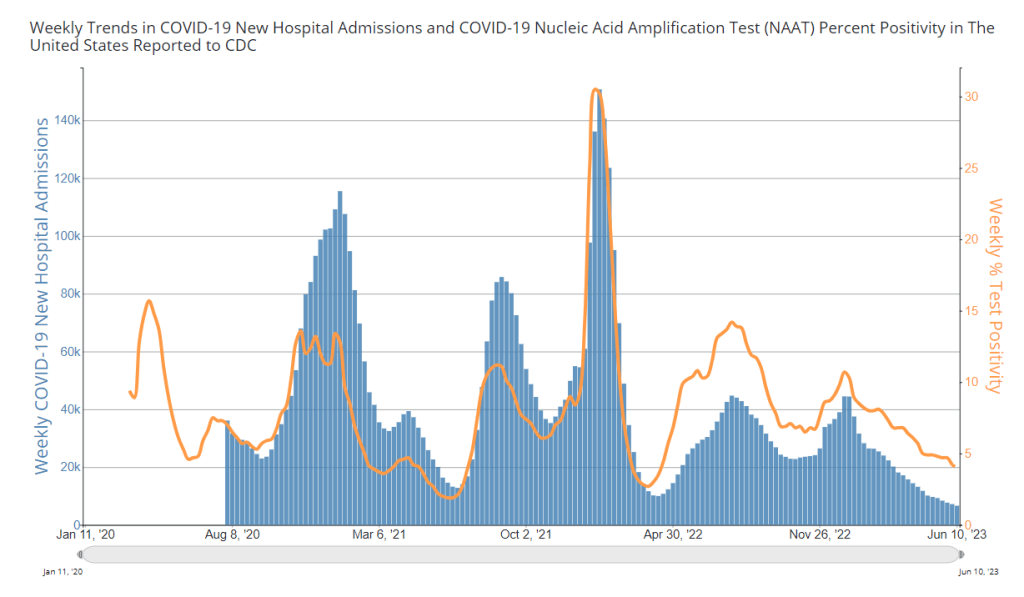
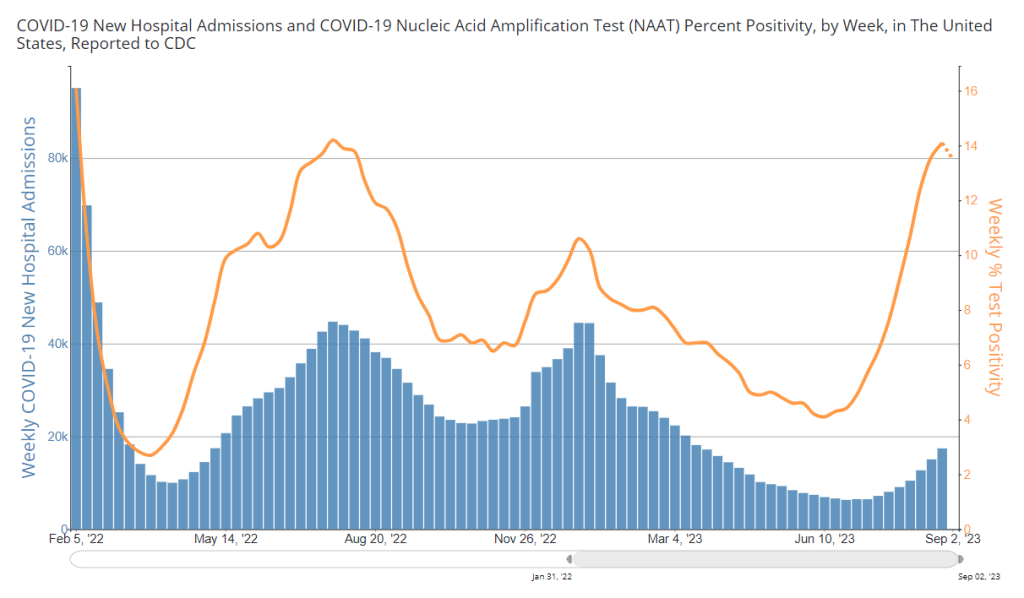
    During the most recent week of data available (August 20-26), the U.S. reported about 17,400 new COVID-19 patients admitted to hospitals, according to the CDC. This amounts to:

    • An average of 2,500 new admissions each day
    • 5.3 total admissions for every 100,000 Americans
    • 16% more new admissions than the prior week (August 13-19)

    Additionally, the U.S. reported:

    • 13.5% of tests in the CDC’s surveillance network came back positive
    • A 0.3% higher concentration of SARS-CoV-2 in wastewater than last week (as of September 6, per Biobot’s dashboard)
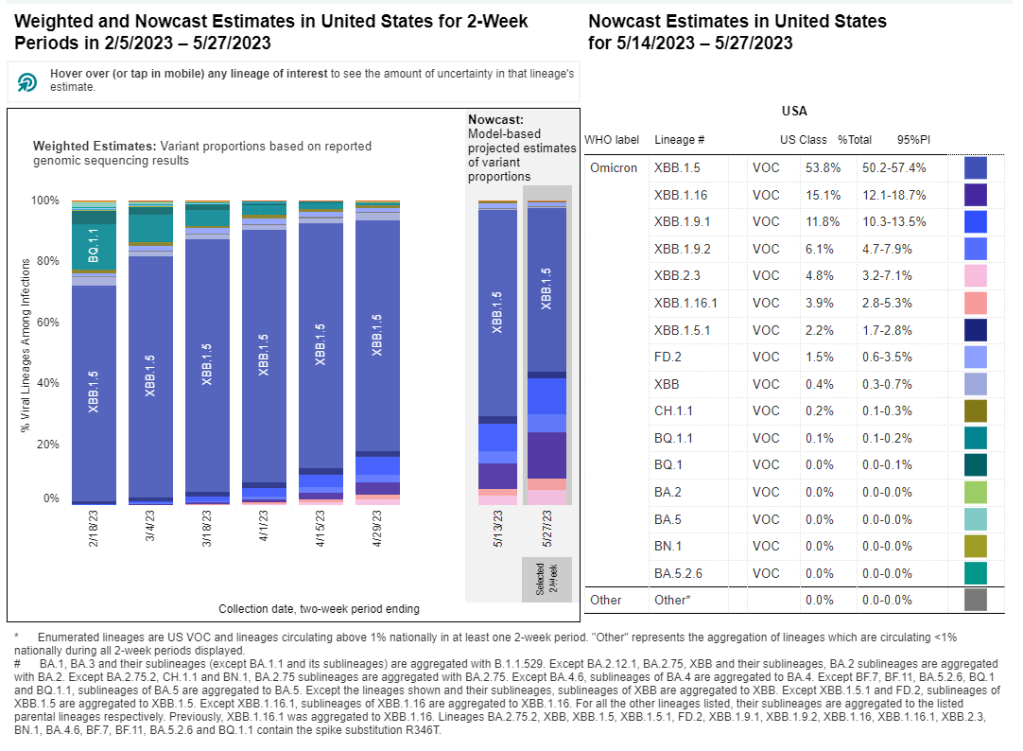
    • 23% of new cases are caused by Omicron XBB.1.6; 22% by EG.5; 15% by FL.1.5.1 (as of September 2)

    After two months of consistent increases in major COVID-19 metrics, we have once again reached, “Has the surge peaked?” territory. Preliminary data from wastewater and testing are suggesting potential plateaus, while more people are still getting hospitalized with COVID-19.

    National trends from Biobot Analytics’ wastewater surveillance network show very similar coronavirus levels in sewage this week and last week: 641 virus copies per milliliter of sewage on September 6, compared to 639 on August 30. These data are preliminary, though, and could change as more sewersheds report.

    Biobot’s regional data suggest different trends in different parts of the country: the South and West coast might be turning around, the Northeast is still reporting an increase (but the speed of increase there is slowing), and the Midwest is reporting a sharp increase following a recent decrease.

    Data from the CDC network and WastewaterSCAN similarly show mixed results depending on your location. Among CDC sites with recent data, about half reported increased coronavirus in their wastewater in the last two weeks, while the other half reported decreases. WastewaterSCAN’s network reports continued increases in Midwestern states, including sewersheds in Michigan, Ohio, and Kansas.

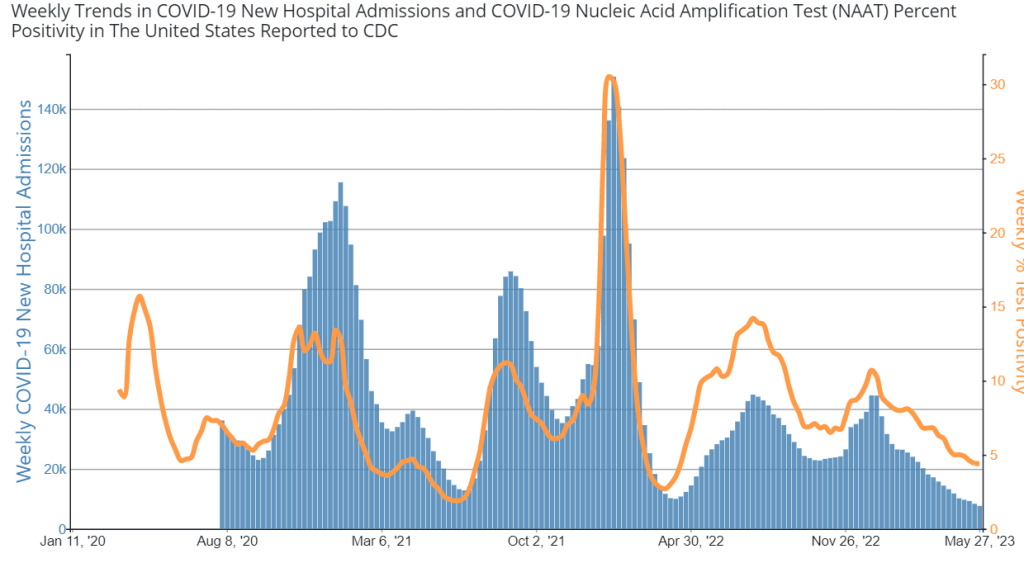
    Test positivity data from the CDC’s respiratory surveillance network also indicate that the summer surge might have peaked, or at least might be slowing. For the first time in several weeks, test positivity decreased slightly in the most recent CDC update, from 14.1% in the week ending August 26 to 13.5% in the week ending September 2.

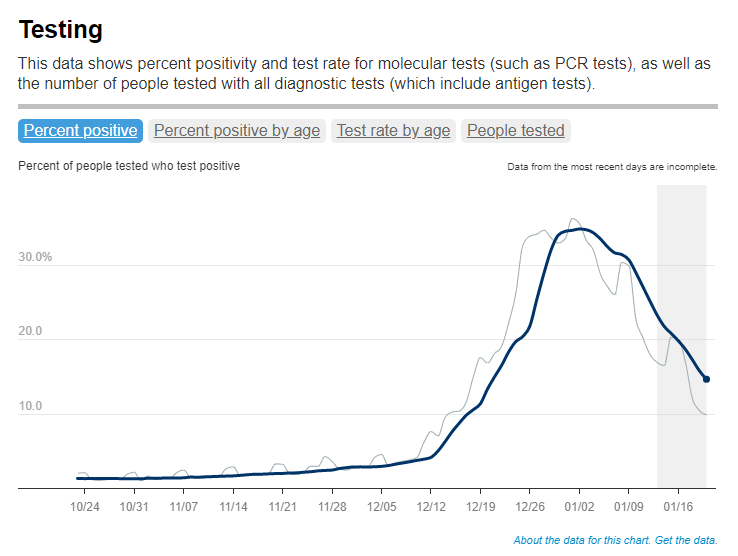
    Walgreens’ COVID-19 positivity tracker (which shares data from tests conducted by the pharmacy network) reported a slight decrease as well, from 43.6% in the week ending August 26 to 40.6% in the week ending September 2. Like the wastewater surveillance data, this information is preliminary but could be a good sign.

    Meanwhile, COVID-19 hospitalizations—a more delayed metric—are still increasing. About 2,500 people were newly hospitalized with COVID-19 each day in the week ending August 26. Hospitalizations have particularly gone up for older adults, according to data from insurance company Humana shared with STAT News.

    Many students went back to school last week, as the fall semester gets underway. This could be another driver of COVID-19 spread, as travel and gatherings were in the summer. Better air quality, masks, and other measures could make schools safer for students, teachers, staff, and their families.

  • National numbers, June 18

    National numbers, June 18

    COVID-19 hospital admissions and test positivity (from a select number of labs) are both trending slightly down. Chart from the CDC.

    In the past week (June 4 through 10), the U.S. reported about 6,600 new COVID-19 patients admitted to hospitals, according to the CDC. This amounts to:

    • An average of 950 new admissions each day
    • 2.0 total admissions for every 100,000 Americans
    • 8% fewer new admissions than last week (May 28-June 3)

    Additionally, the U.S. reported:

    • 4.0% of tests in the CDC’s surveillance network came back positive (a 5% decrease from last week)
    • A 5% lower concentration of SARS-CoV-2 in wastewater than last week (as of June 14, per Biobot’s dashboard)
    • 40% of new cases are caused by Omicron XBB.1.5; 26% by XBB.1.16; 21% by XBB.1.9 (as of June 10)

    Overall, the national COVID-19 picture remains fairly similar to what we’ve seen for the last few weeks. The U.S. is at a plateau of COVID-19 spread; we could see an increase this summer, but limited data make it hard to say for sure.

    New hospitalizations for COVID-19 continue to trend slightly down, with just under 1,000 patients admitted each day nationwide. This is the first time that the U.S. has passed this low benchmark since early in the pandemic, and suggests the protective value of vaccinations and prior infections for preventing severe symptoms.

    Biobot Analytics resolved the data issue I mentioned last week and provided updated wastewater numbers, also showing a continued (though slight) downward trend. Current national coronavirus levels are far below this time last year, when Omicron BA.2 variants were spreading widely, though they’re still above prior low points in 2020 and 2021.

    Biobot’s regional data also show mostly plateaus, though coronavirus levels may be increasing very slightly in the Northeast. The CDC’s wastewater data also suggest some places in the Northeast may be seeing increased viral spread, but it’s difficult to identify a clear regional trend.

    Trends from the CDC’s lab testing network similarly show a potential increase in COVID-19 spread in the Northeast over the last couple of weeks, though this testing trend has yet to translate to higher hospitalizations. In New York City, some of the sewersheds that reported recent coronavirus upticks now appear to be trending back down.

    Is a summer surge coming for the Northeast, and then the rest of the country? Right now, it’s quite hard to say; signals from wastewater and testing data are mixed, sometimes delayed, and tough to interpret in the short term. I’ll be watching closely to see how this changes in the coming weeks.

    Meanwhile, it’s important to remember that data are especially limited when it comes to Long COVID, one of the most severe (and most likely) impacts of coronavirus infection. As testing becomes less and less accessible, fewer people will recognize their infections—and, as a result, they may be less likely to recognize later symptoms as Long COVID. But those symptoms can still occur, and cause lasting damage.

  • National numbers, June 4

    National numbers, June 4

    Both hospital admissions and test positivity for COVID-19 have ticked down in recent weeks. Chart via the CDC.

    In the past week (May 21 through 27), the U.S. reported about 7,600 new COVID-19 patients admitted to hospitals, according to the CDC. This amounts to:

    • An average of 1,100 new admissions each day
    • 2.3 total admissions for every 100,000 Americans
    • 8% fewer new admissions than last week (May 14-20)

    Additionally, the U.S. reported:

    • 4.4% of tests in the CDC’s surveillance network came back positive (a 0% change from last week)
    • A 17% lower concentration of SARS-CoV-2 in wastewater than last week (as of May 31, per Biobot’s dashboard)
    • 54% of new cases are caused by Omicron XBB.1.5; 19% by XBB.1.16; 18% by XBB.1.9 (as of May 27)

    The COVID-19 plateau of the last few weeks continues at the national level, though experts are concerned that a summer surge could occur in parts of the country. Wastewater surveillance and testing data are indicating potential increases in the New York City region.

    Hospital admissions for COVID-19 remain at the levels we’ve seen throughout the spring, with about 1,100 people admitted nationwide each day last week. These numbers are similar to the hospitalizations reported at previous low points for COVID-19, in spring 2022 and 2021.

    Testing data from the CDC’s National Respiratory and Enteric Virus Surveillance System (NREVSS) also suggest a plateau: national test positivity didn’t change from last week to this week. While this CDC system includes a small fraction of the PCR labs that reported COVID-19 tests before the federal emergency ended, it’s still a helpful indicator for testing trends.

    Wastewater surveillance data from Biobot shows a similar picture, with coronavirus levels in sewage remaining consistent at the national level for the last two months. All four major regions of the country are trending down, according to Biobot’s analysis.

    But national data can hide more concerning trends at the local level. Wastewater data from New York City’s fourteen water treatment plants suggest potential increases in COVID-19 spread in the city and outlying suburbs over the last couple of weeks. The city’s wastewater data are reported with a delay (as of today, the most recent update was May 21), so I find it worrying that an increase may have predated the Memorial Day holiday. Test positivity data for the New York/New Jersey region suggest an uptick as well.

    NYC has been a bellwether for the rest of the U.S. at many points during the pandemic, and it’s possible that the city could see a surge before other regions again this summer. Health experts are also closely watching the South, where people gather indoors more in the summer.

    About 96% of Americans over age 16 have some COVID-19 protection from vaccination, past infections, or both, according to a recent CDC study. This protection will help many people avoid severe COVID-19 symptoms this summer even if they get infected. But Long COVID continues to be a risk—potentially even escalating with more infections.

  • National numbers, May 28

    National numbers, May 28

    The CDC is now updating its variant estimates every two weeks.

    In the past week (May 14 through 20), the U.S. reported about 8,300 new COVID-19 patients admitted to hospitals, according to the CDC. This amounts to:

    • An average of 1,200 new admissions each day
    • 2.5 total admissions for every 100,000 Americans
    • 11% fewer new admissions than last week (May 7-13)

    Additionally, the U.S. reported:

    • A 16% lower concentration of SARS-CoV-2 in wastewater than last week (as of May 24, per Biobot’s dashboard)
    • 54% of new cases are caused by Omicron XBB.1.5; 19% by XBB.1.16; 18% by XBB.1.9 (as of May 27)

    The COVID-19 plateau continues, with hospital admissions and viral levels in wastewater (the two main metrics I’m looking at these days) both trending slightly down at the national level. Newer Omicron variants are still on the rise, but don’t seem to be impacting transmission much yet.

    Hospitalizations continue to trend slightly down across the board, though hospitals are still reporting more than 1,000 new COVID-19 patients each day. The vast majority of U.S. counties have low hospitalization levels, according to the CDC, with just 14 counties in the medium or high categories.

    Coronavirus levels in wastewater are following a similar pattern: trending down very slightly, continuing the middling plateau of the last couple of months. All four major regions are still in this holding pattern, according to Biobot’s data.

    We have new variant data this week, as the CDC is now on a biweekly schedule for updates. XBB.1.5 caused just over half of new cases in the U.S. in the two weeks ending May 27, as it slowly gets outcompeted by newer versions of Omicron. XBB.1.16 and XBB.1.9 continue to rise, causing 19% and 18% of hew cases respectively.

    XBB.1.16 is most prevalent on the West Coast, the Northeast, and the Gulf Coast states, while XBB.1.9 is most prevalent in the Midwest, according to the CDC—though these estimates are becoming less reliable over time, since so few COVID-19 samples are sequenced.

    The CDC has also recently added national and regional COVID-19 test positivity data back to its dashboard, representing tests conducted by labs in the CDC’s National Respiratory and Enteric Virus Surveillance System.

    Nationally, test positivity is trending down, at just under 5% of COVID-19 tests (in this lab network) returning positive results in the most recent week of data. Test positivity is trending up slightly in the Northeast and New York/New Jersey regions; I’ll be following to see if this continues in the coming weeks.

    Finally, a bit of good news: excess deaths in the U.S. have returned to baseline in the last couple of months. While hundreds are still dying from COVID-19 every day, the excess death trend suggests that the disease is currently not causing a significant ripple effect on overall mortality the way that it did in earlier stages of the pandemic. (Of course, this could change with a new surge.)

  • Sources and updates, February 19

    Just a couple of updates today!

    • Test positivity will become less reliable after PHE ends: CBS News COVID-19 reporter Alexander Tin flagged last week that, after the federal public health emergency for COVID-19 ends this spring, private labs that process PCR tests will no longer be required to report their results to state health departments. States will still report any results they get to the CDC, but federal officials expect that this data will become much less reliable, according to a background press briefing from the Department of Health and Human Services (HHS). Case data are already unreliable; soon, we won’t even have consistent test positivity data to tell us how unreliable they are. This may be one of several data sources that get worse after the end of the PHE.
    • HHS is supporting improved healthcare data sharing: The inability to connect different health records systems (or lack of interoperability, to use the technical term) has been a big problem during the pandemic, as researchers and health officials often couldn’t answer questions that require multiple health datasets. HHS has taken some steps to improve this situation, while also making it easier for individual patients to access their personal records. Most recently, HHS announced that it’s chosen six companies and organizations to develop data-sharing platforms, according to POLITICO. It’ll take some time for these organizations to start actually sharing data, but I’m glad to see any movement on this important issue.
    • Yes, vaccination is still the best way to get protected from COVID-19: A new study from the Institute for Health Metrics and Evaluation, published in the Lancet this week, has been making the rounds on social media recently. Anti-vax pundits are claiming the study shows that immunity from a prior coronavirus infection is more effective than immunity from vaccination at preventing future severe COVID-19. While the study does show that a prior infection can be helpful, the authors found a significant drop in the value of this type of protection after Omicron variants started circulating in late 2021. And, as some commentators have pointed out, infections can always lead to severe symptoms and Long COVID—the risks from vaccination are much lower. Basically, this XKCD comic remains accurate.

  • FAQ: A refresher on test positivity rates

    FAQ: A refresher on test positivity rates

    Test positivity trends for New York City, calculated and reported by the city health agency. Chart retrieved on January 23.

    I’ve recently been getting a lot of questions about test positivity rates, both from COVID-19 Data Dispatch readers and from friends outside this project, which reminded me of just how confusing this pandemic metric can be. So, here’s a brief FAQ post about test positivity; if you have more questions, shoot me an email!

    What is a test positivity rate?

    A test positivity rate is calculated through simple division: the number of positive tests counted in a particular region or setting during a particular period of time, over the number of total tests (positive and negative) conducted during that same period.

    Where do test positivity rates come from?

    While the test positivity rate calculation may seem simple, matching together the right numbers for that numerator and denominator can get pretty tricky. This is because, at the federal level as well as at most state and local health departments, positive tests and total tests are reported through different systems.

    Positive tests—also known, more simply, as cases—are prioritized for reporting. This is because public health departments need to know how many cases they are currently dealing with for contact tracing, potential hospital utilization in the coming weeks, and other crucial health system reasons. If a health department is pressed for time during a surge or coming back from a holiday break, it will analyze and report out case data before going through total test data. Similarly, many labs report their positive tests to health agencies separately from (and earlier than) total tests.

    As a result, simply dividing the new cases reported on a particular day over the new tests reported that day often won’t give you an accurate test positivity figure. Instead, the data analysts that calculate these rates typically match up the dates that tests were conducted. So, instead of dividing “all cases reported on Tuesday” over “all tests reported on Tuesday,” you’d divide “all tests conducted on Tuesday that returned positive results” over “total tests conducted on Tuesday.” This calculation provides a more accurate picture of test positivity.

    Also, different states and localities might report tests using different units, like “tests conducted,” “people tested,” and “testing encounters”—making it difficult to compare test positivity rates across states. This was a larger problem earlier in the pandemic; I recommend reading this excellent COVID Tracking Project analysis post for more info on the issue.

    How do you know a test positivity figure is reliable?

    As I explained in a recent post about the John Hopkins University (JHU) dashboard, the test positivity rates that appear on national dashboards often are not reliable because they fail to take these timing issues into account. A dashboard like JHU’s, which automatically scrapes data from state health agencies, does not have the backend information about the dates tests were conducted needed to calculate accurate positivity rates.

    JHU recently changed its test positivity calculations to better address differing testing units across states. Still, as the team behind this dashboard explains in a blog post, a lack of standardization across how states report their testing data makes it difficult to calculate positivity rates that can be accurately compared between jurisdictions.

    For that reason, I tend to trust test positivity rates calculated by individual state and local health agencies over those calculated by large, aggregating dashboards. For example, the NYC health department reports its own test positivity rate and does so with a three-day lag, in order to allow time for matching testing dates to case dates.

    In addition, I would be wary of test positivity rates that are calculated for a longer period than one or two weeks. Test positivity, as a metric, is meant to be an indicator of the current situation in a state, region, or a specific setting like a university campus; when reported for a longer period (like a month) or cumulatively, this metric doesn’t tell you anything useful.

    If you’re looking for a national test positivity rate source, the HHS’s Community Profile Reports include these figures for states, counties, metro areas—albeit with some reporting delays and gaps in certain states.

    How do you interpret test positivity rate data?

    I find this explanation from the COVID Tracking Project very helpful:

    Test positivity can help us understand whether an area is doing enough tests to find its COVID-19 infections. The metric is widely used by local, state, and federal agencies to roughly gauge how well disease mitigation efforts are going. Put simply, when test positivity is high, it’s likely that not enough tests are being done and that most tests that are done are performed on symptomatic people. Both of these factors—insufficient testing and only testing people who feel sick—make it very likely that many cases are going undetected.

    What would we consider a “high” test positivity rate? The CDC threshold here is over 10%; such a positivity rate means that one in ten tests conducted are returning positive results, indicating a lot of symptomatic people are getting tested for COVID-19 and a lot of cases are going undetected. A region with a positivity rate over 10% should step up its testing efforts and encourage asymptomatic people to get tested for surveillance purposes.

    On the other end of the spectrum, 3% and 5% are commonly used as thresholds for low test positivity. The specific number might depend on an institution’s testing capacity; at a business that regularly tests all of its workers and is already looking for asymptomatic cases, a test positivity over 2% might already be cause for concern.

    Generally, though, if this number is under 5%, it’s a good indicator that the region or setting has high enough test capacity to identify asymptomatic cases—and the majority of cases are being caught.