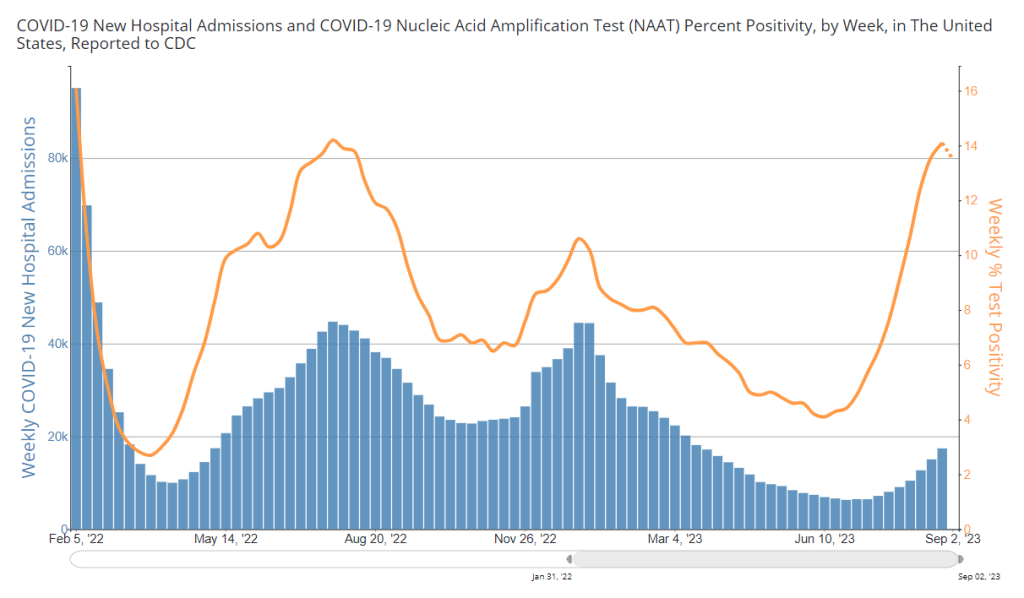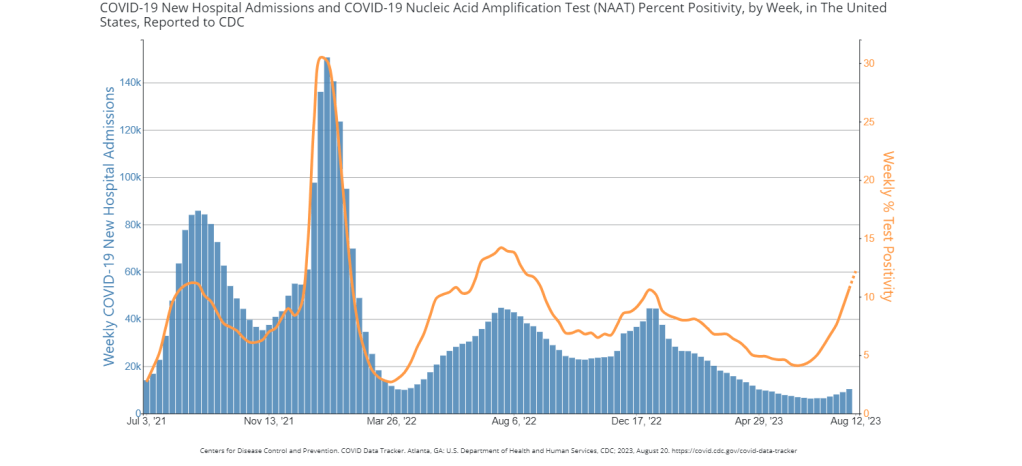

During the most recent week of data available (September 3-9), the U.S. reported about 20,500 new COVID-19 patients admitted to hospitals, according to the CDC. This amounts to:
- An average of 2,900 new admissions each day
- 6.3 total admissions for every 100,000 Americans
- 8% more new admissions than the prior week (August 27-September 2)
Additionally, the U.S. reported:
- 12.5% of tests in the CDC’s surveillance network came back positive
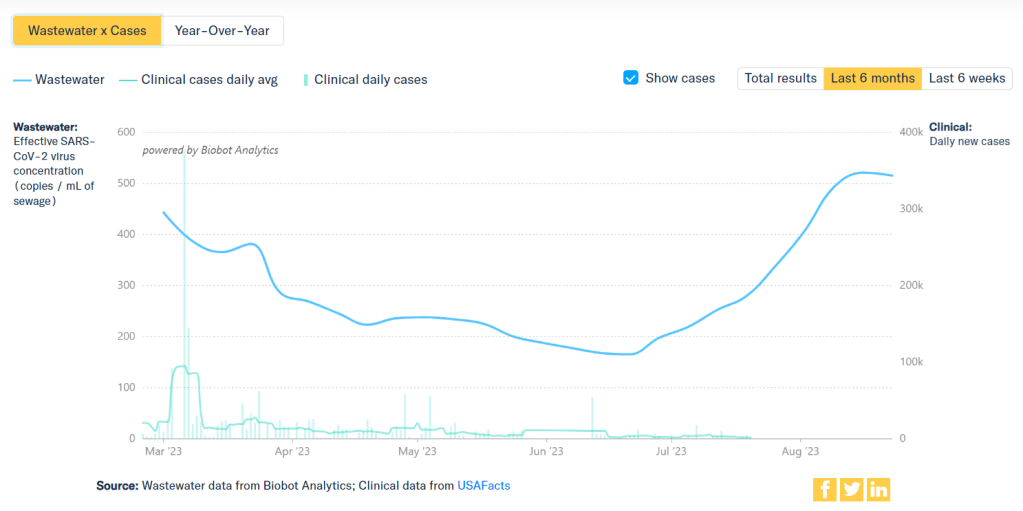
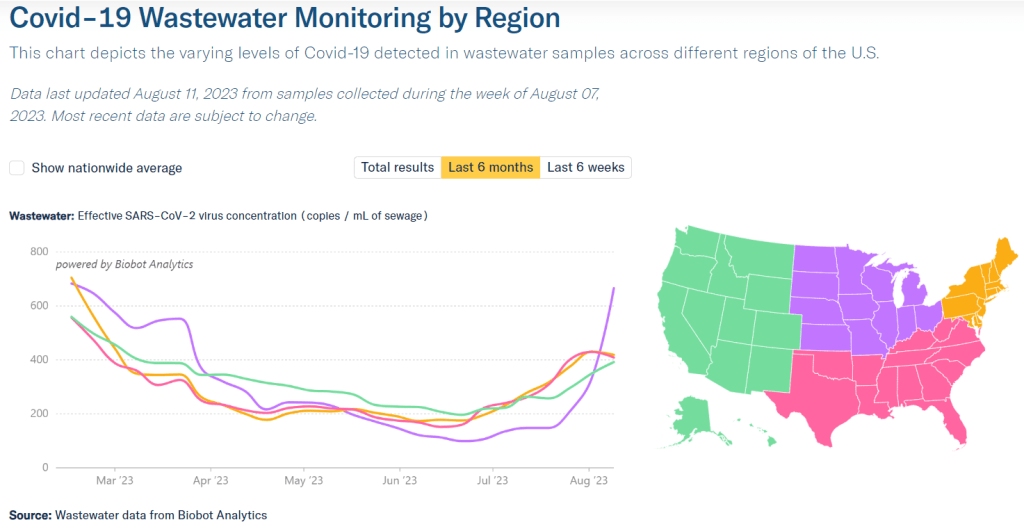
- A 5% lower concentration of SARS-CoV-2 in wastewater than last week (as of September 13, per Biobot’s dashboard)
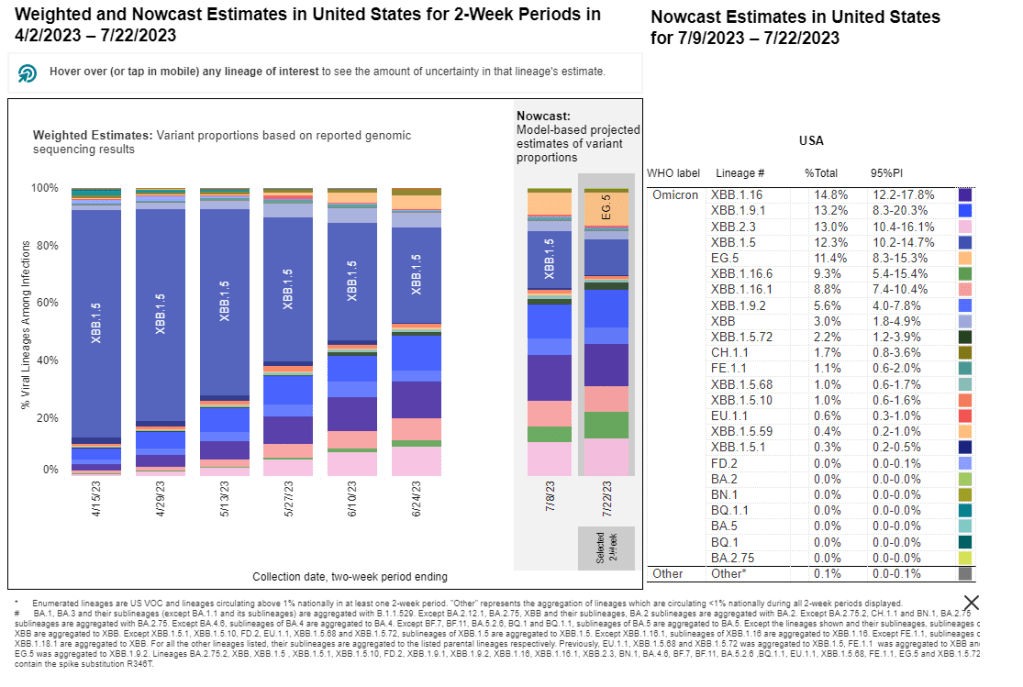
- 25% of new cases are caused by Omicron EG.5, 24% by XBB.1.6, 14% by FL.1.5.1 (as of September 16)
The COVID-19 plateau that I’ve described over the last couple of weeks continues, with wastewater and test positivity data showing that viral spread has slowed in much of the U.S. However, this is likely just a lull before respiratory virus season starts in earnest.
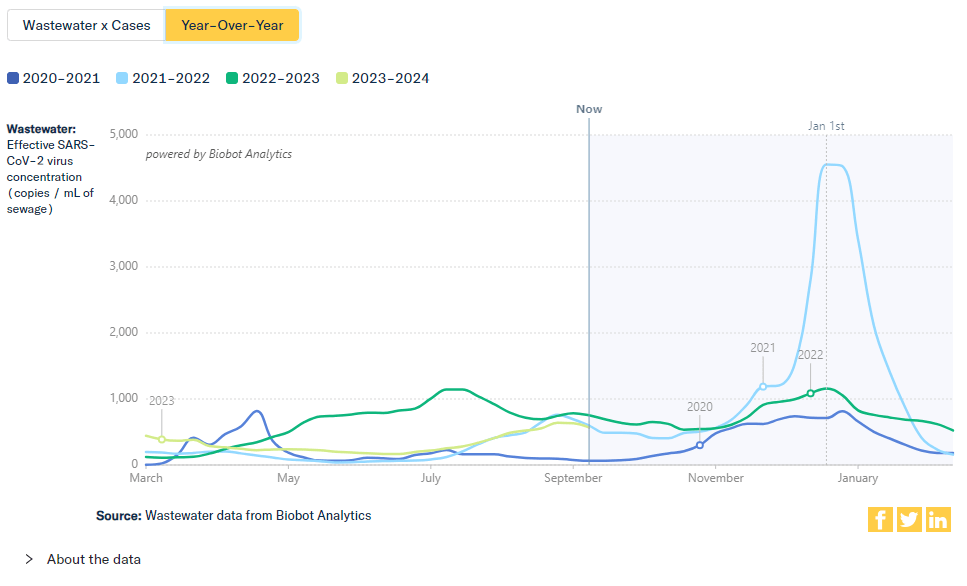
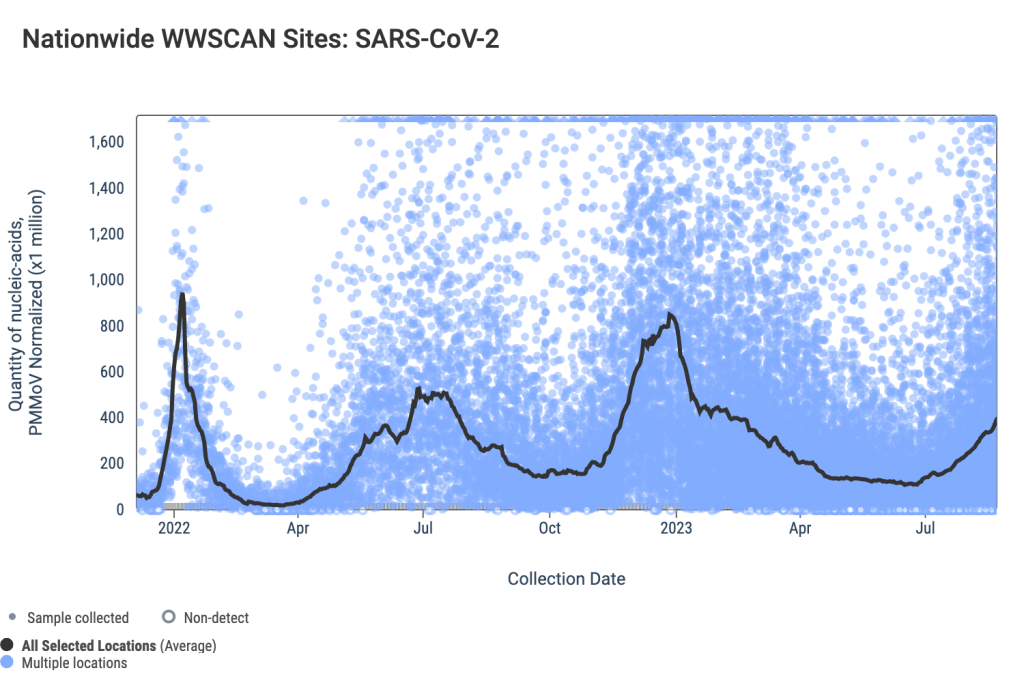
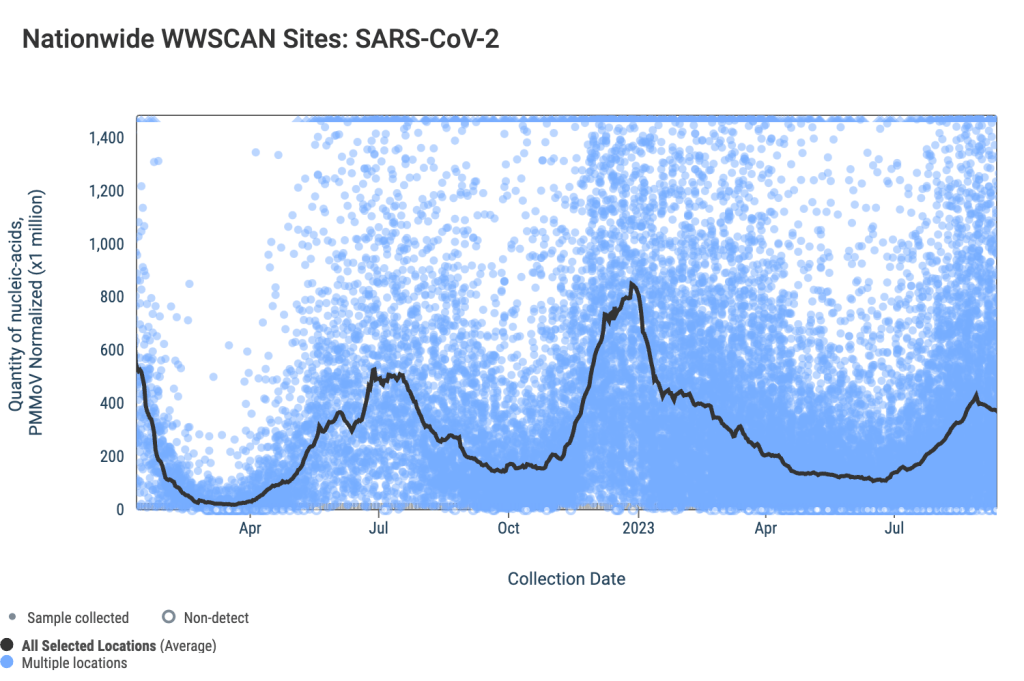
National wastewater data from the WastewaterSCAN project suggest that COVID-19 spread has leveled off in recent weeks, after rising throughout July and August. Biobot Analytics’ data present a similar picture, though the company didn’t update its data this past Thursday (so the most recent numbers are as of September 13).
SCAN and Biobot’s data both show plateaus or declines in all four major regions. But the Northeast and Midwest are reporting more coronavirus in their wastewater sites (at least, in aggregate) than the South and West Coast.
Some sewersheds in the Northeast and Midwest regions have reported increases in recent weeks, while others are leveling off. In Boston and New York City, for example, most sewersheds report declines or plateaus; while sewersheds in Kansas City and Lawrence, Kansas report upward trends.
To find wastewater data for your region, check the Biobot, WastewaterSCAN, and CDC dashboards. I maintain a list of national, state, and a few local wastewater surveillance dashboards on the COVID-19 Data Dispatch website.
National COVID-19 test positivity is also trending slightly down, according to the CDC’s surveillance network. Test positivity fell slightly to 12.5% in the week ending September 16, from over 14% in the prior three weeks. Walgreens’ testing data show a continued decline in positivity as well.
Hospital admissions for COVID-19 are still going up, according to the CDC—though these data are reported with a significant delay. More than 20,000 people were hospitalized with COVID-19 during the week ending September 9, demonstrating that this disease can still cause severe symptoms. And the CDC has no surveillance data on Long COVID, making that similarly-harmful outcome less visible.
It’s now officially fall, and October marks the start of the respiratory virus season—meaning we can expect more spread of the flu, RSV, and other pathogens along with COVID-19. This is a good time to stock up on high-quality masks, air filters, and other tools that help protect against multiple diseases.