Tag: Source callout

  • COVID source callout: CDC race/ethnicity data

    COVID source callout: CDC race/ethnicity data

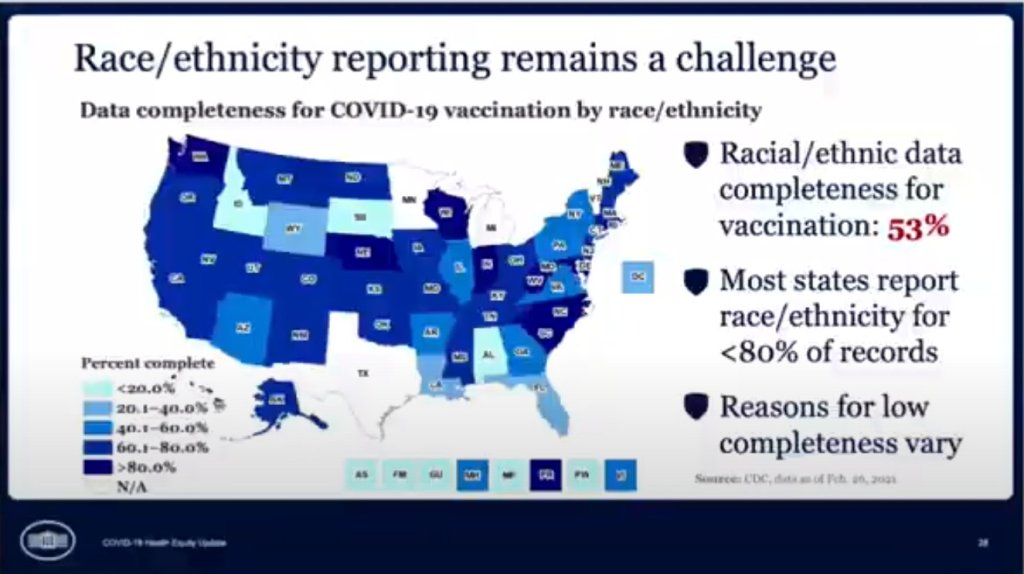
    In the White House COVID-19 briefing this past Monday, equity task force director Dr. Marcella Nunez-Smith showed, for one fleeting minute, a slide on completeness of state-by-state data on vaccinations by race and ethnicity. The slide pointed out that racial/ethnic data was only available for 53% of vaccinations, and most states report these data for fewer than 80% of records.

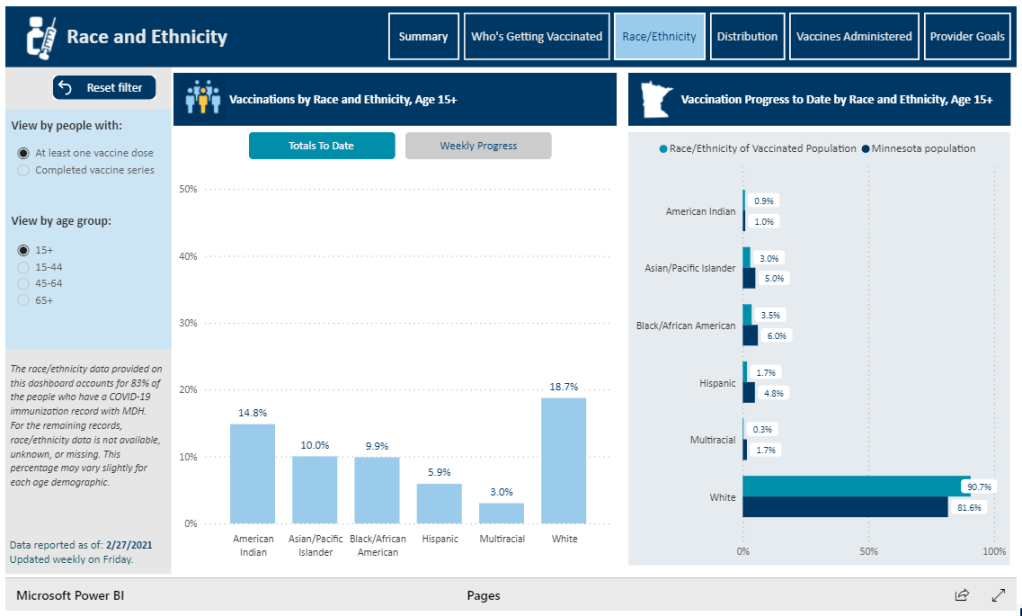
    Still, though, this slide demonstrated that the CDC does have access to these crucial data. As we’ve discussed in past issues, while many states (45 plus DC) are now reporting vaccinations by race/ethnicity, huge inconsistencies in state reporting practices make these data difficult to compare. It is properly the job of the CDC to standardize these data and make them public.

    The CDC is actually under scrutiny right now from the HHS inspector general for failing to collect and report complete COVID-19 race/ethnicity data. You can read POLITICO for more detail here; suffice it to say, I’m excited to see the results of this investigation.

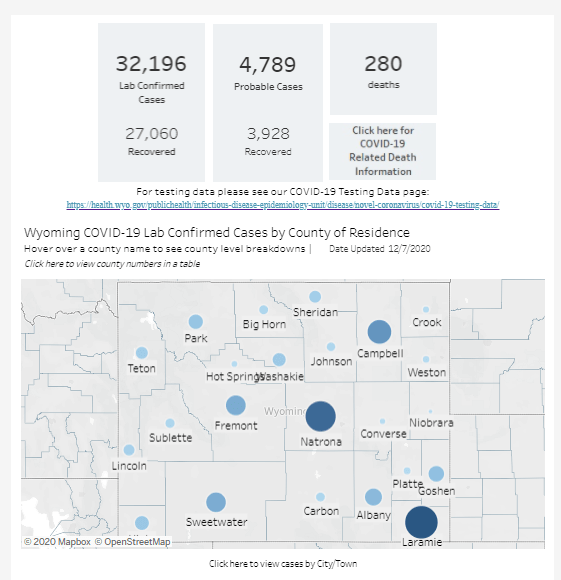
    Also, while we’re at it, let’s publicly shame the five states that are not yet reporting vaccinations by race/ethnicity on their own dashboards. Get it together, Hawaii, Montana, New Hampshire, South Dakota, and Wyoming!

  • COVID source callout: Age brackets

    COVID source callout: Age brackets

    As of yesterday, 45 states and D.C. are reporting vaccinations by race and ethnicity. (See the CDD’s full annotations here.) This is great—with five more states, we’ll have national coverage. But the lack of standardization in how states report these figures leaves much to be desired.

    One of the newest states to start reporting race/ethnicity vaccination data is Minnesota. At a glance, the Race/Ethnicity tab of the state’s vaccine data dashboard looks comprehensive: it includes demographic data stratified by age, as well as a bar chart that compares the population that’s been vaccinated to Minnesota’s population overall.

    Race/Ethnicity tab on Minnesota’s vaccine dashboard, showing percent comparisons.

    But a closer examination shows that the age groups reported on this Race/Ethnicity tab (15-44, 45-64, 65+) don’t match the age groups used to report vaccinations by age on a different tab (16-17, 18-49, 50-64, 65+). So if a journalist or researcher were trying to analyze Minnesota’s vaccine demographics, they wouldn’t be able to derive whole numbers from these percentages.

    This is one small example of a common issue across state vaccine demographic reporting—and demographic reporting in general. When categories don’t match, it’s difficult to make comparisons, and age brackets are particularly heinous. We need the CDC to start providing vaccine demographics by state, like, last December.

  • COVID source callout: Iowa

    Usually, we only update our K-12 school COVID-19 data annotations every two weeks. But it came to my attention during a COVID Tracking Project shift yesterday that Iowa has taken down a page on its dashboard that used to report test positivity by school district. The page now goes to a 404 error, and there’s no mention of school data elsewhere on the state’s COVID-19 website.

    Yes, test positivity is a fraught metric—it should be used with a combination of other factors, not as a sole determinant of whether a school district can open for in-person learning. But it’s still troubling that this state took down the closest thing it had to school data reporting. What’s up, Iowa?

  • COVID source callout: Andrew Cuomo

    Usually when we do a COVID source callout, we’re putting our sights on a dashboard that’s actually five separate dashboards or a state that likes to surprise us when they update their dataset. This is to say that, usually, we don’t call out an actual source of coronavirus. 

    But that’s what New York Governor Andrew Cuomo apparently wants to be when he grows up, as he opened up limited indoor dining on February 12th for New York City, where Betsy and I both live. We talked last week about a frankly terrifying ProPublica article that warned about the dangers of reopening indoor dining and loosening guidelines in general, not only with variants on the rise, but with most people in the dark of just how on the rise they are. So why, dear god why, would you decide this is the time to LOOSEN restrictions? 

    Look, I can make a few guesses. As much as I think Cuomo is acting really really stupidly, I don’t think he’s an idiot. There’s definitely political and economic pressure, along with a court ruling in mid-January that said there was no “rational basis” for keeping things closed when hospitalizations and deaths are falling – this led to indoor dining resuming in most of the state

    But that court ruling did not affect New York City, or wedding capacity restrictions, which are also being loosened in March in the pursuit of “marital bliss.” This is just irresponsible; “marital bliss” isn’t worth it even when there isn’t a deadly pandemic, as Cuomo himself clearly knows. In the announcement, he suggested you could “propose on Valentine’s Day and then you can have the wedding ceremony March 15, up to 150 people. People will actually come to your wedding because you can tell them with the testing it will be safe.” Cuomo is not only about to open up the possibility for more serious supersreader events, he’s also about to rob every introvert of their best excuse for skipping Aunt Marsha’s wedding since she said she’d be serving roasted pangolin. Unforgivable. 

    So apparently the biggest city in the country can reopen indoor dining and have weddings on the horizon when, again, we don’t even know just how much these variants are going to screw us over. I knew Tom’s Restaurant was a dangerous game for my own health, but they’re about to seriously expand their blast radius. 

  • COVID source callout: Wyoming

    COVID source callout: Wyoming

    Look, I like Wyoming’s COVID-19 dashboard. I like that it’s not actually one dashboard, but five dashboards—one for cases, one for deaths, one for tests, one for hospitals, one for county-level data—each of which has its own update schedule. I like that I need to hover over bars and download crosstabs in order to obtain precise figures. I like that sometimes the percentages add up to 100% and sometimes they don’t.

    I find it charming to need five or six tabs open every time I check the state. It’s a nice challenge. Those states that include all their data on one page, they make things too easy!

  • COVID source callout: Missouri

    COVID source callout: Missouri

    In some states, if you would like to see the numbers of COVID-19 cases and deaths for different racial and ethnic groups, you can simply look at tables clearly presented on the state’s public health dashboard.

    In Missouri, it is not so easy. Missouri presents its race and ethnicity data in pie charts, showing the percents of cases and deaths that are reported in each category. A lot of states use this type of pie chart presentation, as it draws attention to the most impacted groups. But pie charts have a significant drawback: smaller demographic groups, such as Native American/Alaska Native and Native Hawaiian/Pacific Islander, are relegated to tiny slices that are nearly impossible to see. These groups may be disproportionately impacted by COVID-19, but the pie chart makes them seem unimportant.

    Screenshot of Missouri’s demographic COVID-19 data tab, taken on November 8.

    It takes several rounds of hovering, recording percentages, and running calculations to determine COVID-19 case and death numbers for those smaller racial groups in Missouri. Demographic data should not be this complicated.

  • COVID source callout: Iowa

    To the tune of “Iowa Stubborn” from Meredith Wilson’s The Music Man:

    And we’re so good at updating,
    We can shift our case count
    Twice every hour
    With no timestamp to make a dent.
    But we’ll give you our case counts,
    And demographics to go with it
    If you should love hovering over percents!

    So what the heck, you’re welcome,
    Glad to have you checking,
    Even though we may not ever mention it again.
    You really ought to give Iowa… a try.

    Parody lyrics aside, Iowa’s frequent dashboard updates are very impressive. But a little transparency about precisely when those updates occur would go a long way.

  • COVID source callout: Maine

    COVID source callout: Maine

    I visited Maine this week, so it seems fitting to evaluate the state’s COVID-19 dashboard on my way home.

    Screenshot of Maine’s dashboard. Look at how clean this is!

    Maine was actually one of my favorite state dashboards for a while. Everything is on one page. A summary section at the top makes it easy to see all the most important numbers, and then there’s a tabbed panel with mini-pages on trends and demographic data. It’s all fairly easy to navigate, and although there was a period of a few weeks where Maine’s demographic data tab never loaded for me, I never held that against the state. Maine has a clear data timestamp, and it was also one of the first states to properly separate out PCR and antibody testing numbers.

    Now, however, Maine is lumping PCR and antigen tests. This means that counts of these two test are being combined in a single figure. Both PCR and antigen tests are diagnostic, but they have differing sensitivities and serve different purposes, and should be reported separately; to combine them may lead to inaccurate test positivity calculations and other issues. I expect this type of misleading reporting from, say, Florida or Rhode Island, but not from Maine. Be better, Maine!

  • COVID source callout: Utah

    Utah was one of the first states to begin reporting antigen tests back in early August. The state is also one of only three to report an antigen testing time series, rather than simply the total number of tests conducted. However, the format in which Utah presents these data is… challenging.

    Rather than reporting daily antigen test counts—or daily PCR test counts, for that matter—in a table or downloadable spreadsheet, Utah requires users to hover over an interactive chart in an extremely precise fashion. Interactive charts are useful for visualizing data, but far from ideal for accessibility.

    Hot tip for anyone interacting with this chart: you can make your life easier by clicking “Compare data on hover,” toggling the chart to show all four of its daily data points at once. (Sad story: I did not learn this strategy until I’d already spent an hour carefully zooming in and around the chart to record all of Utah’s antigen test numbers.)

    In related news: keep an eye out for a COVID Tracking Project blog post on antigen testing, likely to be published in the coming week.

  • COVID source callout: Texas

    Someday, I will write a parody stage play called “Waiting for Texas.” It will feature a squadron of diligent COVID Tracking Project volunteers, eagerly refreshing Texas’ COVID-19 dashboard, wondering if today, maybe, will be the day that the site updates by its promised time of 4 PM Central (5 PM Eastern).

    This past weekend, I was not so lucky. Texas’ data came late enough on Saturday that the Project decided to publish its daily update without this state. How late did it come? 6:30 PM Central, or 7:30 PM Eastern. I understand the procrastination, Texas (see: the sending time of this newsletter today), but a little heads up might be nice next time.