As of yesterday, 45 states and D.C. are reporting vaccinations by race and ethnicity. (See the CDD’s full annotations here.) This is great—with five more states, we’ll have national coverage. But the lack of standardization in how states report these figures leaves much to be desired.
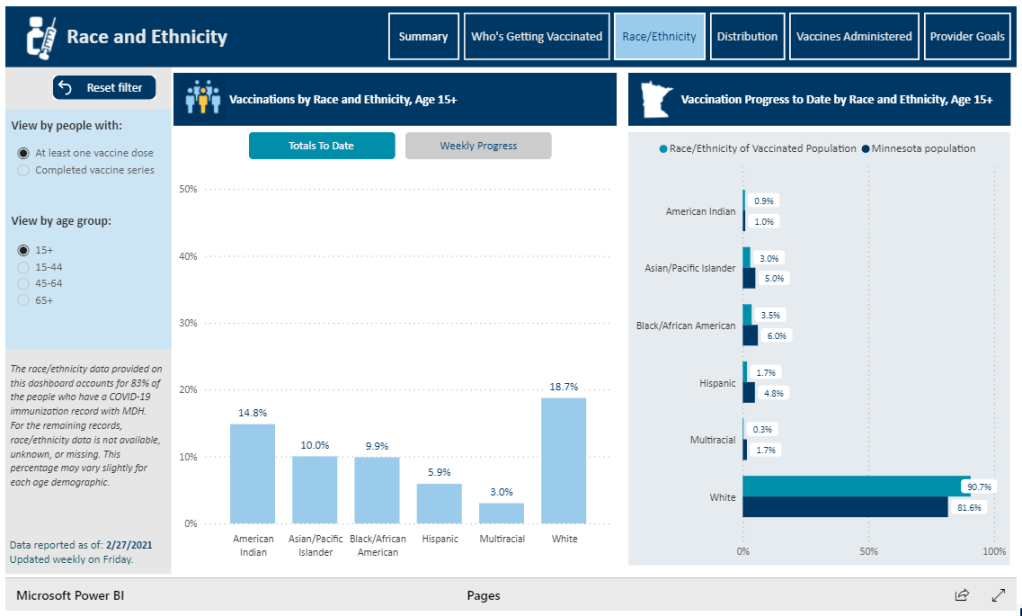
One of the newest states to start reporting race/ethnicity vaccination data is Minnesota. At a glance, the Race/Ethnicity tab of the state’s vaccine data dashboard looks comprehensive: it includes demographic data stratified by age, as well as a bar chart that compares the population that’s been vaccinated to Minnesota’s population overall.

But a closer examination shows that the age groups reported on this Race/Ethnicity tab (15-44, 45-64, 65+) don’t match the age groups used to report vaccinations by age on a different tab (16-17, 18-49, 50-64, 65+). So if a journalist or researcher were trying to analyze Minnesota’s vaccine demographics, they wouldn’t be able to derive whole numbers from these percentages.
This is one small example of a common issue across state vaccine demographic reporting—and demographic reporting in general. When categories don’t match, it’s difficult to make comparisons, and age brackets are particularly heinous. We need the CDC to start providing vaccine demographics by state, like, last December.

Leave a comment