Tag: October data

  • National numbers, October 29

    National numbers, October 29

    Biobot Analytics resumed weekly updates to its COVID-19 wastewater dashboard this week.

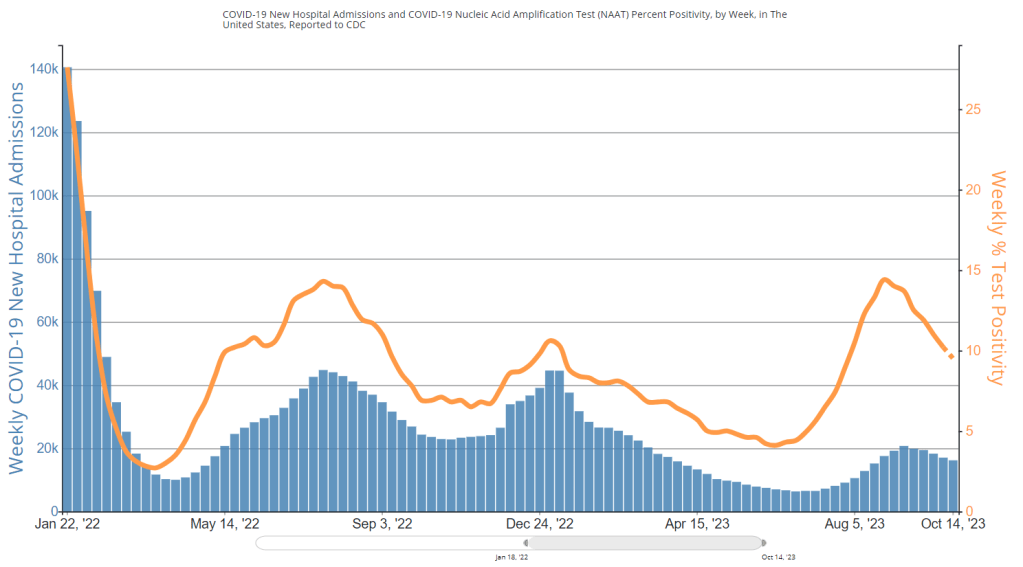
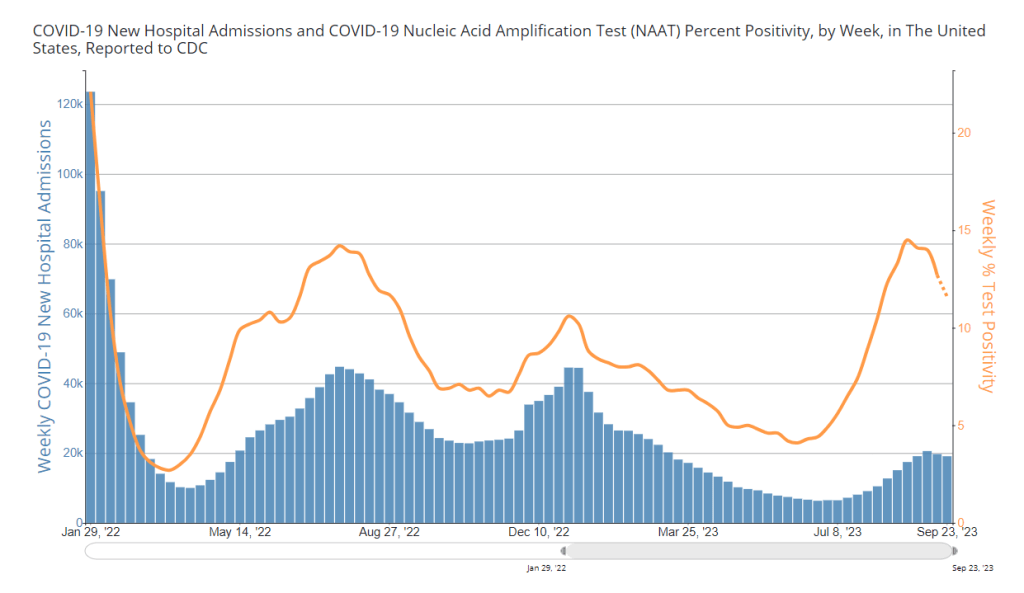
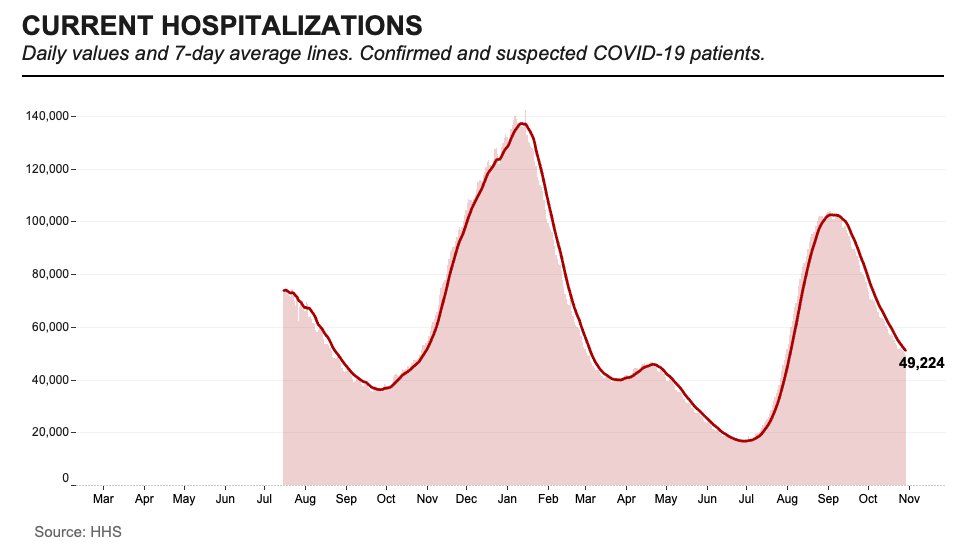
    During the most recent week of data available (October 15-21), the U.S. reported about 16,200 new COVID-19 patients admitted to hospitals, according to the CDC. This amounts to:

    • An average of 2,300 new admissions each day
    • 4.9 total admissions for every 100,000 Americans
    • 0% fewer new admissions than the prior week (October 8-14)

    Additionally, the U.S. reported:

    • 8.7% of tests in the CDC’s surveillance network came back positive
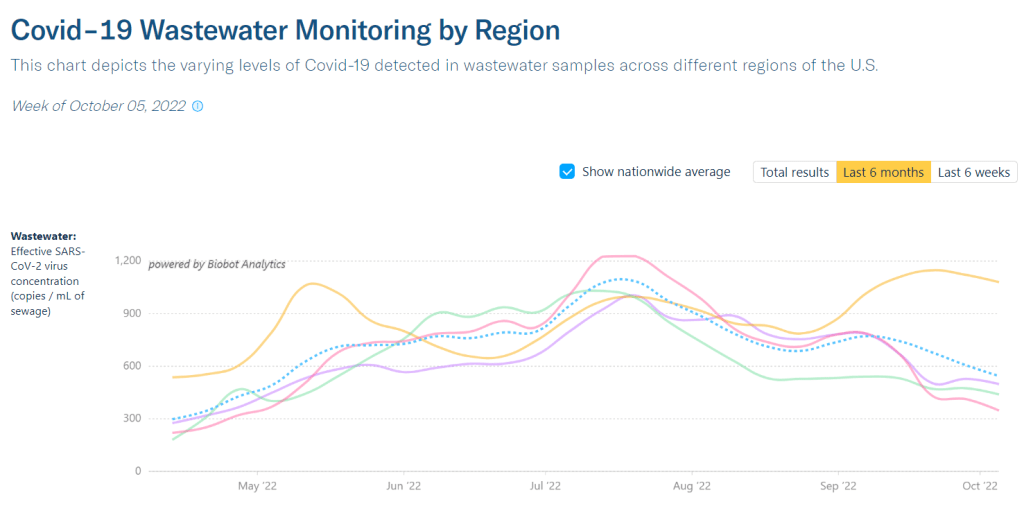
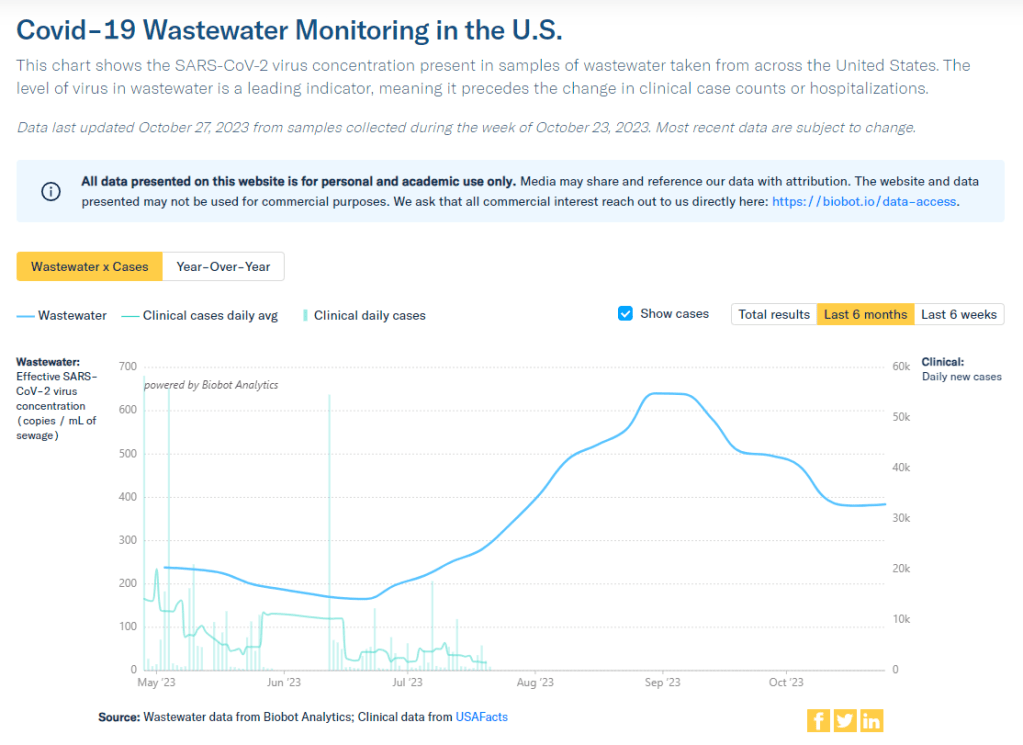
    • A 1% higher concentration of SARS-CoV-2 in wastewater than the prior week (as of October 25, per Biobot’s dashboard)
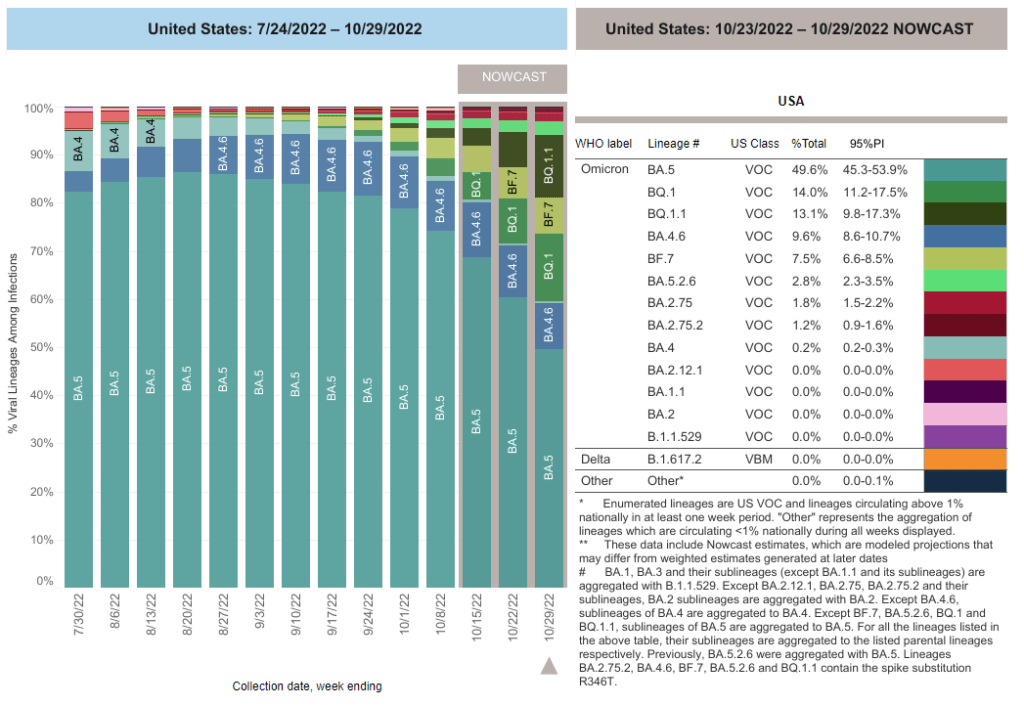
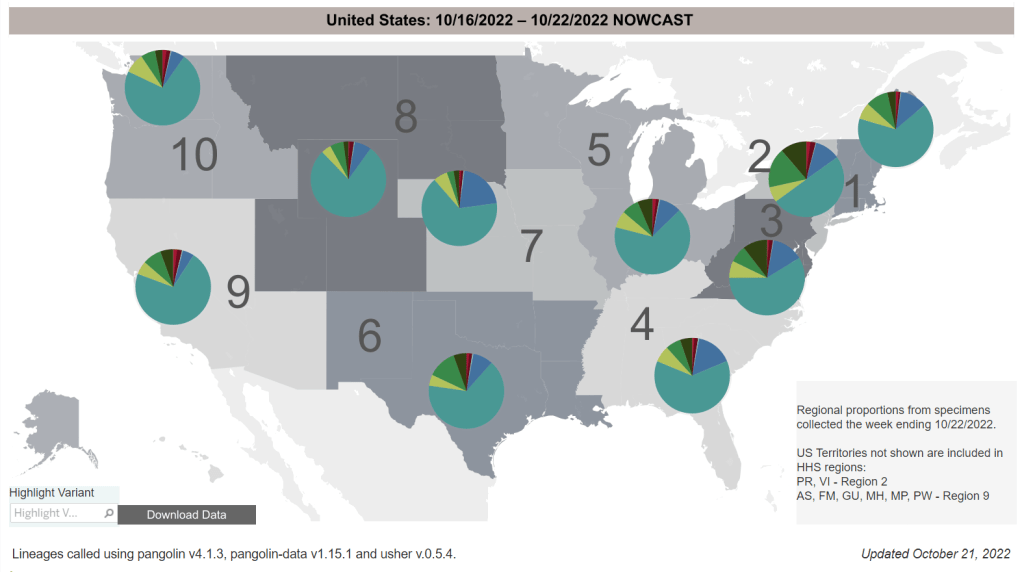
    • 25% of new cases are caused by Omicron HV.1, 22% by EG.5, 17% by XBB.1.6, 12% by FL.1.5.1 (as of October 28)

    Our mid-fall COVID-19 lull continues in the U.S., with major metrics showing plateaus in disease spread nationally. A disruption in wastewater surveillance may make it harder to follow these trends in the coming weeks.

    Biobot Analytics has resumed weekly updates to its COVID-19 dashboard as of this Friday. While the company is no longer testing about 400 sites in the CDC’s surveillance network due to a contract switch, its independent network still represents more than 100 counties across the U.S., according to Biobot’s Twitter.

    Meanwhile, Biobot has filed a formal protest about the CDC contract change. According to reporting by POLITICO, the new contractor, Verily, cannot start testing at those 400 wastewater treatment sites while the Government Accountability Office (GAO) evaluates Biobot’s appeal. The protest will extend the data gap that I described in my previous posts about this contract, possibly delaying surveillance for months as we head into the winter respiratory virus season.

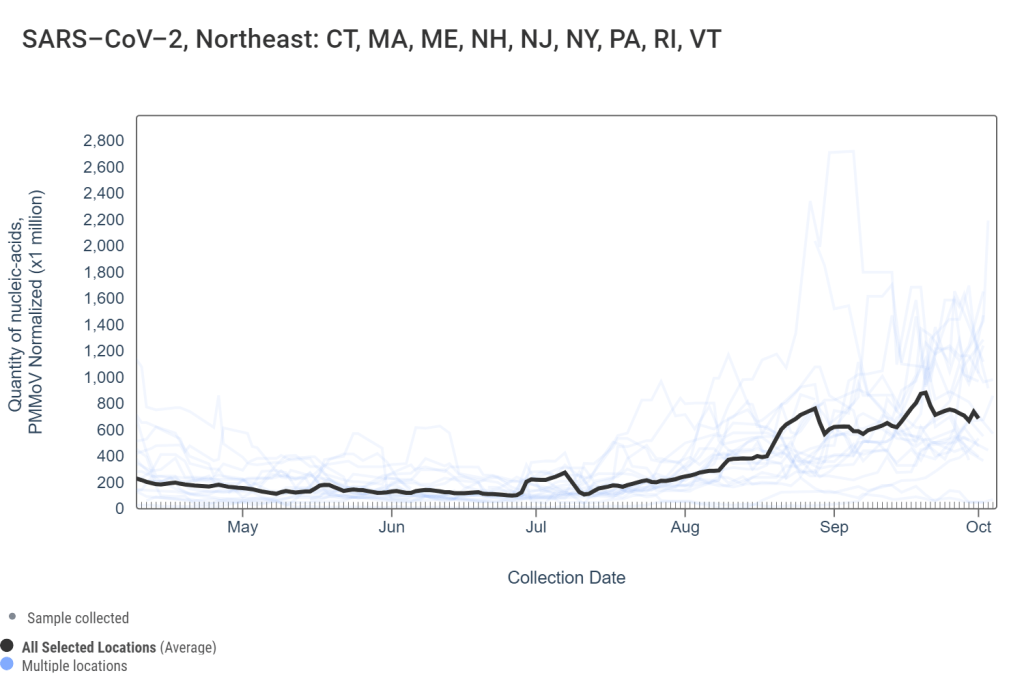
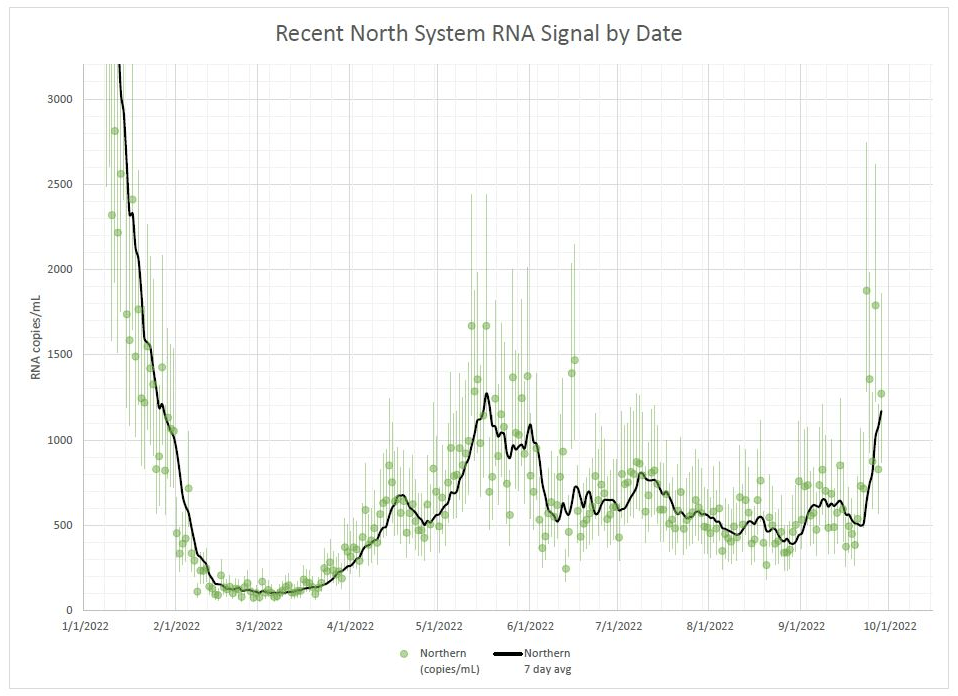
    With these gaps in mind, here’s what the limited wastewater surveillance data tell us. Biobot’s national dashboard shows declines in coronavirus spread from mid-September through mid-October, followed by a very slight (1%) increase in the week ending October 25. Regionally, spread is down in the Northeast and West Coast and up slightly in the South and Midwest.

    WastewaterSCAN’s latest update shows similar trends: a decline nationally in the last month, and recent upticks in the Midwest, South, and possibly West as well. There’s not a clear pattern as to which states are seeing more increases right now; it’s more of a slight uptick across the board, as the WWSCAN team describes the trend.

    Test positivity and hospitalization data from the CDC also suggest lulls. New hospitalizations for COVID-19 have not changed significantly in the last couple of weeks, staying at about 2,300 per day. The variant picture is still dominated by versions of XBB; more on this below.

    As we get further into respiratory virus season, COVID-19 is likely to join forces with other common pathogens to put pressure on the healthcare system, just like we saw last year. But the tools needed to control those viruses’ spread are less available than ever, with masks, tests, vaccines, and surveillance data all harder to find.

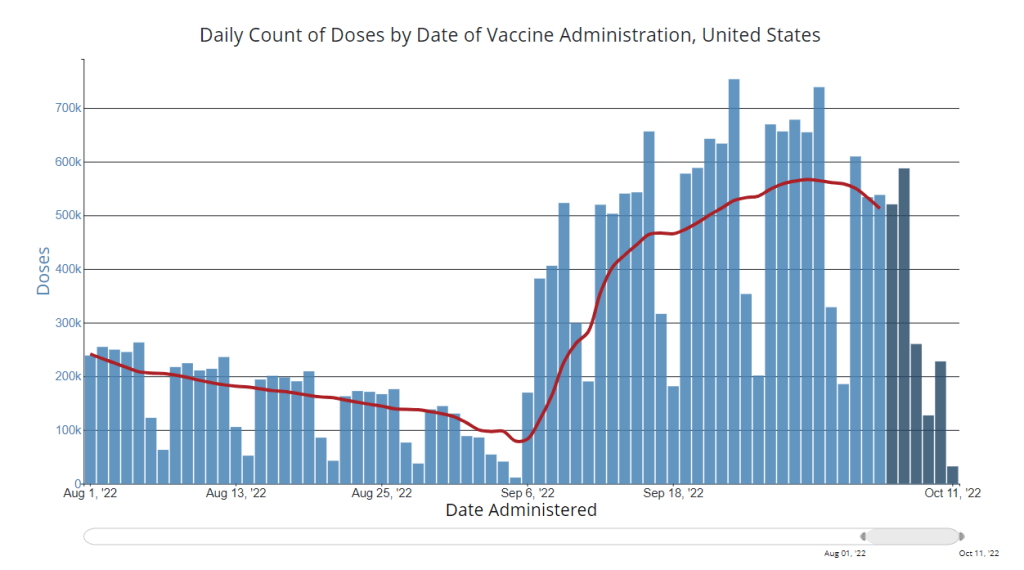
    So far, just 12 million people have received this year’s COVID-19 vaccines, per CDC estimates. POLITICO reports that CDC Director Dr. Mandy Cohen considers this number “on track” for the year, suggesting the agency is unlikely to put more resources into making the shots accessible.

  • National numbers, October 22

    National numbers, October 22

    Test positivity has dipped below 10% for the first time since July, per CDC data.

    During the most recent week of data available (October 8-14), the U.S. reported about 16,200 new COVID-19 patients admitted to hospitals, according to the CDC. This amounts to:

    • An average of 2,300 new admissions each day
    • 4.9 total admissions for every 100,000 Americans
    • 5% fewer new admissions than the prior week (October 1-7)

    Additionally, the U.S. reported:

    • 9.5% of tests in the CDC’s surveillance network came back positive
    • A 14% lower concentration of SARS-CoV-2 in wastewater than the prior week (as of October 11, per Biobot’s dashboard)
    • 24% of new cases are caused by Omicron EG.5, 20% by XBB.1.6, 20% by HV.1, 14% by FL.1.5.1 (as of October 14)

    Major metrics suggest the U.S. is still in a lull of COVID-19 spread, as we’ve seen decreases in wastewater levels and test positivity for several weeks. Transmission is still high, though, and it seems likely that cold weather will drive up COVID-19 as well as other respiratory viruses in the coming weeks. 

    Biobot updated its COVID-19 wastewater dashboard this week, showing a continued decline in national coronavirus levels (with a decrease of about 35% from early September through October 11). Regionally, the company reports an increase in transmission in the Midwest and decreases in other regions, though the Northeast still has the highest coronavirus levels.

    WastewaterSCAN’s dashboard similarly shows a national decline in recent weeks, and higher coronavirus levels in the Northeast and Midwest compared to the West and South. Some Northeast and Midwest sewersheds in SCAN’s network, including those in Maine, New Hampshire, Iowa, and Michigan, have reported significant recent increases.

    As we discuss wastewater data, it’s worth a reminder that the CDC’s new contract with Verily has disrupted the existing surveillance landscape. Verily is working on onboarding CDC contract sites, leading to data gaps on the CDC dashboard, while Biobot’s network of sites for its national visualizations has become less comprehensive.

    COVID-19 test positivity, reported by the CDC’s respiratory virus testing network, is under 10% nationally for the first time since July. Northeast and Midwest regions report higher test positivity than the West and South. Hospital admissions for COVID-19 have plateaued as well.

    Influenza-like activity is mostly low across the U.S., according to the CDC’s FluView network. Only Alaska and the Northern Mariana Islands report high levels as of the week ending October 14.

    COVID-19 spread so far this fall is in line with the transmission levels we saw in fall 2021, during that year’s Delta surge, and a bit below last year’s levels, per Biobot. If we continue following these trends, we will be due for increased spread in November through the end of 2023.

  • National numbers, October 8

    National numbers, October 8

    Data from WastewaterSCAN’s network of testing sites suggest a recent increase in coronavirus in Northeast states’ wastewater.

    During the most recent week of data available (September 24-30), the U.S. reported about 18,100 new COVID-19 patients admitted to hospitals, according to the CDC. This amounts to:

    • An average of 2,600 new admissions each day
    • 5.5 total admissions for every 100,000 Americans
    • 6% fewer new admissions than the prior week (September 17-23)

    Additionally, the U.S. reported:

    • 10.9% of tests in the CDC’s surveillance network came back positive
    • A 1% higher concentration of SARS-CoV-2 in wastewater than the prior week (as of September 27, per Biobot’s dashboard)
    • 29% of new cases are caused by Omicron EG.5, 23% by XBB.1.6, 14% by FL.1.5.1 (as of September 30)

    After a couple of weeks’ decline, COVID-19 spread in the U.S. may be leveling off ahead of more increases in late fall and winter. We’re seeing plateaus in wastewater data, paired with slight declines in test positivity and hospital indicators.

    Biobot’s COVID-19 wastewater dashboard suggests that national COVID-19 spread reached a plateau last week, increasing very slightly from September 20 to September 27. The company’s regional data suggest that this plateau is consistent in all four regions, but the Northeast has significantly higher (and potentially rising) viral levels. It’s worth noting Biobot’s data may have become less comprehensive recently; see below for more details.

    The WastewaterSCAN project similarly shows that COVID-19 spread hasn’t changed much at the national level in recent weeks: it is high with no significant trend up or down, according to the project’s assessment. Per WastewaterSCAN, the Northeast and Midwest continue to have more coronavirus transmission than the West and South.

    Some Northeast cities are reporting significant upticks in the last week, including South Boston, Portland, Maine, and Montpelier, Vermont (the latter two report to WastewaterSCAN). In past years, late fall/winter surges have started in the Northeast and Midwest, as these regions see colder weather earlier, sometimes paired with the introduction of new variants. It seems likely that a similar trend will occur this year.

    In non-wastewater indicators: test positivity from the CDC’s laboratory network continues to trend slightly down, reported at 10.9% for the week ending September 30. Hospitalizations have also dipped slightly, though more than 2,500 people have still been hospitalized daily with COVID-19 in recent weeks.

    I wish I could update you about the fall vaccine rollout, but we literally don’t have national data on it, thanks to the end of CDC vaccination reporting requirements tied to the federal public health emergency. The CDC’s last vaccination data update occurred on May 11.

    Respiratory virus season is about to start, meaning that other common viruses (flu, RSV, etc.) will join COVID-19 in causing easily preventable illnesses. Remember that masks, ventilation, and shifting activities outdoors help reduce risks of all these viruses, not just SARS-CoV-2.

  • National numbers, October 1

    National numbers, October 1

    Test positivity for COVID-19 is declining while hospitalizations are starting to plateau, according to the CDC’s data.

    During the most recent week of data available (September 17-23), the U.S. reported about 19,100 new COVID-19 patients admitted to hospitals, according to the CDC. This amounts to:

    • An average of 2,700 new admissions each day
    • 5.8 total admissions for every 100,000 Americans
    • 3% fewer new admissions than the prior week (September 10-16)

    Additionally, the U.S. reported:

    • 11.6% of tests in the CDC’s surveillance network came back positive
    • A 13% lower concentration of SARS-CoV-2 in wastewater than the prior week (as of September 20, per Biobot’s dashboard)
    • 29% of new cases are caused by Omicron EG.5, 23% by XBB.1.6, 14% by FL.1.5.1 (as of September 30)

    COVID-19 spread is on the decline nationally, following a trend from the last couple of weeks. But levels are still very high, and it’s unclear how long this decline will continue before colder weather and indoor gatherings push transmission up again.

    Wastewater surveillance (from Biobot, WastewaterSCAN, and the CDC’s network) reports national COVID-19 declines for the last two to three weeks. Patterns differ at the regional level, though, likely due to different behavioral patterns and variants.

    Biobot Analytics’ dashboard shows that national coronavirus levels in wastewater have dropped by about 20% from August 30 to September 20. While all four regions report declines, the Northeast is experiencing more of a plateau compared to starker drops in the South, West, and Midwest.

    Biobot announced this week that they will be updating COVID-19 data weekly on Mondays, a change from their prior biweekly reports on Tuesdays and Thursdays. This shift will lead to a greater delay in Biobot’s data; the most recent data on their dashboard are now as of September 20, over a week ago. But, as a tradeoff, the data may now be more accurate in incorporating samples from Biobot’s entire network, reducing retrospective updates.

    WastewaterSCAN’s dashboard shows a similar picture to Biobot’s: a slow decline in SARS-CoV-2 levels nationally, with more coronavirus spreading in the Northeast and Midwest than West and South. The WastewaterSCAN team recently updated their dashboard to more easily show national and regional trends—I’m a fan of the change.

    Aligning with wastewater data, test positivity from the CDC’s lab testing network has declined by about 20% in the last month. This metric also differs by region; test positivity is higher in Health Region 2 (including New York and New Jersey) as well as 5 and 7 (including some Midwestern states) than in other parts of the country.

    Hospitalizations (a more delayed indicator) are starting to plateau, according to the CDC. But it’s important to recognize that our limited wastewater and testing data suggest, while COVID-19 levels may be declining, they are still quite high compared to past lulls in transmission. Biobot’s data, for example, suggest that current spread is comparable to this time in early fall 2021, during the Delta wave.

    There hasn’t been much change in the variant picture during recent weeks: XBB.1.5-related variants EG.5 and XBB.1.6 caused the majority of cases in September, according to the CDC’s latest estimates. (EG.5 is an offshoot of XBB.1.9.) BA.2.86 has yet to show up in significant numbers, suggesting it might not be as competitive as some experts initially expected; though it could still accumulate and cause problems later this fall.

    The CDC is now updating its COVID-19 data weekly on Fridays, timed with its updates to other respiratory virus data pages. This suggests—as I noted last week—that the agency is now incorporating COVID-19 into its regular fall/winter virus surveillance systems.

  • National numbers, October 30

    National numbers, October 30

    BA.5 caused just under half of new COVID-19 cases nationwide in the last week, according to CDC estimates. But we have yet to see a new subvariant clearly take over.

    In the past week (October 20 through 26), the U.S. reported about 270,000 new COVID-19 cases, according to the CDC. This amounts to:

    • An average of 38,000 new cases each day
    • 81 total new cases for every 100,000 Americans
    • 2% more new cases than last week (October 13-19)

    In the past week, the U.S. also reported about 23,000 new COVID-19 patients admitted to hospitals. This amounts to:

    • An average of 3,200 new admissions each day
    • 6.9 total admissions for every 100,000 Americans
    • 1% more new admissions than last week

    Additionally, the U.S. reported:

    • 2,600 new COVID-19 deaths (380 per day)
    • 27% of new cases are caused by Omicron BQ.1 and BQ.1.1; 8% by BF.7;  3% by BA.2.75 and BA.2.75.2 (as of October 29)
    • An average of 400,000 vaccinations per day

    The national COVID-19 picture continues to be somewhat murky, thanks in part to poor-quality data. Both nationwide cases and new hospital admissions trended slightly upward in the last week (by 2% and 1%, respectively); this could reflect the beginnings of fall surges in some places, but it’s hard to say for sure.

    Wastewater data from Biobot continue to suggest the Northeast is seeing more COVID-19 transmission than other parts of the country, though this region reported a decrease in viral levels over the last two weeks. Other regions are reporting plateaus in transmission, according to Biobot.

    One reason we’re not seeing a definitive national surge yet could be that the newest iterations of Omicron have yet to fully dominate the country. BA.5 caused just under half of new COVID-19 cases nationwide last week, according to the CDC’s latest estimates, but the remaining half of cases were driven by a variety of new lineages: BQ.1, BQ.1.1, BA.4.6, and BF.7 all contributed over 5%.

    When one of these subvariants (likely BQ.1.1) outcompetes the others, we will likely see a clearer picture of its impact on transmission. Also worth noting: XBB, the subvariant spreading quickly in Singapore and other Asian countries, has been identified in the U.S.—though its prevalence is too minimal to show up in the CDC’s estimates, at this point.

    New York is a hotspot again: the state has a higher prevalence of BQ.1 and BQ.1.1 than other parts of the country, and some experts are concerned about rising COVID-19 hospitalizations here. In New York City, official cases have remained relatively stable for the last few weeks even as hospitalizations are going up, suggesting how continued low testing may make cases even less useful as a metric to watch.

    This isn’t the only region seeing the start of a fall surge, though. The Twin Cities area in Minnesota reported a major spike in wastewater this week, with viral prevalence the highest it’s been since the original Omicron surge. Some counties in the South and West coast are showing similar warnings, according to Biobot’s dashboard.

    And COVID-19 isn’t the only respiratory virus wreaking havoc right now, as we’ll discuss more in this issue. Places like NYC are seeing rising hospitalizations from the flu and RSV, placing additional strain on an already-overburdened healthcare system. Even if the coronavirus doesn’t have a drastic surge this winter, we could still see a lot of respiratory infections.

  • National numbers, October 23

    National numbers, October 23

    New Omicron subvariants are spreading across the U.S. BQ.1 (medium green) and BQ.1.1 (dark green) are particularly prevalent in the Northeast. Chart via the CDC.

    In the past week (October 13 through 19), the U.S. reported about 260,000 new COVID-19 cases, according to the CDC. This amounts to:

    • An average of 37,000 new cases each day
    • 79 total new cases for every 100,000 Americans
    • 2% fewer new cases than last week (October 6-12)

    In the past week, the U.S. also reported about 22,000 new COVID-19 patients admitted to hospitals. This amounts to:

    • An average of 3,200 new admissions each day
    • 6.7 total admissions for every 100,000 Americans
    • 4% fewer new admissions than last week

    Additionally, the U.S. reported:

    • 2,600 new COVID-19 deaths (390 per day)
    • 11% of new cases are caused by Omicron BA.4.6; 17% by BQ.1 and BQ.1.1; 7% by BF.7;  3% by BA.2.75 and BA.2.75.2 (as of October 22)
    • An average of 400,000 vaccinations per day (CDC link)

    Official COVID-19 case numbers continue to drop nationwide, according to the CDC, but I remain concerned that a fall surge is coming soon—if it isn’t already here.

    As the CDC transitioned this week from daily to weekly case reporting (more on that later in the issue), the agency’s “COVID Data Tracker Weekly Review” report, which I use to write these posts, is now using three-week rolling averages for its trends instead of one-week averages. The three-week average suggests reported cases are down 30% in the last month. But the actual case numbers report a dip of just 1% from last week to this week, suggesting a plateau in cases.

    Data from Biobot’s dashboard similarly suggest a plateau in nationwide transmission trends, with the Northeast reporting more viral transmission than other regions. The wastewater data suggest that, nationwide, coronavirus transmission is on a similar level to what it was in early fall last year, before Omicron arrived. But the case numbers are now much lower thanks to limited testing access.

    Consider this: recent estimates from the Institute for Health Metrics and Evaluation suggest only 4% to 5% of actual coronavirus infections make it into the public health system now. If this is correct, actual infection numbers in the U.S. are 20 times higher than our actual count, amounting to 740,000 true cases a day.

    The Northeast remains a hotspot, as the first region to note signs of a new surge. Some New England cities and counties—including Boston—are seeing spikes or high plateaus in their coronavirus levels in wastewater, Biobot reports. States in this region, especially New York and New Jersey, report more BQ.1 and BQ.1.1 than other parts of the country; if new variants aren’t contributing yet to a surge, they will be soon.

    Overall, BQ.1 and BQ.1.1 are now causing about one in six new cases in the U.S. and are anticipated to become dominant subvariants within a few weeks. This could have implications for treatments such as Evusheld, a monoclonal antibody drug for immunocompromised people. While the bivalent/Omicron-specific booster shots should still work against BQ.1 and BQ.1.1, uptake of these vaccines remains very low. (See last week’s post for more subvariant details.)

  • National numbers, October 16

    National numbers, October 16

    After a small uptick in vaccinations thanks to the new boosters, vaccinations are already slowing again. Chart via the CDC, data as of October 12.

    In the past week (October 8 through 14), the U.S. reported about 270,000 new COVID-19 cases, according to the CDC. This amounts to:

    • An average of 39,000 new cases each day
    • 83 total new cases for every 100,000 Americans
    • 12% fewer new cases than last week (October 1-7)

    In the past week, the U.S. also reported about 23,000 new COVID-19 patients admitted to hospitals. This amounts to:

    • An average of 3,300 new admissions each day
    • 7.0 total admissions for every 100,000 Americans
    • 4% fewer new admissions than last week

    Additionally, the U.S. reported:

    • 2,300 new COVID-19 deaths (330 per day)
    • 12% of new cases are caused by Omicron BA.4.6; 11% by BQ.1 and BQ.1.1; 5% by BF.7;  3% by BA.2.75 and BA.2.75.2 (as of October 15)
    • An average of 400,000 vaccinations per day

    While official case numbers remain low compared to past fall seasons—both national cases and hospital admissions dropped again this week—signals of a coming fall surge are accumulating from wastewater and local data.

    According to Biobot’s dashboard, the coronavirus continues to spread in the Northeast at higher levels than the rest of the country with a new uptick this week. In places like Franklin County, Massachusetts, Fairfield County, Connecticut, and Middlesex County, New Jersey, coronavirus levels are higher now than they have been at any point in the last six months.

    Similar patterns are starting to show up in clinical data: Northeast states including Vermont, Maine, Connecticut, New Hampshire, Massachusetts, New York, and New Jersey reported increased COVID-19 patients this past week, according to the October 13 Community Profile Report.

    Along with colder weather and behavior patterns, new Omicron lineages could contribute to the increased transmission—if they aren’t contributing already. BQ.1 and BQ.1.1, two sublineages from BA.5, are now causing about 11% of new cases nationwide, according to the CDC’s most recent variant prevalence update. In the northeast, their prevalence is approaching to 20%. (More on the new subvariants in the next post.)

    As many of the sublineages now circulating are descended from BA.5 or BA.4, the bivalent booster shots designed to protect against these variants should still help protect against newer strains. In fact, the FDA and CDC recently expanded eligibility for these new shots to younger age groups, going down to kids ages five to eleven.

    But uptake of the new boosters remains low—in part because public communication has been so limited, many Americans don’t know they qualify for these shots. Only 15 million people have received the boosters as of October 12, a tiny fraction of the eligible population.

  • National numbers, October 9

    National numbers, October 9

    Regional wastewater data from Biobot suggest the Northeast currently has much higher coronavirus transmission levels than the rest of the country.

    In the past week (October 1 through 7), the U.S. reported about 300,000 new COVID-19 cases, according to the CDC. This amounts to:

    • An average of 42,000 new cases each day
    • 89 total new cases for every 100,000 Americans
    • 10% fewer new cases than last week (September 24-30)

    In the past week, the U.S. also reported about 23,000 new COVID-19 patients admitted to hospitals. This amounts to:

    • An average of 3,300 new admissions each day
    • 7.1 total admissions for every 100,000 Americans
    • 5% fewer new admissions than last week

    Additionally, the U.S. reported:

    • 2,400 new COVID-19 deaths (350 per day)
    • 79% of new cases are caused by Omicron BA.5; 14% by BA.4.6; 5% by BF.7;  2% by BA.2.75 (as of October 8)
    • An average of 400,000 vaccinations per day (CDC link)

    Following a pattern from the last couple of months, national COVID-19 cases and hospitalizations continued to trend slightly downward this week—though local indicators suggest we may experience a fall surge soon.

    Biobot’s wastewater dashboard reports that coronavirus transmission has plateaued at a high level in the Northeast, and at lower levels in the Midwest, West, and South. More locally, several counties that Biobot monitors in Massachusetts, New Jersey, and nearby states are seeing increased viral levels in their wastewater; two prominent examples are Boston and Hartford, Connecticut.

    Official COVID-19 cases are heavily underreported right now (by a factor of ten times or more); if we had a better testing infrastructure, they might match more closely to wastewater trends.

    Even so, data from the HHS’s October 6 Community Profile Report show that several Northeast states reported among the highest case rates this week. Rhode Island, New Jersey, New York, and Massachusetts all reported 150 or more cases per 100,000 people in the week ending October 5. Kentucky and Puerto Rico reported even more cases, at rates over 200 per 100,000.

    At the moment, we’re not seeing enough of the newer Omicron subvariants (BF.7, BA.2.75, etc.) to blame the transmission increases on them. Cold weather (driving people to gather indoors) and waning immunity from past cases and vaccinations are more likely culprits, as Katelyn Jetelina noted in a recent Your Local Epidemiologist post.

    Jetelina also pointed out that fall waves are starting in Western European countries, including Germany and the U.K. The U.S. has followed trends in these countries throughout the pandemic, and it seems likely that the same thing will happen this fall—especially considering that the U.S. and European nations have similarly dismissive attitudes towards safety measures right now.

    Again, the best way to protect yourself as we prepare for a potential surge is to get an Omicron-specific, bivalent booster shot. Uptake of these shots continues to be quite low in the U.S. so far: as of October 5, just 11.5 million Americans have received them, representing about 5% of the eligible population.

  • National numbers, October 2

    National numbers, October 2

    Coronavirus levels in Boston, Mass. wastewater spiked intensely last week. Chart via MWRA/Biobot.

    In the past week (September 24 through 30), the U.S. reported about 330,000 new COVID-19 cases, according to the CDC. This amounts to:

    • An average of 47,000 new cases each day
    • 100 total new cases for every 100,000 Americans
    • 13% fewer new cases than last week (September 17-23)

    In the past week, the U.S. also reported about 26,000 new COVID-19 patients admitted to hospitals. This amounts to:

    • An average of 3,800 new admissions each day
    • 8.0 total admissions for every 100,000 Americans
    • 6% fewer new admissions than last week

    Additionally, the U.S. reported:

    • 2,400 new COVID-19 deaths (350 per day)
    • 81% of new cases are caused by Omicron BA.5; 13% by BA.4.6; 3% by BF.7;  1% by BA.2.75 (as of October 1)
    • An average of 400,000 vaccinations per day

    Official COVID-19 numbers continue to drop nationwide, with case counts down 13% and new hospital admissions down 6% this week compared to the prior week. Still, signals from wastewater suggest this is no time to let our guard down, especially if you live in the Northeast.

    Biobot’s wastewater surveillance dashboard is back this week (after a one-week hiatus). Nationally, this surveillance suggests coronavirus transmission is at a high plateau close to what we saw during early fall of last year, before Omicron hit. The Northeast is driving that recent trend, with an overall coronavirus concentration twice as high as the concentrations reported in other regions.

    This region remains a hotspot for Omicron BF.7, the subvariant of BA.5 that could be the U.S.’s next dominant lineage. Nationwide, BF.7 is slowly competing with BA.5: it’s grown from causing about 1% of new cases to 3.4% over the last month, according to CDC estimates. BA.4.6 also continues to grow, while BA.2.75 has remained relatively constant.

    Within the Northeast region, Boston stands out: the city’s wastewater surveillance program (run by Biobot) reported a major spike last week. And by major spike, I mean an increase of more than 100% week-over-week, according to the city’s public health department. “This spike in our wastewater concentration is of great concern and another reminder that the pandemic is far from over,” said Dr. Bisola Ojikutu, Boston’s public health commissioner, in a press release.

    Wastewater spikes typically precede case spikes by a couple of weeks, though we’ll have to see whether the significant drop in PCR testing in recent months changes this pattern. Either way, this is a good time to get a booster shot (more on boosters below), stock up on masks and rapid tests, and start planning safety measures for the holidays.

    Boston is running vaccine clinics in response to this potential new surge, and the city public health department “recommends” masking indoors. But any further mitigations are likely out of the question, even though they could have a huge impact.

  • National numbers, October 31

    National numbers, October 31

    Nationwide COVID-19 hospitalizations have fallen below 50,000 for the first time since July. Chart via Conor Kelly, posted on Twitter on October 30.

    In the past week (October 23 through 29), the U.S. reported about 480,000 new cases, according to the CDC.* This amounts to:

    • An average of 69,000 new cases each day
    • 147 total new cases for every 100,000 Americans
    • 7% fewer new cases than last week (October 16-22)

    Last week, America also saw:

    • 38,000 new COVID-19 patients admitted to hospitals (12 for every 100,000 people)
    • 8,000 new COVID-19 deaths (2.4 for every 100,000 people)
    • 100% of new cases are Delta-caused (as of October 23)
    • An average of 900,000 vaccinations per day (including booster shots; per Bloomberg)

    *Note: we are back to our usual schedule (utilizing data as of Friday) after last week’s hiccup.

    Nationally, new COVID-19 cases continue to drop—though the decrease is slowing a bit from previous weeks. The number of new cases fell by about 7% this week, after falling by about 12% for the two weeks prior.

    Still, a downward trend is a positive trend. The U.S. now has fewer than 50,000 COVID-19 patients in hospitals nationwide, for the first time since July—before the Delta surge started. The number of new deaths is also slowly falling, though the country is still seeing over 1,000 people die from COVID-19 each day.

    The country’s current hotspots continue to be the same group of colder-weather states I called out last week: Alaska, Montana, Wyoming, North Dakota, and Idaho. All five have recorded over 400 new cases for every 100,000 people in the last week, per the latest Community Profile Report, with Alaska at the top (657 cases per 100,000).

    It’s hard to say whether these high numbers are a product of cold weather driving people inside, low vaccination rates—all five states have about half or less of their populations fully vaccinated—or both. Continuing trends in these states may provide an indicator of how other parts of the country may fare this winter.

    Meanwhile, more states are seeing their COVID-19 numbers drop below “high transmission” levels, including Louisiana, D.C., Georgia, Maryland, Texas, and New Jersey. In New Orleans, a Delta epicenter in the summer, case numbers are low enough that the mayor has loosened the city’s mask mandate and other COVID-19 restrictions.

    Vaccinations are up nationally, but booster shots—not previously unvaccinated Americans getting their first doses—are comprising the bulk of the trend. Yesterday, out of 1.6 million doses reported by the CDC, a record one million were booster shots. Just 361,000 were new first doses.