Tag: National numbers

  • National numbers, October 9

    National numbers, October 9

    Regional wastewater data from Biobot suggest the Northeast currently has much higher coronavirus transmission levels than the rest of the country.

    In the past week (October 1 through 7), the U.S. reported about 300,000 new COVID-19 cases, according to the CDC. This amounts to:

    • An average of 42,000 new cases each day
    • 89 total new cases for every 100,000 Americans
    • 10% fewer new cases than last week (September 24-30)

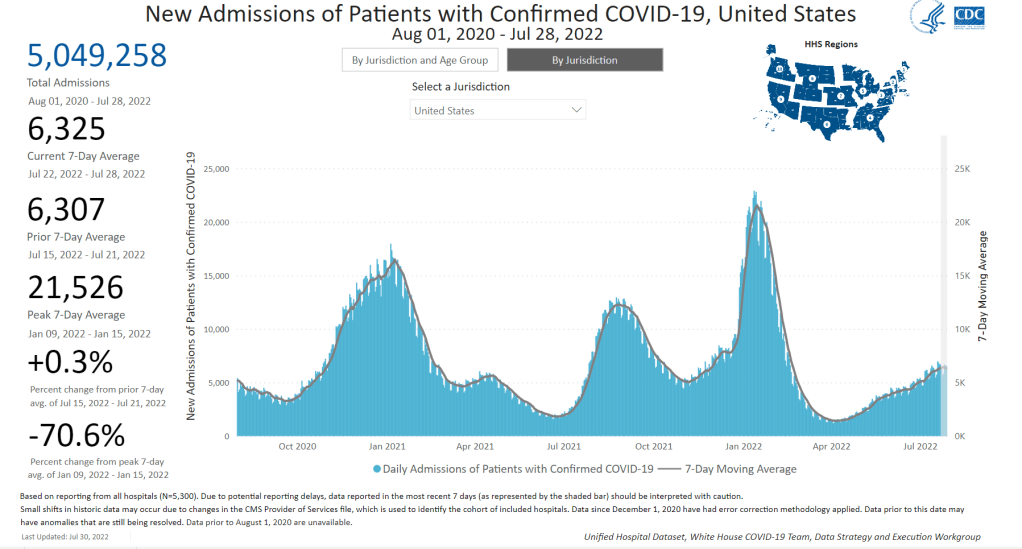
    In the past week, the U.S. also reported about 23,000 new COVID-19 patients admitted to hospitals. This amounts to:

    • An average of 3,300 new admissions each day
    • 7.1 total admissions for every 100,000 Americans
    • 5% fewer new admissions than last week

    Additionally, the U.S. reported:

    • 2,400 new COVID-19 deaths (350 per day)
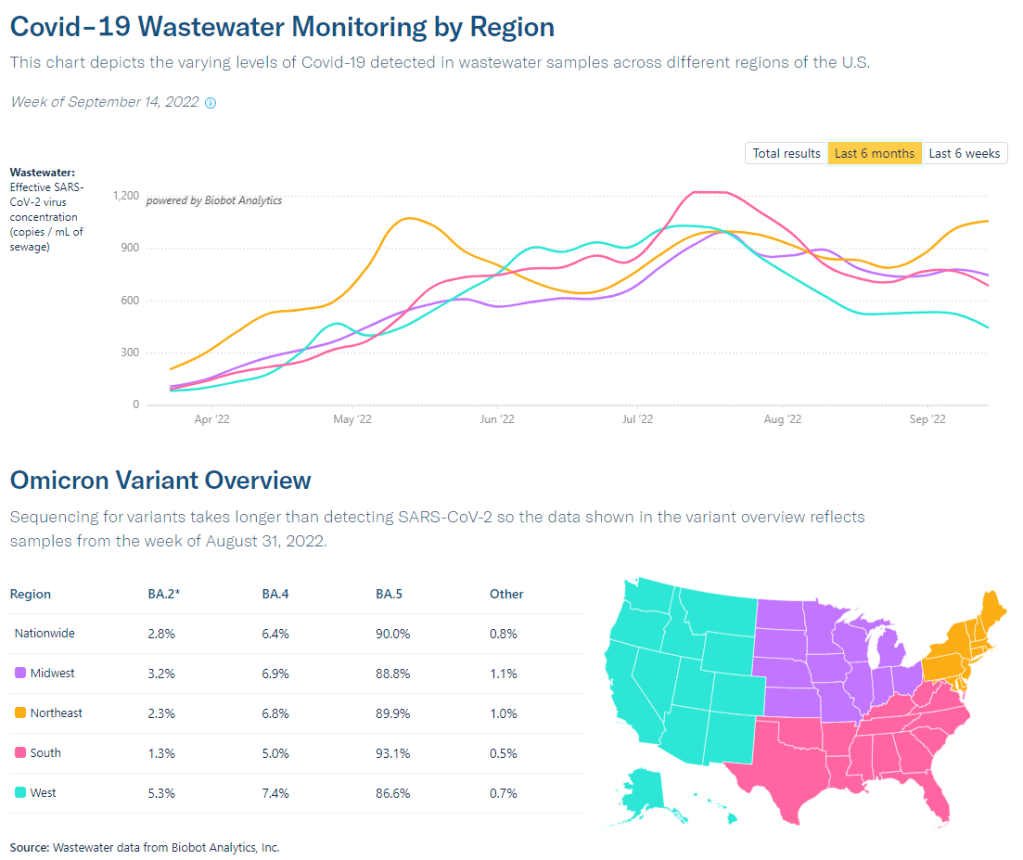
    • 79% of new cases are caused by Omicron BA.5; 14% by BA.4.6; 5% by BF.7;  2% by BA.2.75 (as of October 8)
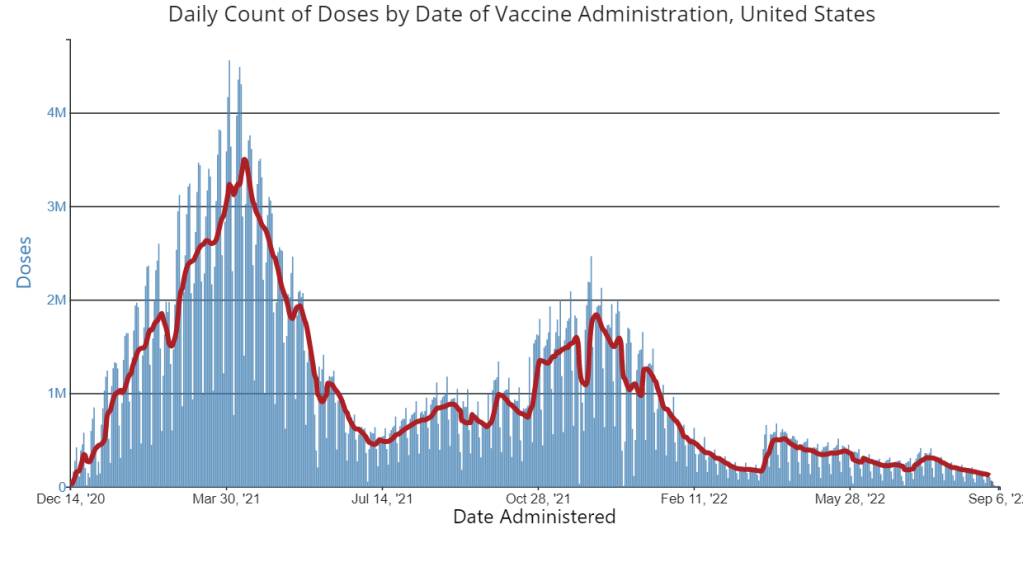
    • An average of 400,000 vaccinations per day (CDC link)

    Following a pattern from the last couple of months, national COVID-19 cases and hospitalizations continued to trend slightly downward this week—though local indicators suggest we may experience a fall surge soon.

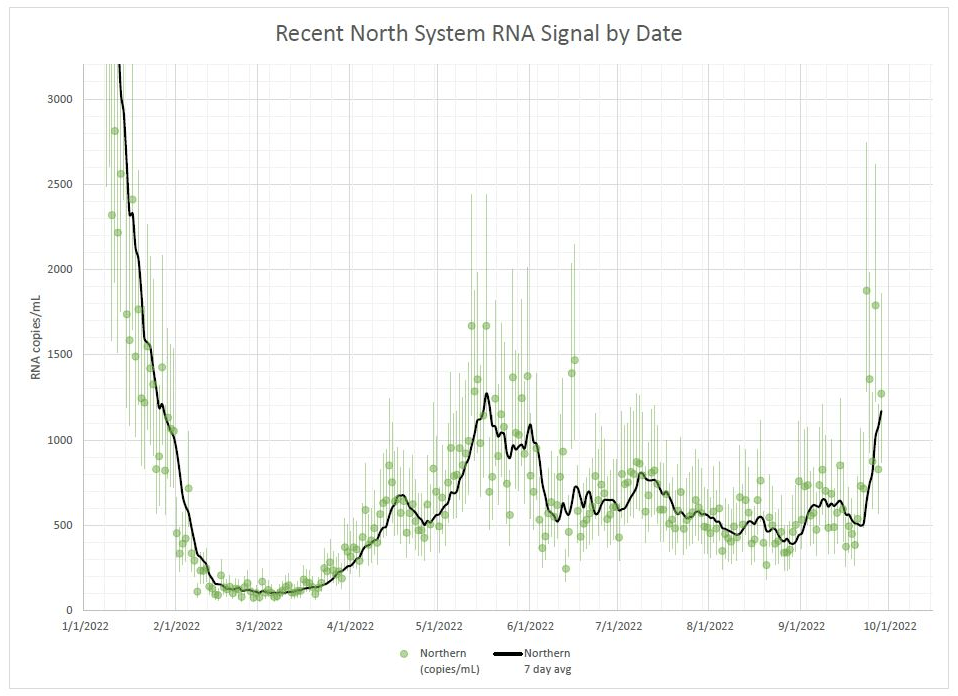
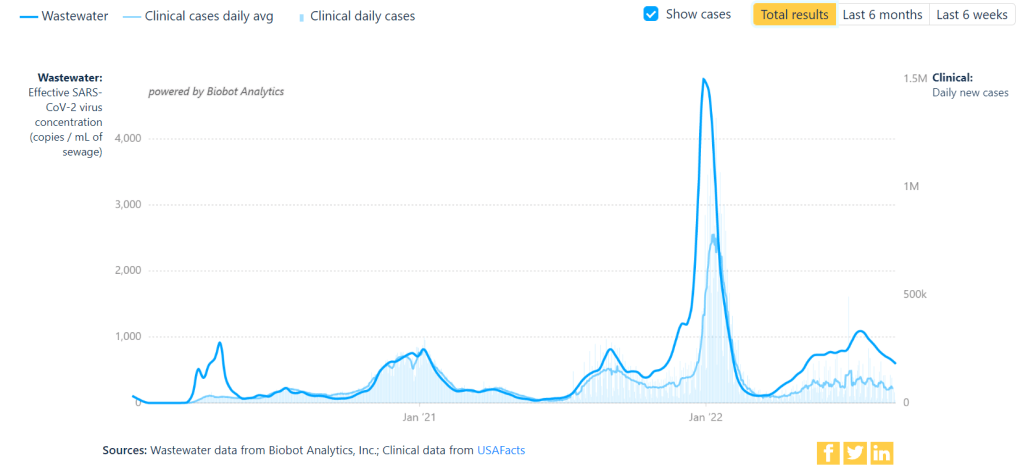
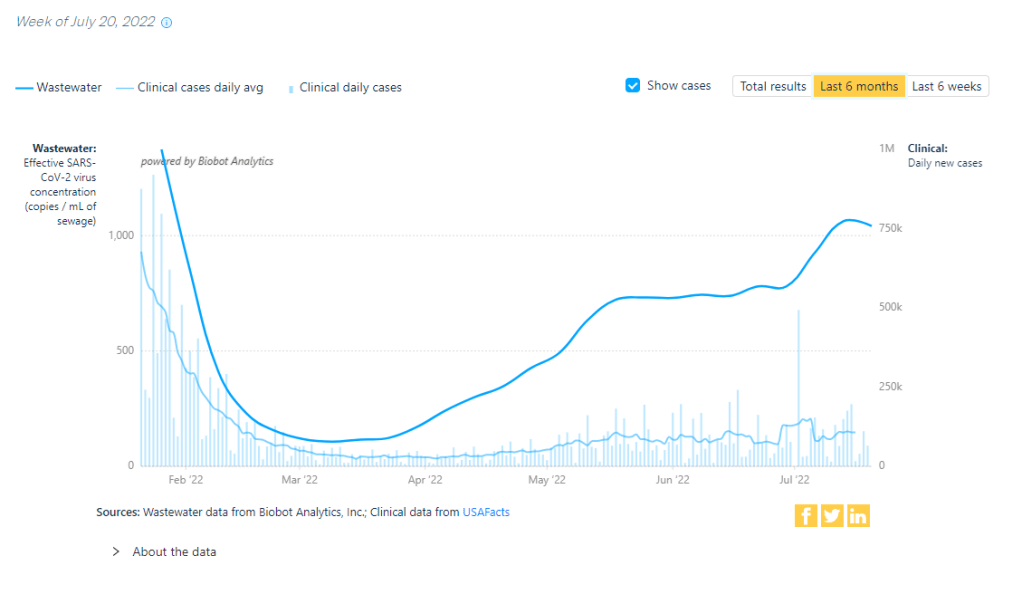
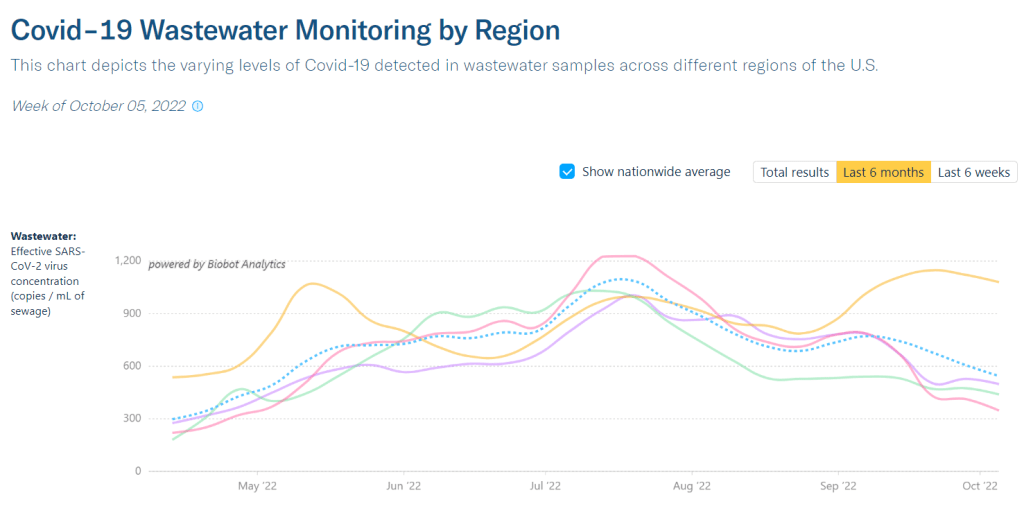
    Biobot’s wastewater dashboard reports that coronavirus transmission has plateaued at a high level in the Northeast, and at lower levels in the Midwest, West, and South. More locally, several counties that Biobot monitors in Massachusetts, New Jersey, and nearby states are seeing increased viral levels in their wastewater; two prominent examples are Boston and Hartford, Connecticut.

    Official COVID-19 cases are heavily underreported right now (by a factor of ten times or more); if we had a better testing infrastructure, they might match more closely to wastewater trends.

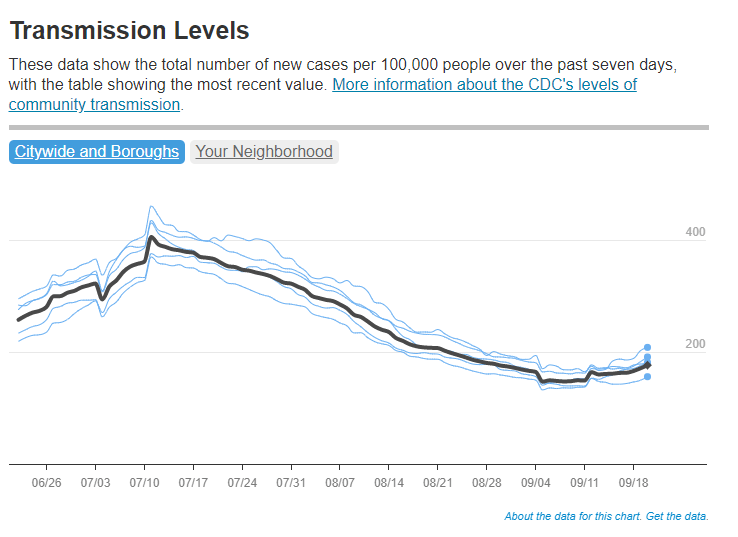
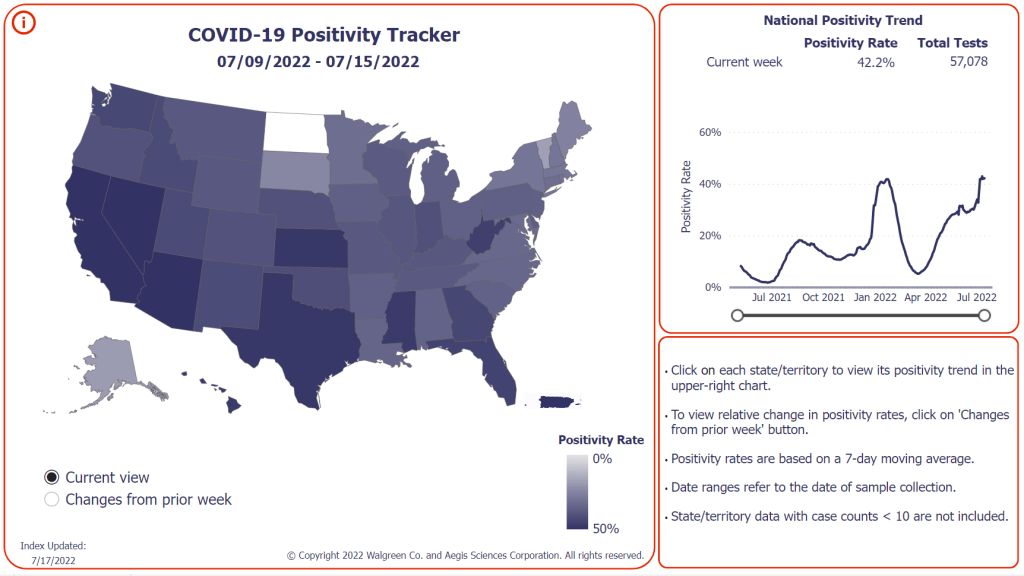
    Even so, data from the HHS’s October 6 Community Profile Report show that several Northeast states reported among the highest case rates this week. Rhode Island, New Jersey, New York, and Massachusetts all reported 150 or more cases per 100,000 people in the week ending October 5. Kentucky and Puerto Rico reported even more cases, at rates over 200 per 100,000.

    At the moment, we’re not seeing enough of the newer Omicron subvariants (BF.7, BA.2.75, etc.) to blame the transmission increases on them. Cold weather (driving people to gather indoors) and waning immunity from past cases and vaccinations are more likely culprits, as Katelyn Jetelina noted in a recent Your Local Epidemiologist post.

    Jetelina also pointed out that fall waves are starting in Western European countries, including Germany and the U.K. The U.S. has followed trends in these countries throughout the pandemic, and it seems likely that the same thing will happen this fall—especially considering that the U.S. and European nations have similarly dismissive attitudes towards safety measures right now.

    Again, the best way to protect yourself as we prepare for a potential surge is to get an Omicron-specific, bivalent booster shot. Uptake of these shots continues to be quite low in the U.S. so far: as of October 5, just 11.5 million Americans have received them, representing about 5% of the eligible population.

  • National numbers, October 2

    National numbers, October 2

    Coronavirus levels in Boston, Mass. wastewater spiked intensely last week. Chart via MWRA/Biobot.

    In the past week (September 24 through 30), the U.S. reported about 330,000 new COVID-19 cases, according to the CDC. This amounts to:

    • An average of 47,000 new cases each day
    • 100 total new cases for every 100,000 Americans
    • 13% fewer new cases than last week (September 17-23)

    In the past week, the U.S. also reported about 26,000 new COVID-19 patients admitted to hospitals. This amounts to:

    • An average of 3,800 new admissions each day
    • 8.0 total admissions for every 100,000 Americans
    • 6% fewer new admissions than last week

    Additionally, the U.S. reported:

    • 2,400 new COVID-19 deaths (350 per day)
    • 81% of new cases are caused by Omicron BA.5; 13% by BA.4.6; 3% by BF.7;  1% by BA.2.75 (as of October 1)
    • An average of 400,000 vaccinations per day

    Official COVID-19 numbers continue to drop nationwide, with case counts down 13% and new hospital admissions down 6% this week compared to the prior week. Still, signals from wastewater suggest this is no time to let our guard down, especially if you live in the Northeast.

    Biobot’s wastewater surveillance dashboard is back this week (after a one-week hiatus). Nationally, this surveillance suggests coronavirus transmission is at a high plateau close to what we saw during early fall of last year, before Omicron hit. The Northeast is driving that recent trend, with an overall coronavirus concentration twice as high as the concentrations reported in other regions.

    This region remains a hotspot for Omicron BF.7, the subvariant of BA.5 that could be the U.S.’s next dominant lineage. Nationwide, BF.7 is slowly competing with BA.5: it’s grown from causing about 1% of new cases to 3.4% over the last month, according to CDC estimates. BA.4.6 also continues to grow, while BA.2.75 has remained relatively constant.

    Within the Northeast region, Boston stands out: the city’s wastewater surveillance program (run by Biobot) reported a major spike last week. And by major spike, I mean an increase of more than 100% week-over-week, according to the city’s public health department. “This spike in our wastewater concentration is of great concern and another reminder that the pandemic is far from over,” said Dr. Bisola Ojikutu, Boston’s public health commissioner, in a press release.

    Wastewater spikes typically precede case spikes by a couple of weeks, though we’ll have to see whether the significant drop in PCR testing in recent months changes this pattern. Either way, this is a good time to get a booster shot (more on boosters below), stock up on masks and rapid tests, and start planning safety measures for the holidays.

    Boston is running vaccine clinics in response to this potential new surge, and the city public health department “recommends” masking indoors. But any further mitigations are likely out of the question, even though they could have a huge impact.

  • National numbers, September 25

    National numbers, September 25

    Reported COVID-19 cases in New York City have started going up slightly in the last few days, according to the city health department.

    In the past week (September 17 through 23), the U.S. reported about 380,000 new COVID-19 cases, according to the CDC. This amounts to:

    • An average of 54,000 new cases each day
    • 116 total new cases for every 100,000 Americans
    • 11% fewer new cases than last week (September 10-16)

    In the past week, the U.S. also reported about 28,000 new COVID-19 patients admitted to hospitals. This amounts to:

    • An average of 4,000 new admissions each day
    • 8.5 total admissions for every 100,000 Americans
    • 10% fewer new admissions than last week

    Additionally, the U.S. reported:

    • 2,400 new COVID-19 deaths (350 per day)
    • 83% of new cases are caused by Omicron BA.5; 12% by BA.4.6; 2% by BF.7;  1% by BA.2.75 (as of September 24)
    • An average of 300,000 vaccinations per day

    Nationally, official COVID-19 case counts continue to decline: reported cases are down about 11% last week compared to the prior week, while new COVID-19 patients in hospitals are down 10%. But signals from wastewater and variants suggest a fall surge may be starting soon. 

    “Currently, most of the country is reporting moderate to high SARS-CoV-2 levels in wastewater,” CDC officials noted in this Friday’s COVID Data Tracker Weekly Review. For almost 20% of sites, these coronavirus levels are the highest seen since December 2021, the CDC reports. About half the wastewater sites in the CDC’s network are reporting an increase in coronavirus levels and half are reporting a decrease.

    Notably, many of the wastewater sites reporting increased coronavirus spread are in the Northeast, a region that’s also a hotspot for Omicron subvariants BA.2.75 and BF.7. BF.7, a new sublineage that evolved from BA.5, is particularly worth watching (more on that below). Overall, the U.S.’s variant composition is slowly shifting from BA.5 to these two subvariants, along with BA.4.6—which caused 12% of new cases nationwide in the week ending September 24.

    According to the latest Community Profile Report, states reporting significant increases in cases from week to week include Nevada, California, New Hampshire, Kentucky, Massachusetts, New Jersey, New York, and Oregon. In New York City—often a bellwether for new surges—cases have started to tick up slightly, according to the city’s health department, after a long (and slow) decline from July’s summer peak.

    Meanwhile, other common respiratory viruses might make a comeback this fall, report Dr. Katelyn Jetelina and Dr. Caitlin Rivers in a joint issue of their newsletters. Data so far on the flu, RSV, rhinovirus, and other viruses we consider part of a normal fall season suggest that children in the U.S. might have a particularly virus-heavy fall and winter—putting more pressure on the healthcare system.

    One of the best ways to protect yourself from COVID-19 this fall is by receiving one of the new, Omicron-specific booster shots. According to the CDC, about 4.4 million Americans have received one so far, as of September 21. The new shots have brought our vaccine administration counts to over 300,000 new doses given a day, but that still pales in comparison to the millions administered daily during the spring 2021 campaign.

    I received my own booster on Friday at a NYC Health + Hospitals site. Unlike my primary series doses, for which my girlfriend and I had to wait in long lines with hundreds of other New Yorkers, we got our new shots in a small, hard-to-find room tucked away in a small corner of a south Brooklyn hospital campus. This vaccination campaign seems to be almost an afterthought when it deserves primetime attention.

  • National numbers, September 18

    National numbers, September 18

    Wastewater trends in the past couple of weeks are looking a bit messy, with a potential new surge in the Northeast and plateaus in other regions. Chart via Biobot, retrieved on September 18.

    In the past week (September 10 through 16), the U.S. reported about 420,000 new COVID-19 cases, according to the CDC. This amounts to:

    • An average of 60,000 new cases each day
    • 128 total new cases for every 100,000 Americans
    • 16% fewer new cases than last week (September 3-9)

    In the past week, the U.S. also reported about 31,000 new COVID-19 patients admitted to hospitals. This amounts to:

    • An average of 4,400 new admissions each day
    • 9.3 total admissions for every 100,000 Americans
    • 6% fewer new admissions than last week

    Additionally, the U.S. reported:

    • 2,500 new COVID-19 deaths (0.8 for every 100,000 people)
    • 85% of new cases are caused by Omicron BA.5; 10% by BA.4.6; 1% by BA.2.75 (as of September 17)
    • An average of 25,000 vaccinations per day (per Bloomberg)

    Officially-reported COVID-19 cases are still on the decline nationwide this week, as are newly hospitalized patients (a more reliable metric). About 4,400 people with COVID-19 were admitted to hospitals across the country, compared to over 6,000 a day in late July.

    These declines may be short-lived, as reopened schools and increased indoor gatherings contribute to new outbreaks this fall. Last week, I warned that Biobot’s wastewater data showed a slight uptick in coronavirus levels across the country; this week’s update shows a continued increase in the Northeast while other regions are in plateaus.

    Will the Northeast be the first region to experience a new surge again? It seems feasible, based on data from both Biobot and the CDC—though this region also has better wastewater surveillance coverage than other parts of the country, ABC News reporter Arielle Mitropoulos points out. Boston, one long-running wastewater surveillance location, is reporting high coronavirus concentrations at a level not observed since earlier in the summer.

    Nationwide, BA.5 continues to be the dominant variant, causing about 85% of new cases in the week ending September 17 per CDC estimates. But it’s facing competition from newer Omicron subvariants, including BA.4.6 (10% of new cases this week), BA.2.75 (1.3% of cases), and BF.7 (1.7% of cases). As of this week, the CDC is now reporting BA.2.75 and BF.7 separately rather than combining them with other lineages.

    BA.2.75, also called Centaurus, is a subvariant from BA.2 that evolved some additional mutations. BF.7 actually evolved from BA.5; its longer name is BA.5.2.1.X. There hasn’t been much reporting yet on BF.7, but it appears to be present in the Northeast—particularly in New England—at higher levels than in other regions. (Possibly another driver of a new surge in this area.)

    Overall, while COVID-19 spread in the U.S. is occurring less right now than it did earlier in the summer, the risk of encountering this virus is still pretty high across the country. According to the CDC’s “Community Transmission Level” guidance (pre-February), more than 90% of U.S. counties should require masks indoors.

    Instead, we have no masking requirements, increasingly-limited testing, and a booster shot campaign that many Americans do not even know is happening. Between 300 and 400 Americans still die of COVID-19 every day—a number that should be unacceptable—and I fear this number will only go up as we head into winter.

  • National numbers, September 11

    National numbers, September 11

    A week after new COVID-19 boosters were authorized, the U.S. has yet to see a significant jump in vaccine doses administered. Chart via the CDC.

    In the past week (September 3 through 9), the U.S. reported about 500,000 new COVID-19 cases, according to the CDC. This amounts to:

    • An average of 70,000 new cases each day
    • 150 total new cases for every 100,000 Americans
    • 19% fewer new cases than last week (August 27-September 2)

    In the past week, the U.S. also reported about 32,000 new COVID-19 patients admitted to hospitals. This amounts to:

    • An average of 4,600 new admissions each day
    • 9.9 total admissions for every 100,000 Americans
    • 11% fewer new admissions than last week

    Additionally, the U.S. reported:

    • 2,200 new COVID-19 deaths (0.7 for every 100,000 people)
    • 88% of new cases are caused by Omicron BA.5; 9% by BA.4.6 (as of September 10)
    • An average of 25,000 vaccinations per day (per Bloomberg)

    It might appear that the U.S. reported a significant drop in COVID-19 cases last week, as the CDC’s numbers dropped to about 70,000 new cases a day last week from 87,000 new cases a day in the prior week. But in fact, the decline was likely exaggerated by Labor Day weekend, as testing labs and the public health workers who crunch data took time off.

    Wastewater data from the last two weeks tell a different story. In Biobot’s most recent update, the company reported a slight increase in coronavirus concentration in wastewater at the national level. Regionally, the virus grew in the Northeast, Midwest, and South.

    While hospital admissions and other healthcare system metrics continue to show a decline, wastewater data is often an advanced indicator for new coronavirus surges. In this case, it could mean the often-predicted fall wave is beginning in some parts of the country. Remember: wastewater surveillance can catch transmission upticks early because it doesn’t rely on individuals getting PCR tests or seeking out healthcare—factors that can cause lags and undercounting in case and hospitalization data.

    Potential factors contributing to increased COVID-19 outbreaks might include holiday gatherings and travel, the start of the school year, and new Omicron subvariants taking over. BA.4.6, the lineage from BA.4 that may be even more transmissible, went from causing about 8% of new cases in the week ending September 3 to 9% in the week ending September 10, according to CDC estimates; meanwhile, BA.5’s prevalence dropped by about 1%.

    This might seem like a small shift, but it is an indicator of BA.4.6’s capacity to eventually outcompete BA.5—and reinfect people who previously caught a different version of Omicron. BA.4.6 is causing a higher share of cases in the Midwest, specifically in Iowa, Kansas, Missouri, and Nebraska, so those are states to particularly watch for increased COVID-19 spread.

    At the same time, the CDC reports that 1% of cases nationwide were caused by BA.2 lineages (not BA.2.12.1) last week. This is likely the work of BA.2.75, another subvariant of concern that the CDC isn’t yet tracking separately. (More on that later in the issue.)

    The federal government’s main action to mitigate this probably-coming surge is a new booster campaign, with the Omicron BA.4/BA.5 shots authorized last week. But vaccination numbers have been low so far, with far fewer than 100,000 doses administered each day last week.

  • National numbers, September 4

    National numbers, September 4

    Coronavirus trends in wastewater compared to official case numbers, since spring 2020. Screenshot from Biobot’s dashboard, retrieved September 4.

    In the past week (August 27 through September 2), the U.S. reported about 590,000 new COVID-19 cases, according to the CDC. This amounts to:

    • An average of 80,000 new cases each day
    • 179 total new cases for every 100,000 Americans
    • 8% fewer new cases than last week (August 20-26)

    In the past week, the U.S. also reported about 36,000 new COVID-19 patients admitted to hospitals. This amounts to:

    • An average of 5,100 new admissions each day
    • 10.8 total admissions for every 100,000 Americans
    • 4% fewer new admissions than last week

    Additionally, the U.S. reported:

    • 2,800 new COVID-19 deaths (0.9 for every 100,000 people)
    • 89% of new cases are caused by Omicron BA.5; 8% by BA.4.6 (as of September 3)
    • An average of 70,000 vaccinations per day (per Bloomberg)

    Over the past month, COVID-19 trends in the U.S. have been fairly consistent: disease spread has declined slowly around the country. Official case counts dropped from about 120,000 a day in the first week of August, to about 80,000 a day last week.

    New hospital admissions, a more reliable metric these days, have also declined. A month ago, U.S. hospitals were admitting over 6,000 new COVID-19 patients a day; last week, that number was about 5,000. Wastewater data from Biobot and from the CDC suggest that this trend has been broadly consistent across different regions.

    But coronavirus transmission is not currently at low levels by any means. For example, look at Biobot’s national chart showing virus concentration in wastewater compared to officially-reported case numbers. From case numbers alone, you might think that COVID-19 is much less prevalent now than it was in late August or early September last year. But the wastewater data reveal that transmission now is actually pretty close to early-Delta surge levels. (It is, in fact, PCR testing that has declined.)

    Similarly, the CDC’s Community Transmission Levels (also known as the older metrics, based on cases and test positivity) show that about 90% of U.S. counties are currently facing high transmission and should require masks indoors. Even the current—and much more lenient—Community Levels suggest that more than half of the country is in a high- or medium-COVID-risk zone.

    The summer surge has waned so slowly thanks to the U.S.’s complete abandonment of measures to mitigate COVID-19’s spread, combined with the rise of newer Omicron subvariants. BA.5 continues to dominate here, causing almost 90% of new cases in the week ending September 3, though it’s facing competition from BA.4.6: a version of BA.4 that appears to have a slight advantage.

    Most experts agree that we will probably face another surge this fall and winter, as more people gather inside and travel for the holidays. The question is how severe that wave will be, which may be determined via a contest between updated vaccines (more on that later in the issue) and the coronavirus’ continued capacity for mutation.

    One potential sign of such a wave: wastewater surveillance in South Africa has picked up an increase in coronavirus concentration, Bloomberg reported yesterday. Also: your usual reminder to be wary of data trends in the days following the holiday weekend.

  • National numbers, July 31

    National numbers, July 31

    New hospital admissions for COVID-19 are slowing nationwide, a potential sign of the subvariant surge peaking. Chart via the CDC, retrieved on July 31.

    In the past week (July 23 through 29), the U.S. reported about 880,000 new COVID-19 cases, according to the CDC. This amounts to:

    • An average of 130,000 new cases each day
    • 269 total new cases for every 100,000 Americans
    • 1% fewer new cases than last week (July 16-22)

    In the past week, the U.S. also reported about 44,000 new COVID-19 patients admitted to hospitals. This amounts to:

    • An average of 6,300 new admissions each day
    • 13.5 total admissions for every 100,000 Americans
    • 2% more new admissions than last week

    Additionally, the U.S. reported:

    • 2,500 new COVID-19 deaths (0.8 for every 100,000 people)
    • 82% of new cases are caused by Omicron BA.5; 13% by BA.4 (as of July 23)
    • An average of 100,000 vaccinations per day (per Bloomberg)

    The U.S.’s Omicron BA.5 wave appears to be creeping past its plateau, according to several major indicators. Nationwide, 1% fewer new cases were reported this week compared to last week, the second week in a row of clear deceleration in this metric (with no major holidays interrupting reports).

    New hospital admissions are also slowing down: the number of COVID-19 patients newly admitted to hospitals this week was only 2% higher than it was last week. It’s a smaller increase than any reported week-over-week in the last couple of months.

    And the plateau is showing up in wastewater, too: data from Biobot Analytics show that the coronavirus concentration in America’s sewers dipped slightly last week in all four regions of the country. About 55% of sewersheds in the CDC’s wastewater surveillance network reported coronavirus decreases or very slight increases in the last week, compared to 45% reporting more significant increases.

    To me, these metrics are suggesting that the Omicron subvariant wave may be, finally, running out of people to infect (or reinfect). But the decline is incredibly slow, likely because the U.S. has taken almost no measures to curb transmission.

    The CDC’s community transmission guidance (also known as the old guidance, pre-February 2022 switch to “Community Levels”) suggests that Americans in 98% of counties should be masking indoors right now. But almost no state or local public health departments have actually brought back mask requirements. Even Los Angeles County failed to institute its planned indoor mask mandate, due to public pushback at the measure and cases trending down.

    Meanwhile, testing indicators continue to suggest that reported case counts are a small fraction of the actual coronavirus infections happening across the country right now. The national PCR test positivity rate was 18% last week, according to the CDC; and almost every state reported a positivity rate over 10%, according to the July 28 Community Profile Report. (Experts consider test positivity over 10% to be evidence of high transmission and insufficient testing.)

    As fewer PCR tests are conducted, the companies that process these tests are laying off workers and cutting their capacity, according to the Wall Street Journal. Even some companies that make at-home rapid tests are taking these measures, though rapid test capacity is still much higher than PCR testing capacity right now.

    The safety measures that can prevent coronavirus transmission have not changed with BA.5. Individuals and small communities still have the ability to keep using masks, testing, gathering in outdoor spaces, etc., even as our institutions fail to keep us safe.

  • National numbers, July 24

    National numbers, July 24

    Has the BA.5 surge reached a plateau? Data from wastewater and other sources seem to suggest, maybe. Chart via Biobot Analytics.

    In the past week (July 16 through 22), the U.S. reported about 880,000 new COVID-19 cases, according to the CDC. This amounts to:

    • An average of 130,000 new cases each day
    • 268 total new cases for every 100,000 Americans
    • 1% more new cases than last week (July 9-15)

    In the past week, the U.S. also reported about 43,000 new COVID-19 patients admitted to hospitals. This amounts to:

    • An average of 6,200 new admissions each day
    • 13.2 total admissions for every 100,000 Americans
    • 5% more new admissions than last week

    Additionally, the U.S. reported:

    • 2,400 new COVID-19 deaths (0.7 for every 100,000 people)
    • 78% of new cases are caused by Omicron BA.5; 13% by BA.4 (as of July 16)
    • An average of 100,000 vaccinations per day (per Bloomberg)

    Reported COVID-19 cases and hospital admissions seem to suggest that maybe the BA.5 surge is slowing down, at the national level. (And it is, definitively, the BA.5 surge, with almost 80% of new cases caused by this subvariant in the week ending July 16). According to CDC data, new cases only increased by 1% this week, compared to the week prior; last week, they increased by 17%.

    New hospital admissions, similarly, increased by 5% this week, compared to 15% the week prior. And wastewater data from Biobot are showing a potential national plateau in the last week, with very slight increases or decreases in all four main regions of the country.

    The CDC’s wastewater monitoring also shows that “most of the country is reporting moderate to high SARS-CoV-2 levels in wastewater.” About half of the 800 sites in the CDC network reported a decrease in coronavirus levels in the last two weeks, while 43% reported an increase.

    These are all good signs. But I’m skeptical that we’re anywhere near the end of this current surge, for a few reasons. First, the continued underreporting of cases makes it difficult to evaluate case data, both nationally and in local settings. (For example, is NYC actually seeing a decline in transmission, or is the recent decline there a result of less PCR testing?) The CDC reported a national PCR test positivity of 17% last week, and it’s even higher in many states.

    Second, the declines we’re seeing in hospital admissions and coronavirus levels in wastewater—both more reliable indicators than cases—are very slight. These patterns suggest that, while we may be near the peak of the BA.5 surge, it could take several weeks for it to actually abate. And by the time that happens, another new variant (maybe BA.2.75, maybe something else entirely) could likely come in and bump transmission again.

    Finally, the U.S. as a whole is doing very little to manage this surge. I think this subheading from a recent POLITICO Pro article provides a good summary of the situation: “Strategies for managing 130,000 new daily Covid cases are largely the same as they were for managing 30,000 new daily cases four months ago.”

    There’s been a slight uptick in second booster shots for Americans over age 50, according to CDC data. And a few, isolated localities are considering new mask mandates. But by and large, most people are heading into potential reinfection from BA.5 with limited protection. Stay safe out there.

  • National numbers, July 17

    National numbers, July 17

    More than 40% of COVID-19 tests conducted at Walgreens pharmacies in the last week came back positive. This is not a good indicator, to put it mildly.

    In the past week (July 9 through 15), the U.S. reported about 870,000 new COVID-19 cases, according to the CDC. This amounts to:

    • An average of 120,000 new cases each day
    • 265 total new cases for every 100,000 Americans
    • 16% more new cases than last week (July 2-8)

    In the past week, the U.S. also reported about 41,000 new COVID-19 patients admitted to hospitals. This amounts to:

    • An average of 5,900 new admissions each day
    • 12.5 total admissions for every 100,000 Americans
    • 14% more new admissions than last week

    Additionally, the U.S. reported:

    • 2,500 new COVID-19 deaths (0.8 for every 100,000 people)
    • 65% of new cases are caused by Omicron BA.5; 16% by BA.4 (as of July 9)
    • An average of 80,000 vaccinations per day (per Bloomberg)

    As I suspected last week, the small dip in official COVID-19 case numbers was a result of the July 4 holiday, not an actual decline in transmission. This week, cases are up again nationwide, with the highest number reported since early February.

    Of course, PCR testing capacity has declined substantially since February. And test positivity rates are high across the country: the CDC reported a nationwide rate of 17.5%, while the Walgreens COVID-19 Index (which compiles data from testing at Walgreens pharmacies) reports a rate of 42%. Such high positivity numbers indicate that our official case data are capturing a small fraction of cases.

    And we have other indicators of the substantial COVID-19 spread happening right now. Biobot’s wastewater tracker reports increased transmission nationwide and in all four regions in the last two weeks. Over half of sewershed sites in the CDC’s National Wastewater Surveillance System reported increases in the two weeks ending July 11—and for about one-third of sites, those increases were more than 100%.

    New hospital admissions of COVID-19 patients went up by 14% last week, similarly to the highest levels reported since February. Reports of COVID-19 symptoms are also on the upswing, according to survey data collected by the Delphi Group at Carnegie Mellon University.

    While some hospitalization metrics and deaths may be low at the moment, remember that these are lagging indicators: they go up a few weeks after cases. And cases are definitely going up right now, driven by the Omicron subvariant BA.5—which is now dominant in the country.

    BA.5 and BA.4 together caused more than 80% of new COVID-19 cases in the week ending July 9, according to CDC estimates. BA.5 is pulling ahead, though, readily reinfecting people in a national climate that seems to have largely given up on safety measures.

    But measures like masking, testing, and booster shots can still reduce transmission. I was heartened this week to see Los Angeles County preparing for a new indoor mask mandate in response to rising cases; other places should follow this lead.

  • National numbers, July 10

    National numbers, July 10

    Almost the entire country is currently experiencing high COVID-19 transmission, according to the old CDC guidance. And that’s just the cases we know about.

    In the past week (July 2 through 8), the U.S. reported about 750,000 new COVID-19 cases, according to the CDC. This amounts to:

    • An average of 110,000 new cases each day
    • 227 total new cases for every 100,000 Americans
    • 4% fewer new cases than last week (June 25-July 1)

    In the past week, the U.S. also reported about 36,000 new COVID-19 patients admitted to hospitals. This amounts to:

    • An average of 5,000 new admissions each day
    • 10.8 total admissions for every 100,000 Americans
    • 3% more new admissions than last week

    Additionally, the U.S. reported:

    • 1,900 new COVID-19 deaths (0.6 for every 100,000 people)
    • 27% of new cases are Omicron BA.2.12.1-caused; 70% BA.4/BA.5-caused (as of July 2)
    • An average of 150,000 vaccinations per day (per Bloomberg)

    Our prolonged Omicron subvariant surge continues, now dominated clearly by BA.5. While reported COVID-19 cases dipped slightly last week at the national level, this is almost certainly a result of the July 4 holiday rather than an actual slowing in coronavirus transmission.

    As evidence, note that the number of COVID-19 patients newly reported to hospitals—a metric less impacted by holidays—continued to rise last week. About 5,000 new patients were admitted each day, double the hospitalization rate in early May.

    Anecdotally, it seems like everyone knows someone who has COVID-19, even if their cases aren’t making it into official data due to at-home tests. And many of those people sick right now already had Omicron BA.1—or even BA.2—earlier this year. Such is the power of BA.4 and BA.5, the subvariants that have taken over the U.S. and many other countries in recent weeks.

    BA.5 in particular seems to have a competitive advantage over all other Omicron subvariants. It’s now causing the majority of new COVID-19 cases in the country, with the most recent CDC estimates placing it at 54% prevalence as of July 2. This recent New York Magazine article does a good job of explaining by BA.5 is so worrying, as does this piece in the Guardian.

    To quote from Melody Schreiber’s Guardian article:

    “Covid-19 is very clearly not over. We’re seeing dramatic increases in the number of cases and hospitalizations in many places throughout the United States,” said Jason Salemi, an associate professor of epidemiology at the University of South Florida’s College of Public Health.

    As BA.5, one of the Omicron sub-variants, begins buffeting the US, “we’re headed in a bad direction”, Salemi said. “We’ve seen it coming for a while … We’ve seen it go pretty unabated.”

    More than one in three Americans live in a county at medium risk from Covid, and one in five are at high risk, according to the US Centers for Disease Control and Prevention (CDC) . That’s the highest proportion of the country facing risks since February, Salemi said.

    Wastewater data from Biobot similarly shows transmission continuing to plateau or increase throughout the country. The Northeast, one region where BA.2 and BA.2.12.1 seemed to peak a couple of weeks ago, is now reporting case increases again. In New York City, for example, all five boroughs are now back in the CDC’s “high risk for hospitalizations” category.

    As this surge continues, essential workers and those who are medically vulnerable continue to be most at risk. Remember this, when you consider masking and other precautions.