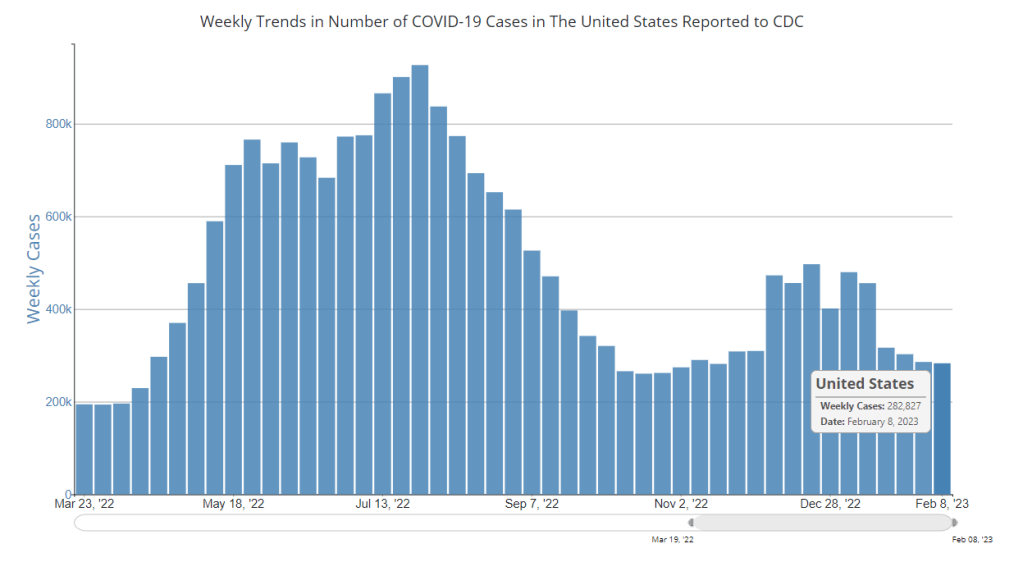

In the past week (March 23 through 29), the U.S. officially reported about 140,000 new COVID-19 cases, according to the CDC. This amounts to:
- An average of 20,000 new cases each day
- 43 total new cases for every 100,000 Americans
- 9% fewer new cases than last week (March 16-22)
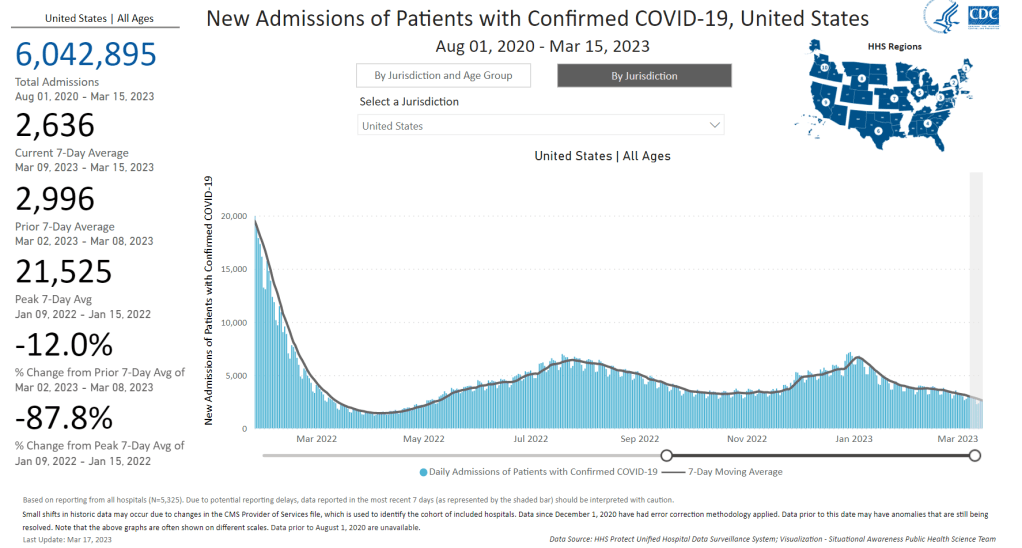
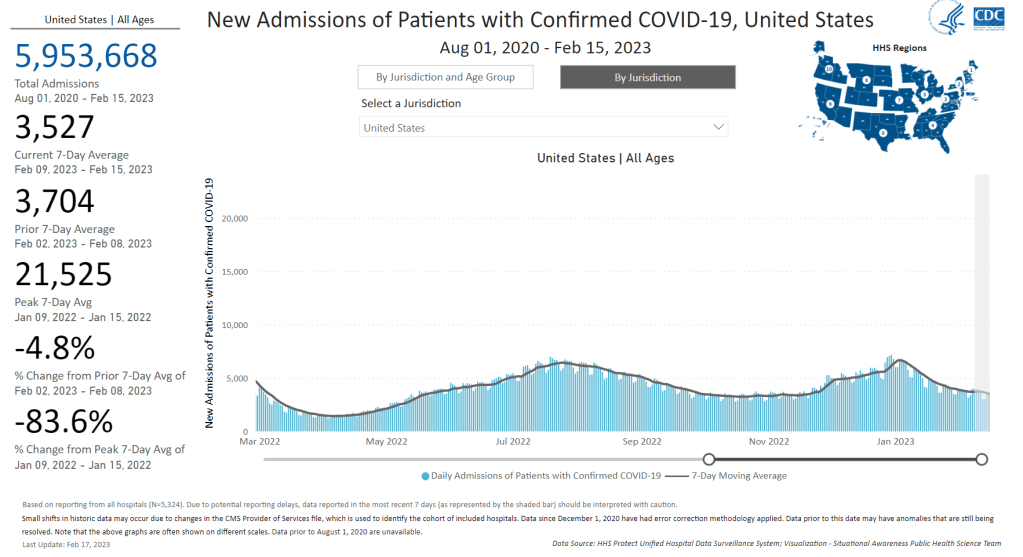
In the past week, the U.S. also reported about 17,000 new COVID-19 patients admitted to hospitals. This amounts to:
- An average of 2,400 new admissions each day
- 5.1 total admissions for every 100,000 Americans
- 5% fewer new admissions than last week
Additionally, the U.S. reported:
- 1,600 new COVID-19 deaths (230 per day)
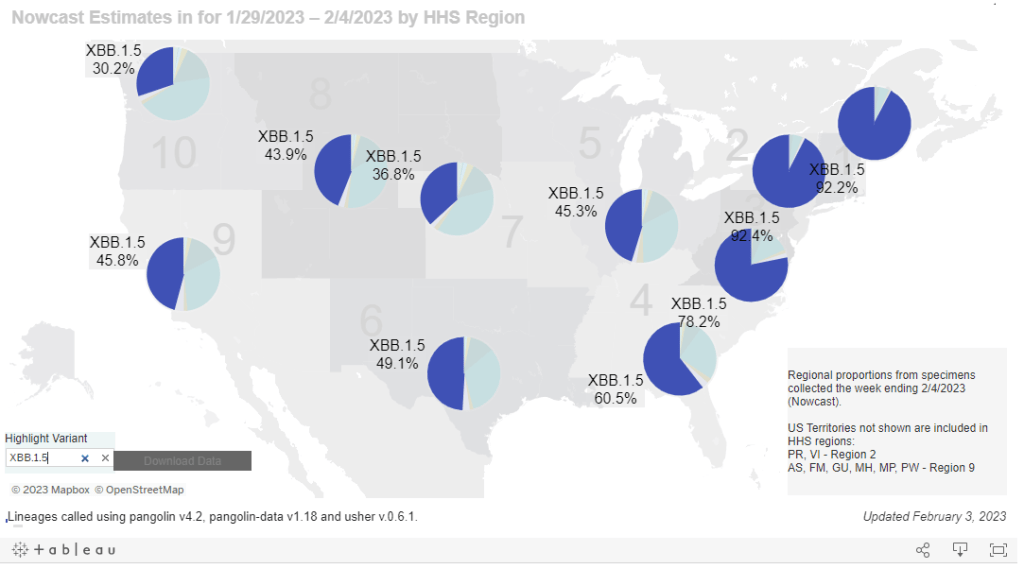
- 88% of new cases are caused by Omicron XBB.1.5; 5% by XBB.1.9.1; 2% by XBB.1.5.1; 0.4% by CH.1.1 (as of March 18)
- An average of 40,000 vaccinations per day
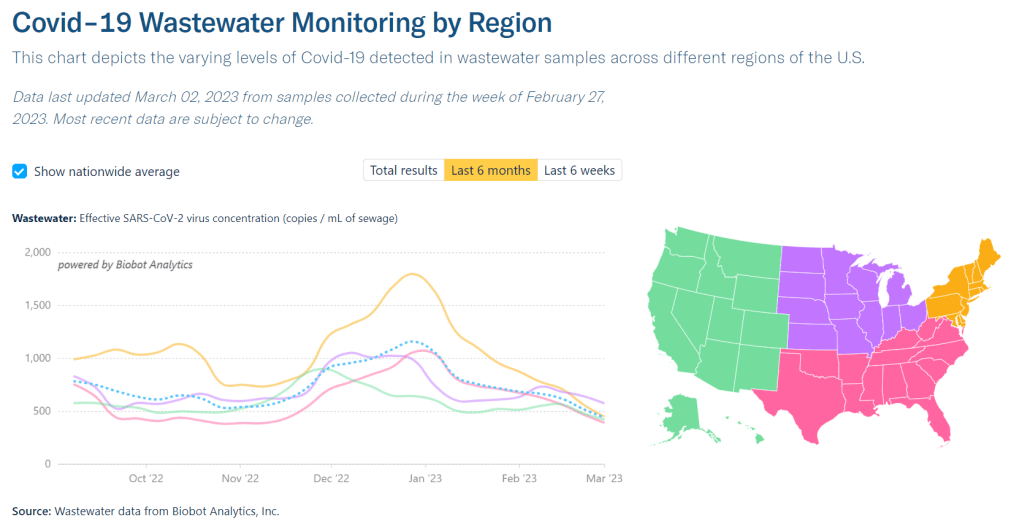
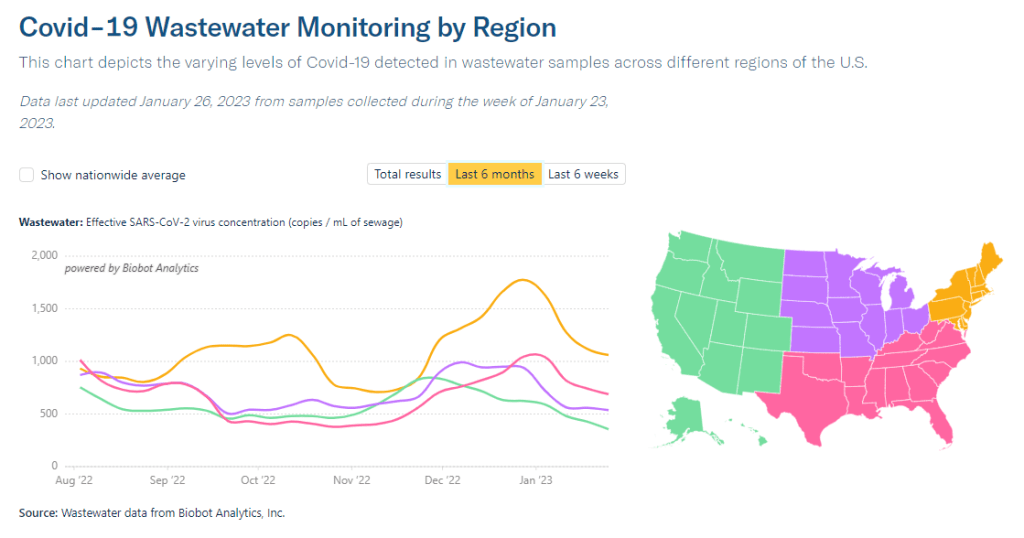
While official COVID-19 cases and hospitalizations continue to trend ever-so-slightly downward, wastewater surveillance data show potential new upticks in transmission. Despite continued minimal safety measures in most places, we have to remain wary of a potential spring surge.
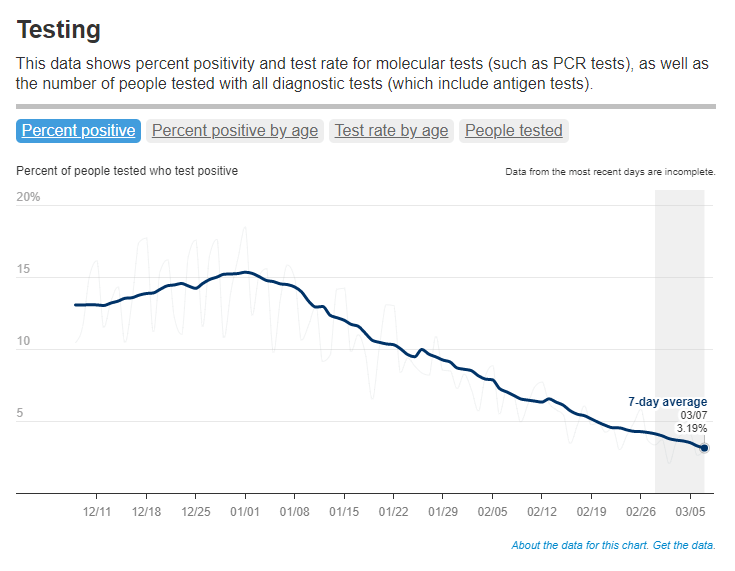
Official data from the CDC suggested that cases and new hospital admissions dropped very slightly last week, compared to the week prior. But case data continue to be plagued with reporting delays; again this week, multiple states (Florida, Delaware, Mississippi, Oklahoma) reported no cases or had other issues. These delays make it difficult to assess patterns at state or county levels.
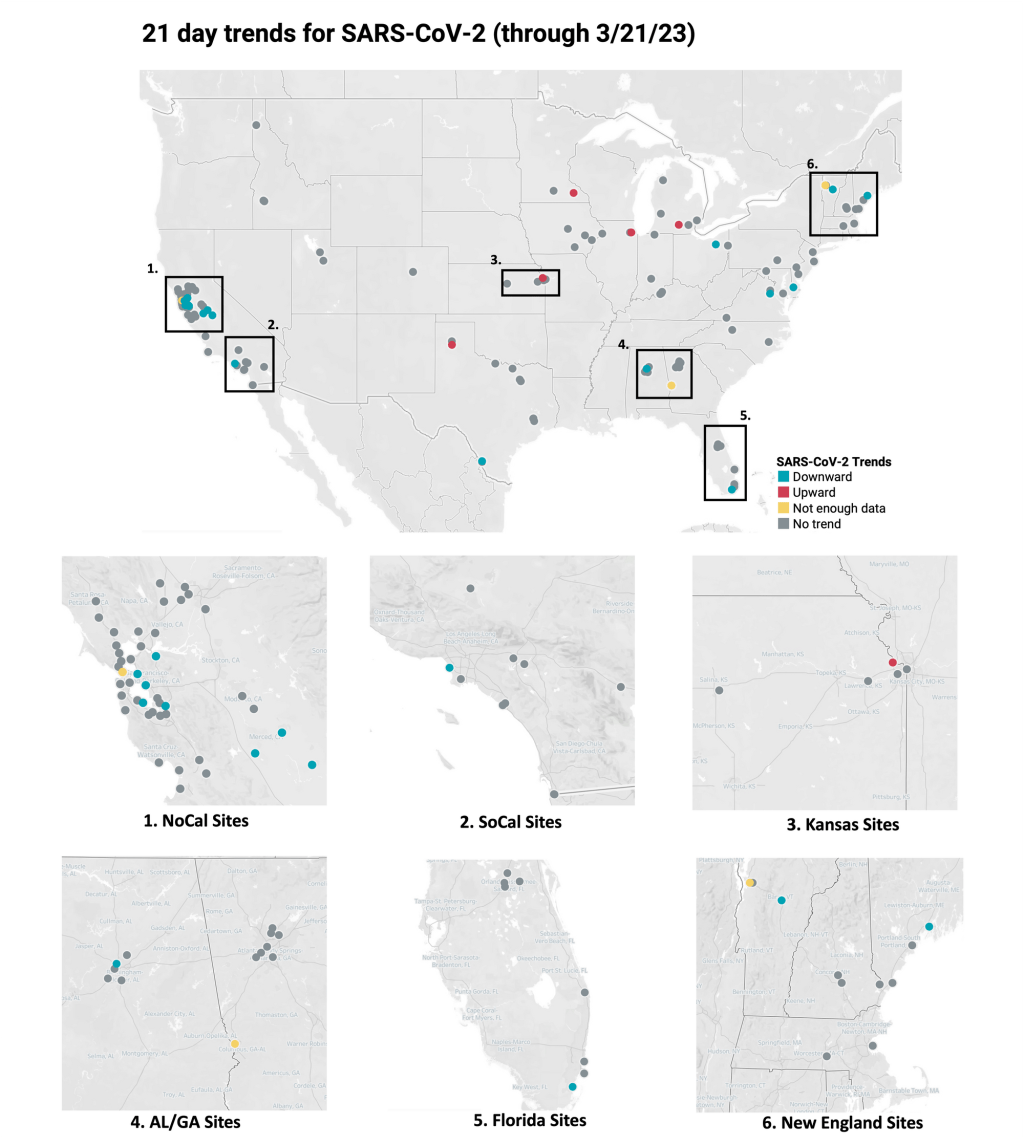
Wastewater surveillance data provide more accurate early warnings about potential rising transmission. This week, Biobot’s data suggest slight increases in all four major regions of the country. It’s worth noting, though, that Biobot’s most recent data are preliminary. I’ll be closely watching the dashboard’s next updates, this coming Tuesday and Thursday.
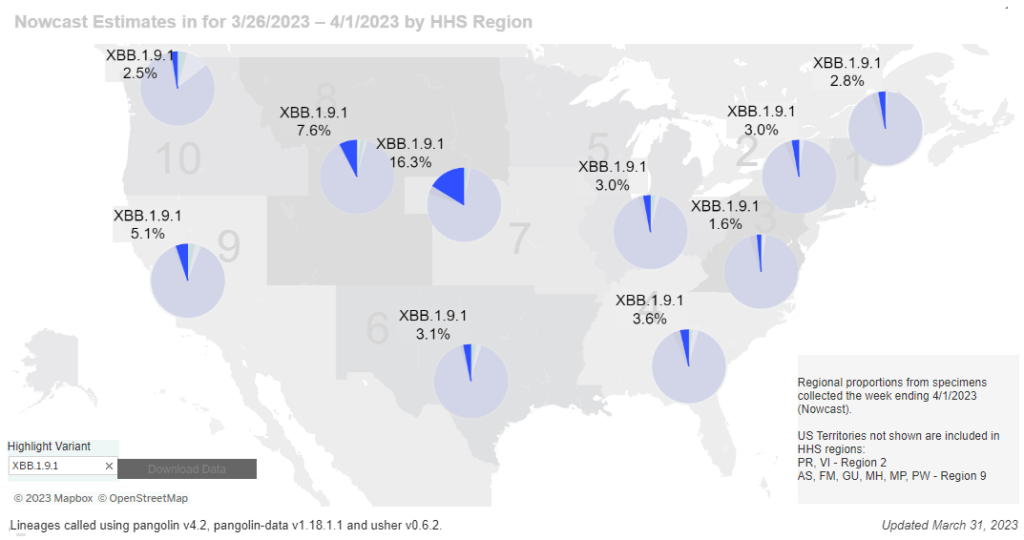
The latest Omicron variant of concern, XBB.1.9.1, could be one reason for increasing coronavirus levels. This subvariant caused an estimated 5% of new cases across the country nationwide last week, according to the CDC’s Nowcast analysis. At the same time, XBB.1.5 has declined for the first time since it emerged a couple of months ago, suggesting XBB.1.9.1 might slowly outcompete it.
XBB.1.9.1 is most prevalent in the Midwest, particularly the region including Iowa, Kansas, Missouri, and Nebraska. Some counties in this region are also reporting significant coronavirus increases in their wastewater, according to Biobot and WastewaterSCAN. Missouri’s wastewater dashboard similarly shows increases across the state.
In our current era of high background coronavirus spread (and few-to-no widespread safety measures), a new variant can easily cause concerning outbreaks. It’s important to remember that, no matter how much the virus evolves, simple measures like masks and ventilation can still make transmission less likely.