Tag: National numbers

  • National numbers, June 11

    National numbers, June 11

    Some NYC sewershed have reported substantial increases in coronavirus levels in recent weeks. Screenshot from the New York State wastewater dashboard.

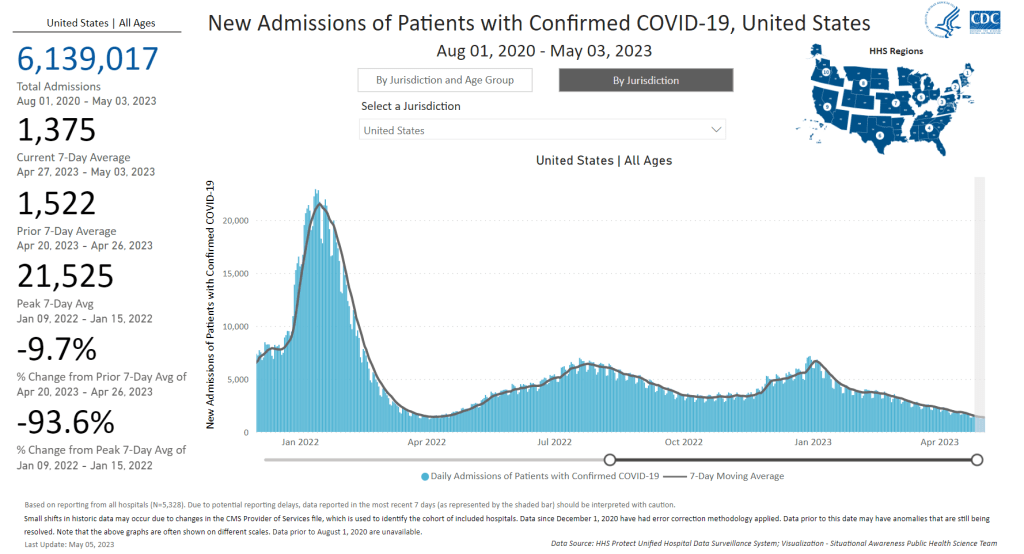
    In the past week (May 28 through June 3), the U.S. reported about 7,200 new COVID-19 patients admitted to hospitals, according to the CDC. This amounts to:

    • An average of 1,000 new admissions each day
    • 2.2 total admissions for every 100,000 Americans
    • 6% fewer new admissions than last week (May 21-27)

    Additionally, the U.S. reported:

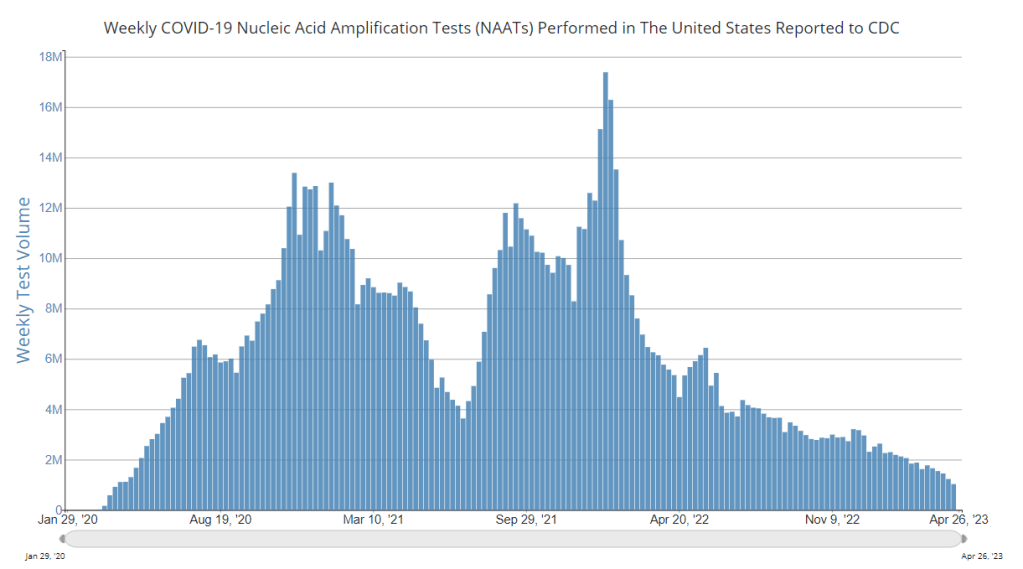
    • 4.2% of tests in the CDC’s surveillance network came back positive (an 8% decrease from last week)
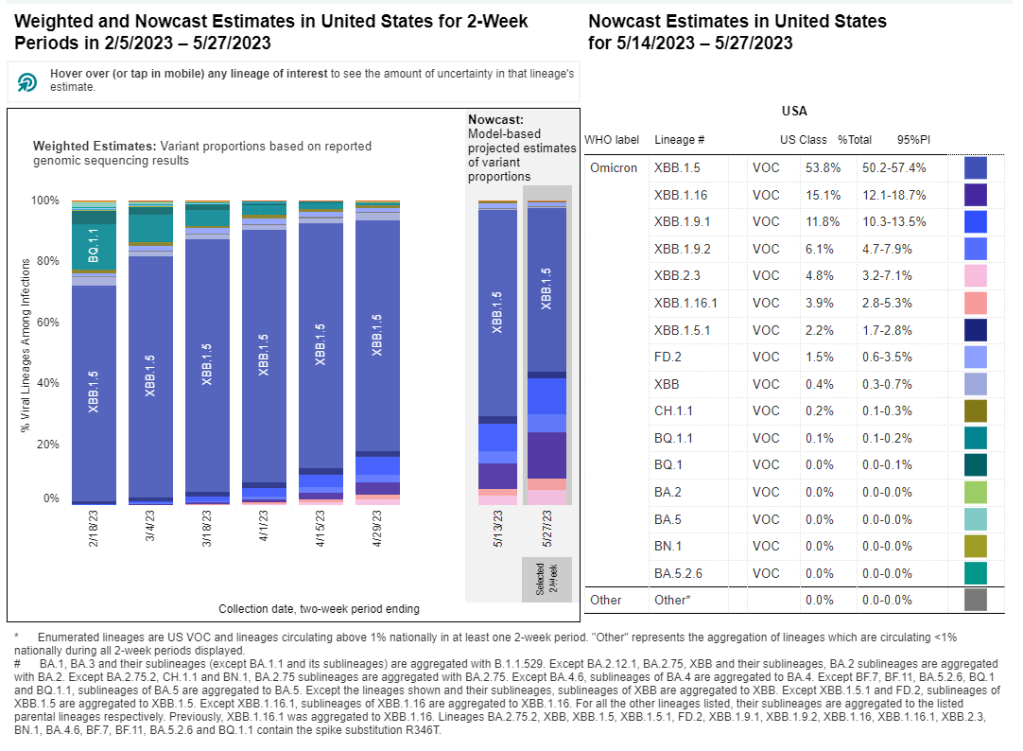
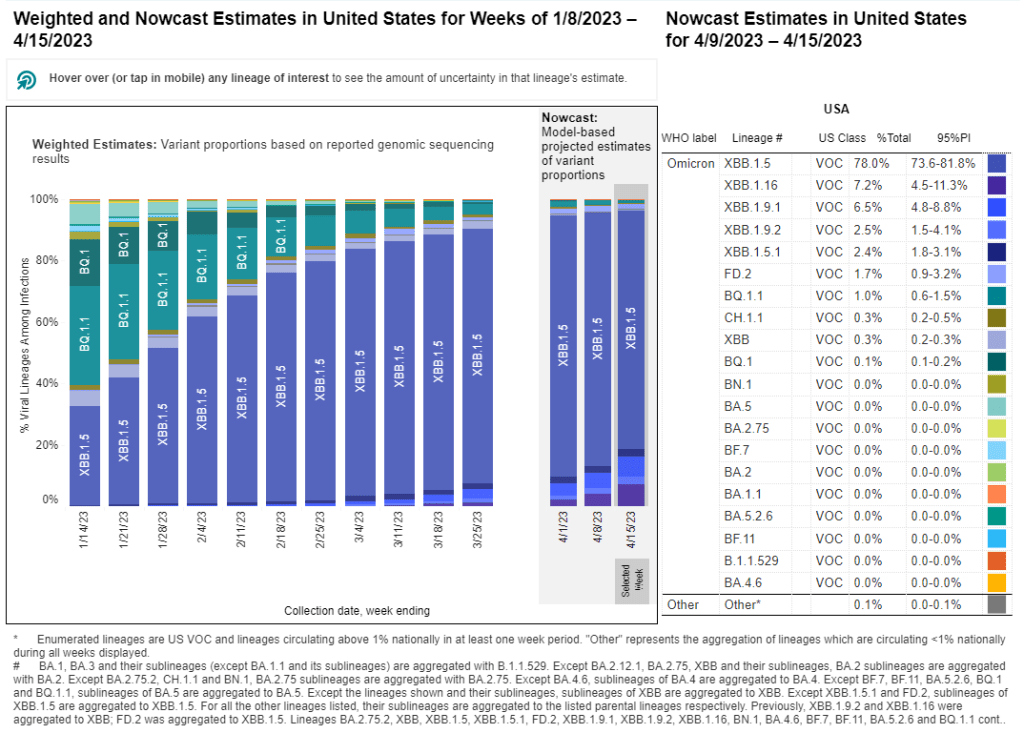
    • 40% of new cases are caused by Omicron XBB.1.5; 26% by XBB.1.16; 21% by XBB.1.9 (as of June 10)
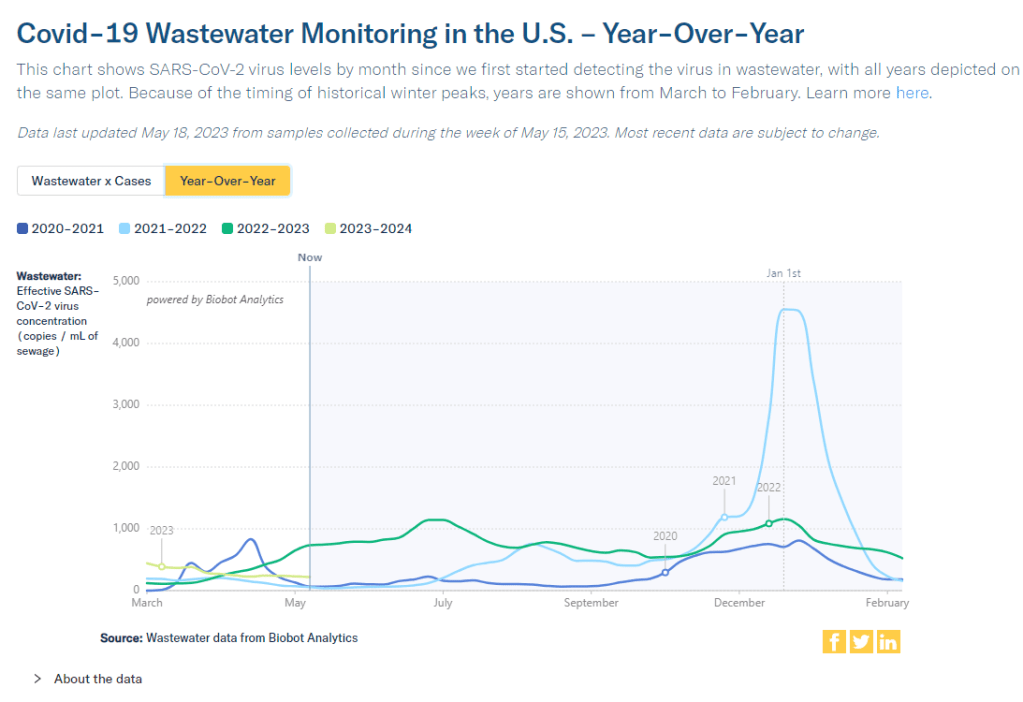
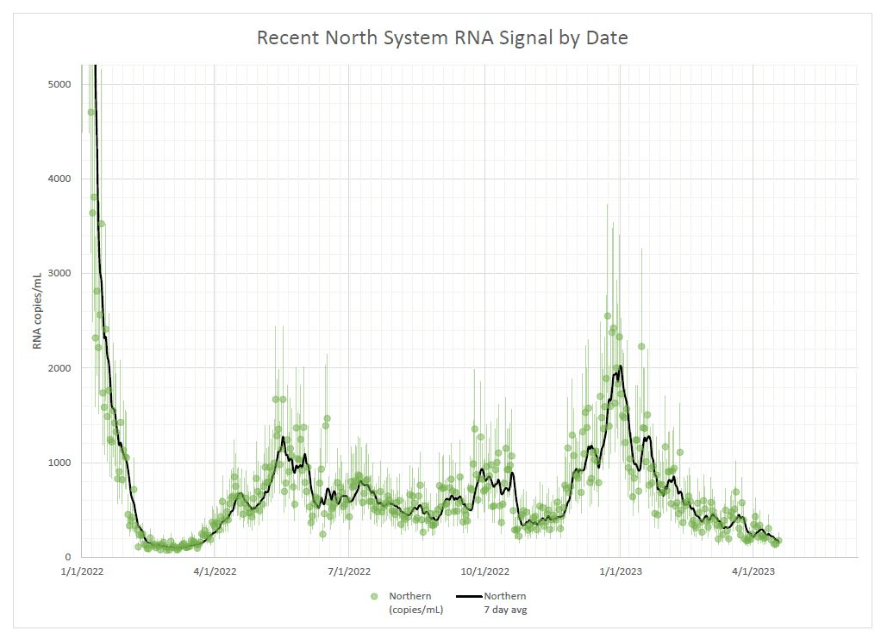
    • (Biobot update delayed)

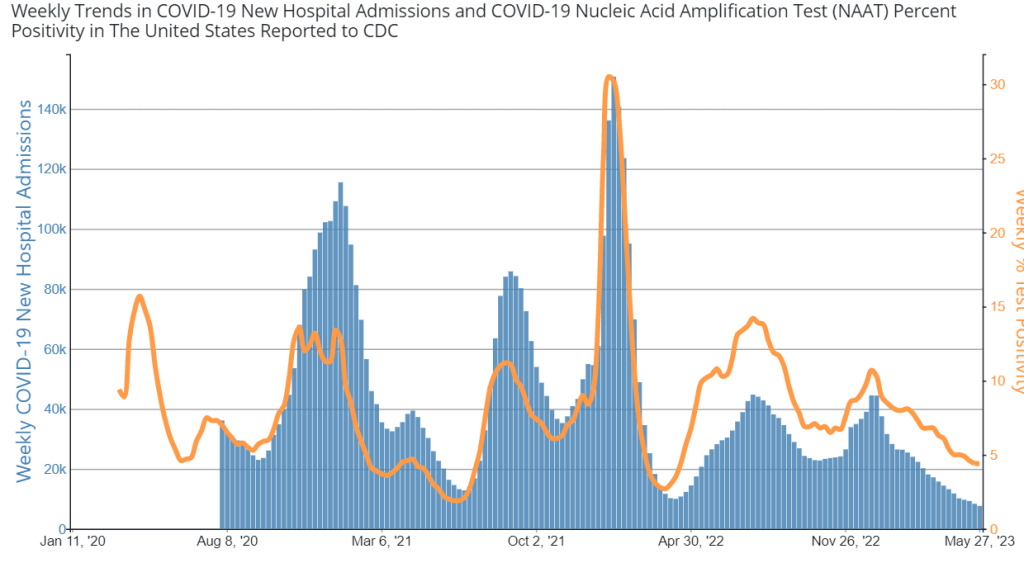
    Nationally, the COVID-19 situation in the U.S. is similar to where we’ve been for the last few weeks. Major metrics (such as we have them) show an overall plateau in disease spread. Wastewater trends in a few places suggest a summer surge might be coming, but it’s hard to say for sure.

    Hospital admissions and test positivity (from the specific network of labs reporting to the CDC) are trending slightly down at the national level. But there are still about 1,000 people being hospitalized with COVID-19 every day.

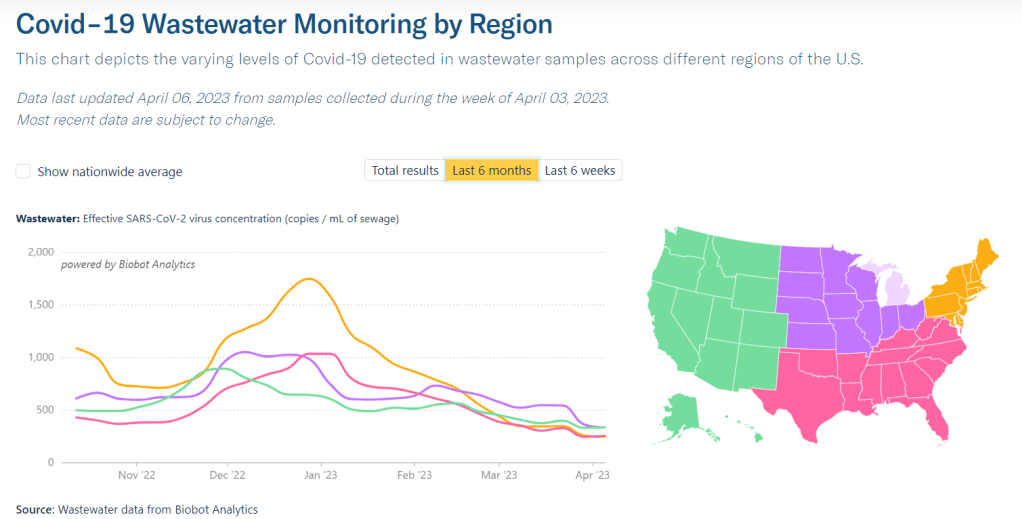
    Biobot Analytics, my usual go-to source for wastewater surveillance data, did not update their dashboard this week due to a tech issue. The company’s most recent data, as of May 29, show plateaus in all four major regions.

    The CDC’s National Wastewater Surveillance System (NWSS) shows a similar picture. Among about 1,100 sewage testing sites that recently reported to the CDC, 60% reported decreases in coronavirus levels in the last two weeks while 40% reported increases.

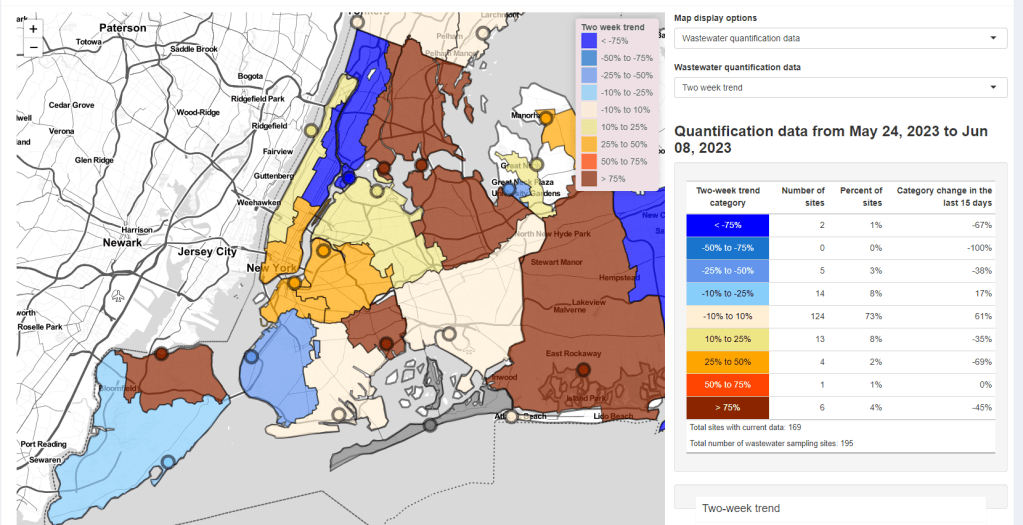
    New York City is one of the places seeing wastewater increases, as I noted last week. Patterns differ somewhat across the city’s fourteen sewersheds, with some reporting more than 1000% increases in wastewater levels in recent weeks while others are still in plateaus.

    Both the New York/New Jersey and New England regions are reporting slight upticks in their test positivity, according to the CDC’s surveillance network. This (along with the trends in NYC’s sewage) could be a precursor of more COVID-19 spread this summer, but it’s currently hard to say for sure.

    The CDC updated its variant estimates (now reported every other week) this past Friday. XBB.1.5 is still the most common lineage, causing an estimated 40% of cases, the CDC reports. XBB.1.16 and XBB.1.9 continue to outcompete it, causing about 26% and 21% of cases respectively.

    These newer lineages have yet to contribute to a significant shift in transmission, from what I can tell. We have yet to see if past immunity in the U.S. can hold off against the ever-evolving Omicron variants this summer.

  • National numbers, June 4

    National numbers, June 4

    Both hospital admissions and test positivity for COVID-19 have ticked down in recent weeks. Chart via the CDC.

    In the past week (May 21 through 27), the U.S. reported about 7,600 new COVID-19 patients admitted to hospitals, according to the CDC. This amounts to:

    • An average of 1,100 new admissions each day
    • 2.3 total admissions for every 100,000 Americans
    • 8% fewer new admissions than last week (May 14-20)

    Additionally, the U.S. reported:

    • 4.4% of tests in the CDC’s surveillance network came back positive (a 0% change from last week)
    • A 17% lower concentration of SARS-CoV-2 in wastewater than last week (as of May 31, per Biobot’s dashboard)
    • 54% of new cases are caused by Omicron XBB.1.5; 19% by XBB.1.16; 18% by XBB.1.9 (as of May 27)

    The COVID-19 plateau of the last few weeks continues at the national level, though experts are concerned that a summer surge could occur in parts of the country. Wastewater surveillance and testing data are indicating potential increases in the New York City region.

    Hospital admissions for COVID-19 remain at the levels we’ve seen throughout the spring, with about 1,100 people admitted nationwide each day last week. These numbers are similar to the hospitalizations reported at previous low points for COVID-19, in spring 2022 and 2021.

    Testing data from the CDC’s National Respiratory and Enteric Virus Surveillance System (NREVSS) also suggest a plateau: national test positivity didn’t change from last week to this week. While this CDC system includes a small fraction of the PCR labs that reported COVID-19 tests before the federal emergency ended, it’s still a helpful indicator for testing trends.

    Wastewater surveillance data from Biobot shows a similar picture, with coronavirus levels in sewage remaining consistent at the national level for the last two months. All four major regions of the country are trending down, according to Biobot’s analysis.

    But national data can hide more concerning trends at the local level. Wastewater data from New York City’s fourteen water treatment plants suggest potential increases in COVID-19 spread in the city and outlying suburbs over the last couple of weeks. The city’s wastewater data are reported with a delay (as of today, the most recent update was May 21), so I find it worrying that an increase may have predated the Memorial Day holiday. Test positivity data for the New York/New Jersey region suggest an uptick as well.

    NYC has been a bellwether for the rest of the U.S. at many points during the pandemic, and it’s possible that the city could see a surge before other regions again this summer. Health experts are also closely watching the South, where people gather indoors more in the summer.

    About 96% of Americans over age 16 have some COVID-19 protection from vaccination, past infections, or both, according to a recent CDC study. This protection will help many people avoid severe COVID-19 symptoms this summer even if they get infected. But Long COVID continues to be a risk—potentially even escalating with more infections.

  • National numbers, May 28

    National numbers, May 28

    The CDC is now updating its variant estimates every two weeks.

    In the past week (May 14 through 20), the U.S. reported about 8,300 new COVID-19 patients admitted to hospitals, according to the CDC. This amounts to:

    • An average of 1,200 new admissions each day
    • 2.5 total admissions for every 100,000 Americans
    • 11% fewer new admissions than last week (May 7-13)

    Additionally, the U.S. reported:

    • A 16% lower concentration of SARS-CoV-2 in wastewater than last week (as of May 24, per Biobot’s dashboard)
    • 54% of new cases are caused by Omicron XBB.1.5; 19% by XBB.1.16; 18% by XBB.1.9 (as of May 27)

    The COVID-19 plateau continues, with hospital admissions and viral levels in wastewater (the two main metrics I’m looking at these days) both trending slightly down at the national level. Newer Omicron variants are still on the rise, but don’t seem to be impacting transmission much yet.

    Hospitalizations continue to trend slightly down across the board, though hospitals are still reporting more than 1,000 new COVID-19 patients each day. The vast majority of U.S. counties have low hospitalization levels, according to the CDC, with just 14 counties in the medium or high categories.

    Coronavirus levels in wastewater are following a similar pattern: trending down very slightly, continuing the middling plateau of the last couple of months. All four major regions are still in this holding pattern, according to Biobot’s data.

    We have new variant data this week, as the CDC is now on a biweekly schedule for updates. XBB.1.5 caused just over half of new cases in the U.S. in the two weeks ending May 27, as it slowly gets outcompeted by newer versions of Omicron. XBB.1.16 and XBB.1.9 continue to rise, causing 19% and 18% of hew cases respectively.

    XBB.1.16 is most prevalent on the West Coast, the Northeast, and the Gulf Coast states, while XBB.1.9 is most prevalent in the Midwest, according to the CDC—though these estimates are becoming less reliable over time, since so few COVID-19 samples are sequenced.

    The CDC has also recently added national and regional COVID-19 test positivity data back to its dashboard, representing tests conducted by labs in the CDC’s National Respiratory and Enteric Virus Surveillance System.

    Nationally, test positivity is trending down, at just under 5% of COVID-19 tests (in this lab network) returning positive results in the most recent week of data. Test positivity is trending up slightly in the Northeast and New York/New Jersey regions; I’ll be following to see if this continues in the coming weeks.

    Finally, a bit of good news: excess deaths in the U.S. have returned to baseline in the last couple of months. While hundreds are still dying from COVID-19 every day, the excess death trend suggests that the disease is currently not causing a significant ripple effect on overall mortality the way that it did in earlier stages of the pandemic. (Of course, this could change with a new surge.)

  • National numbers, May 21

    National numbers, May 21

    According to wastewater data from Biobot, COVID-19 spread right now is lower than at this time last year, but higher than the prior two years.

    In the past week (May 7 through 13), the U.S. reported about 9,200 new COVID-19 patients admitted to hospitals, according to the CDC. This amounts to:

    • An average of 1,300 new admissions each day
    • 2.8 total admissions for every 100,000 Americans
    • 5% fewer new admissions than last week (April 30-May 6)

    Additionally, the U.S. reported:

    • A 4% lower concentration of SARS-CoV-2 in wastewater than last week (as of May 17, per Biobot’s dashboard)
    • 64% of new cases are caused by Omicron XBB.1.5; 13% by XBB.1.9; 14% by XBB.1.16 (as of May 13)
    • An average of 75,000 vaccinations per day

    Nationwide, COVID-19 spread in the U.S. continues to be in a somewhat-middling plateau: lower than the massive amount of Omicron transmission we all got used to throughout late 2022, but still higher than the lulls between outbreaks we saw in prior years.

    Biobot’s national wastewater surveillance offers a helpful visual for this comparison. As of May 20, the company calculates a national average of 221 viral copies per milliliter of sewage (a common unit for quantifying SARS-CoV-2 in wastewater), based on hundreds of sewage testing sites in its network.

    In late May of last year, when early Omicron offshoots were spreading widely, this value was several times higher: 736 viral copies per milliliter. But around the same time in 2021 (when millions of Americans were getting their first vaccine shots) or 2020 (when the very first big surge had ended), wastewater concentrations were under 100 viral copies per milliliter.

    It’s also important to note that wastewater concentrations have been fairly level for a couple of months now, both nationally and for all four major regions. High immunity across the population and a lack of divergent new variants have kept us from seeing a new surge since the 2022 winter holidays; but without widespread safety measures, I suspect we’re unlikely to see a drop in transmission below the current baseline.

    Hospital admissions, now the CDC’s primary metric for tracking this disease, show a similar picture to the wastewater data. Numbers are low and ticking ever-so-slightly downward, but they’re not zero: about 1,300 people were admitted to hospitals with COVID-19 each day in the week ending May 13.

    Deaths with COVID-19 also remain at low yet significant numbers. While the CDC reports only 281 deaths in the last week, this information is now presented with a greater delay than during the federal public health emergency, as the agency had to switch from death reports received directly from states to death certificate data. For the week ending May 6, the CDC revised its number up from about 300 to 622 COVID-19 deaths.

    There are no changes to variant estimates this week, as the CDC is now updating that data every other week rather than weekly. XBB.1.5 remains the dominant variant, with XBB.1.16 and XBB.1.19 slowly gaining ground.

    Overall, it’s getting harder to identify detailed COVID-19 trends, but a lot of data still do remain available. I’ll keep providing updates as best I can.

  • National numbers, May 14

    National numbers, May 14

    The CDC and its partners are sequencing far fewer coronavirus samples than they have at prior periods of the pandemic, making it harder to spot new variants of concern.

    In the past week (April 30 through May 6), the U.S. reported about 9,500 new COVID-19 patients admitted to hospitals, according to the CDC. This amounts to:

    • An average of 1,400 new admissions each day
    • 2.9 total admissions for every 100,000 Americans
    • 7% fewer new admissions than last week (April 22-29)

    Additionally, the U.S. reported:

    • A 14% lower concentration of SARS-CoV-2 in wastewater than last week (as of May 10, per Biobot’s dashboard)
    • 64% of new cases are caused by Omicron XBB.1.5; 13% by XBB.1.9; 14% by XBB.1.16 (as of May 13)
    • An average of 70,000 vaccinations per day

    COVID-19 spread continues to trend down in the U.S., though our data for tracking this disease is now worse than ever thanks to the end of the federal public health emergency. If newer Omicron variants cause a surge this summer, those increases will be hard to spot.

    As a result of the PHE’s conclusion this week, the CDC is no longer collecting national case counts or testing data. Instead, the agency now recommends using hospitalization data to monitor how hard COVID-19 is hitting your community—even though this metric typically lags behind actual infection patterns—while variant data and wastewater surveillance may provide warnings about new surges.

    My national updates will take a similar approach. This week, hospital admissions continue their national plateau, with a decrease of about 7% from the week ending April 29 to the week ending May 6. The CDC’s national map show that admissions are low across the country, with 99% of counties reporting fewer than 10 new admissions per 100,000 residents.

    Wastewater surveillance also suggests that, while there’s still a lot of COVID-19 in the U.S., disease spread is still on a plateau or slight decline in most of the country. Biobot’s data show a minor national downturn in recent weeks; trends are similar across the four major regions, though the decline is a bit steeper on the West Coast.

    The variant picture also hasn’t changed much: XBB.1.5 caused about two-thirds of new cases in the last two weeks, according to the CDC’s estimates. XBB.1.6 caused about 14% and XBB.1.9 caused 13%; these newer versions of Omicron are gaining ground, but fairly slowly. Regionally, XBB.1.6 is most prevalent in the Northeast and on the West Coast, while XBB.1.9 is most prevalent in the Midwest.

    It’s worth noting, though, that the CDC has switched its variant reporting from weekly to every other week, as fewer patient specimens are going through sequencing for variant identification. The agency and its surveillance partners are sequencing around 5,000 samples every week, compared to over 80,000 a week at the height of the first Omicron surge.

    Limited sequencing efforts will make it harder for the CDC to quickly identify (and respond to) new variants of concern. The same challenge is happening around the world, as PCR tests become less broadly available. Sequencing coronavirus samples from wastewater may help, but that’s only happening in a small subset of sewage testing sites right now.

    One last bit of good news: vaccine administration numbers are up in the last couple of weeks, as seniors and other eligible high-risk people get their second bivalent boosters. About 70,000 people received vaccines each day this week, compared to around half that number a few weeks ago. If you’re eligible for a second booster, this is a good time to make an appointment!

  • National numbers, May 7

    National numbers, May 7

    New hospital admission for COVID-19 continue to drop, though they are at higher levels than we’ve seen in past lulls. Chart from the CDC dashboard.

    In the past week (April 27 through May 3), the U.S. officially reported about 77,000 new COVID-19 cases, according to the CDC. This amounts to:

    • An average of 11,000 new cases each day
    • 14% fewer new cases than last week (April 20-26)

    In the past week, the U.S. also reported about 10,000 new COVID-19 patients admitted to hospitals. This amounts to:

    • An average of 1,400 new admissions each day
    • 2.9 total admissions for every 100,000 Americans
    • 10% fewer new admissions than last week

    Additionally, the U.S. reported:

    • 1,100 new COVID-19 deaths (150 per day)
    • 67% of new cases are caused by Omicron XBB.1.5; 13% by XBB.1.9; 13% by XBB.1.16 (as of May 6)
    • An average of 60,000 vaccinations per day

    The national COVID-19 plateau persists. Cases, new hospitalizations, and wastewater surveillance all indicate slight declines (but persistent disease spread) across the country. New variants are on the rise, but have yet to noticeably change these trends.

    New COVID-19 cases declined by about 14% last week compared to the week prior, while hospital admissions declined by 10%. While the case numbers might seem low (just 11,000 reported each day), they are a drastic undercount of true infections, as we can see by comparing total new cases to new hospitalizations.

    This week, the CDC’s reported cases were about eight times the number of new hospital admissions reported by the agency. While this time last year, new cases were 30 times new hospital admissions. In other words, as case reporting gets less accurate, we are still tracking cases with severe sypmtoms (i.e. those that require hospitalization), but missing many of the mild or asymptomatic cases—that could still lead to detrimental outcomes, like Long COVID.

    Wastewater surveillance—which provides population-level data regardless of how many people are getting PCR tests or otherwise seeking healthcare—suggests that the U.S. has been at an overall plateau of COVID-19 spread, but a higher one than we’ve experienced in past lulls (such as in spring 2021, when people were receiving their first vaccine doses).

    Biobot’s national wastewater data shows fairly steady transmission for the last month. The company’s regional data shows a similar picture; the West Coast has slightly higher coronavirus levels than the other three major regions, but is on a decline. A few counties in California and other West states have seen increases recently, but it’s not a sustained pattern across the board.

    Newer versions of the Omicron variant are competing with XBB.1.5, but the transition is happening slowly. XBB.1.5 still caused about two-thirds of new cases in the U.S. last week, according to CDC estimates, while XBB.1.16 and XBB.1.9 both caused about 13% of new cases.

    It’s currently hard to say if the country will face a real surge from XBB.1.16 and XBB.1.9. XBB.1.16 has wreaked some havoc internationally, but it may be similar enough to the variants now circulating in the U.S. that it won’t make a huge dent. Or, if we do see an increase in cases, it could be more like a “mini-wave” of largely-mild infections than a surge that really strains the healthcare system.

    This “mini-wave” idea has been covered by a few news outlets recently, including Nature and the Atlantic. It’s certainly promising that the U.S. hasn’t had a real surge since the winter holidays, now almost six months ago—but we have to remember that any new cases, no matter how low the numbers are, can lead to potential severe symptoms and long-term illness. I, for one, am not letting up my guard on safety.

  • National numbers, April 30

    National numbers, April 30

    The number of COVID-19 tests reported to the CDC has declined precipitously since peak COVID-19 surges, even though COVID-19 spread has not. Chart from the CDC.

    In the past week (April 20 through 26), the U.S. officially reported about 88,000 new COVID-19 cases, according to the CDC. This amounts to:

    • An average of 13,000 new cases each day
    • 10% fewer new cases than last week (April 13-19)

    In the past week, the U.S. also reported about 11,000 new COVID-19 patients admitted to hospitals. This amounts to:

    • An average of 1,500 new admissions each day
    • 3.2 total admissions for every 100,000 Americans
    • 16% fewer new admissions than last week

    Additionally, the U.S. reported:

    • 1,100 new COVID-19 deaths (150 per day)
    • 69% of new cases are caused by Omicron XBB.1.5; 13% by XBB.1.9; 12% by XBB.1.16 (as of April 29)
    • An average of 40,000 vaccinations per day

    Major COVID-19 metrics continue to suggest an ongoing (though slight) decline in the virus’ spread nationally, despite the rise of newer and more contagious variants. The moderate plateau persists.

    Officially-reported cases and new hospital admissions declined by 10% and 16% respectively last week, compared to the week prior. According to the CDC’s data notes, three states (Florida, Iowa, and Pennsylvania) did not report cases last week, while two states (Louisiana and Indiana) reported extra cases from their historical backlogs.

    In addition to the ongoing reporting issues from state health departments, it’s important to remember that PCR testing continues to decline across the country. About one million PCR and similar lab test results were reported to the CDC last week, compared to peaks over 10 million per week during major surges.

    Still, the hospitalization numbers and wastewater surveillance data lead me to suggest that we really are in a transmission plateau. Wastewater data from Biobot show a slight decline in national coronavirus concentrations over the last month.

    All four regions of the country are also experiencing COVID-19 plateaus, according to Biobot’s data. The West Coast and Midwest have slightly higher coronavirus levels than the Northeast and South, but there aren’t huge differences between the regions.

    The West and Midwest are also hotspots for XBB.1.16 and XBB.1.9, the two Omicron subvariants that have started competing with XBB.1.5 over the last few weeks. This competition is happening slowly; XBB.1.5 declined from an estimated 84% of new cases during the last week of March to 69% of new cases this past week, according to the CDC’s estimates.

    At this point, it’s hard to tell how much of an impact the latest variants will have on overall COVID-19 spread. And these connections likely will only get more difficult to parse out, as PCR testing continues to decline and reporting gets less reliable. The CDC itself is currently evaluating how to adjust its data-sharing practices when the federal public health emergency ends on May 11.

  • National numbers, April 23

    National numbers, April 23

    Coronavirus concentrations are trending down in Boston’s wastewater, a promising signal.

    In the past week (April 13 through 19), the U.S. officially reported about 94,000 new COVID-19 cases, according to the CDC. This amounts to:

    • An average of 13,000 new cases each day
    • 7% fewer new cases than last week (April 6-12)

    In the past week, the U.S. also reported about 12,000 new COVID-19 patients admitted to hospitals. This amounts to:

    • An average of 1,700 new admissions each day
    • 3.7 total admissions for every 100,000 Americans
    • 8% fewer new admissions than last week

    Additionally, the U.S. reported:

    • 1,200 new COVID-19 deaths (170 per day)
    • 74% of new cases are caused by Omicron XBB.1.5; 11% by XBB.1.9; 10% by XBB.1.16 (as of April 22)
    • An average of 35,000 vaccinations per day

    Across the U.S., COVID-19 spread continues at a moderately high plateau as newer versions of Omicron compete with XBB.1.5. Officially-reported cases and new hospitalizations declined by 7% and 8% respectively, compared to the prior week.

    Wastewater surveillance data from Biobot and from the CDC similarly show that COVID-19 spread is at a plateau. Nationally, coronavirus concentrations in sewage are higher than they were at this point in 2021 (when the initial vaccine rollout was in full swing), but lower than at this point in 2022 (when BA.2 had started spreading widely).

    Of course, it’s important to flag that official case counts are becoming even more unreliable these days, as PCR testing becomes increasingly difficult to access and state health departments no longer prioritize timely reporting to the CDC. According to CDC, five states didn’t report COVID-19 cases and deaths last week: Arkansas, Florida, Iowa, Mississippi, and Pennsylvania. (Iowa has permanently stopped reporting.)

    These case reporting issues are likely to continue—and perhaps accelerate—when the federal public health emergency ends next month. I’m thinking about how to adjust these National Numbers reports when that happens; that will likely involve foregrounding wastewater data and hospitalizations rather than cases.

    Regionally, Biobot’s surveillance shows a slight uptick in coronavirus spread on the West Coast and declines in the other major regions. Some counties in California have reported recent increases in wastewater, according to Biobot and WastewaterSCAN, but it’s currently tough to tell if this is a sustained surge or isolated outbreaks.

    The West Coast and Midwest continue to be hotspots for newer versions of Omicron, according to the CDC’s estimates, with XBB.1.9 still most prevalent by far in the region including Iowa, Kansas, Missouri, and Nebraska. Nationwide, the CDC estimates that XBB.1.9 caused about 11% of new cases in the last week and that XBB.1.16 caused 10% of new cases.

    XBB.1.16 (also called “Arcturus”) was recently classified as a variant of interest by the World Health Organization because it can spread significantly faster than other Omicron lineages. The variant is likely to “spread globally and contribute to an increase in case incidence,” according to the WHO.

    While I’m wary of the new variants, I have been heartened to see coronavirus levels in wastewater remain mostly at plateaus—or even decline—in many places across the U.S. In Boston, for example, coronavirus levels have been on a downward trend since early 2023. I hope to see this trend continue. 

  • National numbers, April 16

    National numbers, April 16

    New subvariants XBB.1.16, XBB.1.9.1, and XBB.1.9.2 are on the rise, according to the CDC’s estimates.

    In the past week (April 6 through 12), the U.S. officially reported about 100,000 new COVID-19 cases, according to the CDC. This amounts to:

    • An average of 15,000 new cases each day
    • 17% fewer new cases than last week (March 30-April 5)

    In the past week, the U.S. also reported about 13,000 new COVID-19 patients admitted to hospitals. This amounts to:

    • An average of 1,900 new admissions each day
    • 3.9 total admissions for every 100,000 Americans
    • 14% fewer new admissions than last week

    Additionally, the U.S. reported:

    • 1,300 new COVID-19 deaths (190 per day)
    • 78% of new cases are caused by Omicron XBB.1.5; 9% by XBB.1.9; 7% by XBB.1.16 (as of April 15)
    • An average of 35,000 vaccinations per day (CDC link)

    COVID-19 spread appears to be at a continued plateau nationally, with slight declines in cases, hospitalizations, and viral concentrations in wastewater. New variants are on the horizon, though, at a time when data are becoming increasingly less reliable. 

    The CDC reported about 100,000 new cases this week, the lowest this number has been since early summer 2021. Unlike that period, however, PCR tests are much less available and reporting infrastructures are being dismantled.

    Wastewater surveillance data from Biobot show that transmission is actually several times higher now than it was at that previous low point. We’re in an undercounted plateau, rather than a real lull. Even so, less COVID-19 is spreading now than we’ve seen throughout the last few months.

    To get a more accurate picture of potential COVID-19 case counts in your area, I recommend going to the Iowa COVID-19 Tracker, an independent dashboard run by Sara Anne Willette. Willette has mapped out “likely cases per 100,000 people” by county, by multiplying the CDC’s data by 20 to account for underreporting.

    Wastewater data suggest that most parts of the U.S. are seeing steady (though slight) declines in transmission, with the exception of the West coast. Some counties in California have reported increased coronavirus levels in wastewater in the last week, according to Biobot and WastewaterSCAN, including parts of the Bay Area.

    One culprit for the increases could be newer Omicron subvariants, particularly XBB.1.9 and XBB.1.16. The CDC added XBB.1.16—which has drawn international concern, due to its connection with a recent surge in India—to its variant proportion estimates, along with XBB.1.9.2, a relative of XBB.1.9.1. (Yes, we’re getting into alphabet soup territory again here.)

    Nationally, the CDC estimates that XBB.1.16 caused about 7% of new cases in the last week, while the XBB.1.9s together caused 9%. At the regional level, XBB.1.16 is more prevalent in the West and Southwest (at over 20% of new cases in the region including Texas and other Gulf coast states), while the XBB.1.9s are more prevalent in the Midwest.

    The CDC published its second-to-last data update yesterday (which is still called the “Weekly Review,” even though it is far from weekly at this point). According to this update, most of the CDC’s public COVID-19 data “won’t be affected by the end of the public health emergency,” though the agency says it’ll provide more details in its final update on May 12.

    I personally expect that, while the national data systems might remain in place, more state and local health agencies will stop reporting, as we saw from Iowa recently. This will, of course, make the numbers less and less reliable.

  • National numbers, April 9

    National numbers, April 9

    COVID-19 spread is at a plateau in all four major regions of the U.S., according to wastewater data from Biobot.

    In the past week (March 30 through April 5), the U.S. officially reported about 120,000 new COVID-19 cases, according to the CDC. This amounts to:

    • An average of 17,000 new cases each day
    • 37 total new cases for every 100,000 Americans
    • 12% fewer new cases than last week (March 23-29)

    In the past week, the U.S. also reported about 15,000 new COVID-19 patients admitted to hospitals. This amounts to:

    • An average of 2,100 new admissions each day
    • 4.5 total admissions for every 100,000 Americans
    • 12% fewer new admissions than last week

    Additionally, the U.S. reported:

    • 1,800 new COVID-19 deaths (250 per day)
    • 88% of new cases are caused by Omicron XBB.1.5; 5% by XBB.1.9.1; 2% by XBB.1.5.1; 0.4% by CH.1.1 (as of April 8)
    • An average of 40,000 vaccinations per day

    COVID-19 spread in the U.S. remains at a high plateau, according to reported cases, hospitalizations, and wastewater surveillance. Experts are watching new variants that mutated from XBB as potential drivers of more transmission this spring.

    While the case numbers may seem low, remember that cases are now severely undercounted—potentially by up to 20 times. So, when the CDC reported about 37 new cases per 100,000 people last week, the true number could be closer to 700 new cases per 100,000. It’s becoming harder and harder to get a PCR test, as sites shut down and the federal health emergency’s end approaches, which will further drive undercounting.

    Wastewater data, on the other hand, continue to show that coronavirus levels in the U.S. are significantly higher than they were at this time in 2022 and 2021. Last week, I wrote that Biobot’s dashboard showed a slight increase in COVID-19 spread across the country; after this week’s data updates, that appears to have been a blip, with the company’s national surveillance again showing a plateau.

    Biobot’s regional data also indicates that COVID-19 spread has remained relatively consistent in the last few weeks. The Northeast and Midwest have slightly higher coronavirus levels than the South and West, but there aren’t significant differences between these regions.

    As I wrote last week, new subvariant XBB.1.9.1 remains more prevalent in the Midwest, particularly the region including Iowa, Kansas, Missouri, and Nebraska (where it caused about 18% of new cases in the last week, per CDC estimates). Some wastewater testing sites in these states have reported increases recently, but there isn’t a consistent increase across the board.

    Nationally, the CDC estimates that XBB.1.9.1 caused about 5% of new cases nationwide in the week ending April 8, compared to 88% caused by XBB.1.5. XBB.1.9.1 has been growing relatively slowly, so it may be a few more weeks before we see it either outcompete XBB.1.5 or die out at low levels. Experts are also watching XBB.1.16, which drove a surge in India recently but has not shown up in large numbers in the U.S. yet.

    Will the U.S. see a new surge this spring? It seems possible, thanks to Omicron’s continued evolution and our lack of collective safety measures. But continued declines in data reporting will make it harder to see this surge than it’s ever been.

    In this environment, wastewater surveillance is growing more and more valuable. It’s also probably a good idea to keep taking some basic precautions (like masking in public indoor spaces, or regularly testing) no matter how low the reported cases get in your community.