In the past week (December 13 through 19), the U.S. reported about 1.5 million new cases, according to the COVID Tracking Project. This amounts to:
An average of 211,000 new cases each day
451 total new cases for every 100,000 Americans
1 in 222 Americans getting diagnosed with COVID-19 in the past week
39% of the total cases reported across the globe this week, according to the World Health Organization
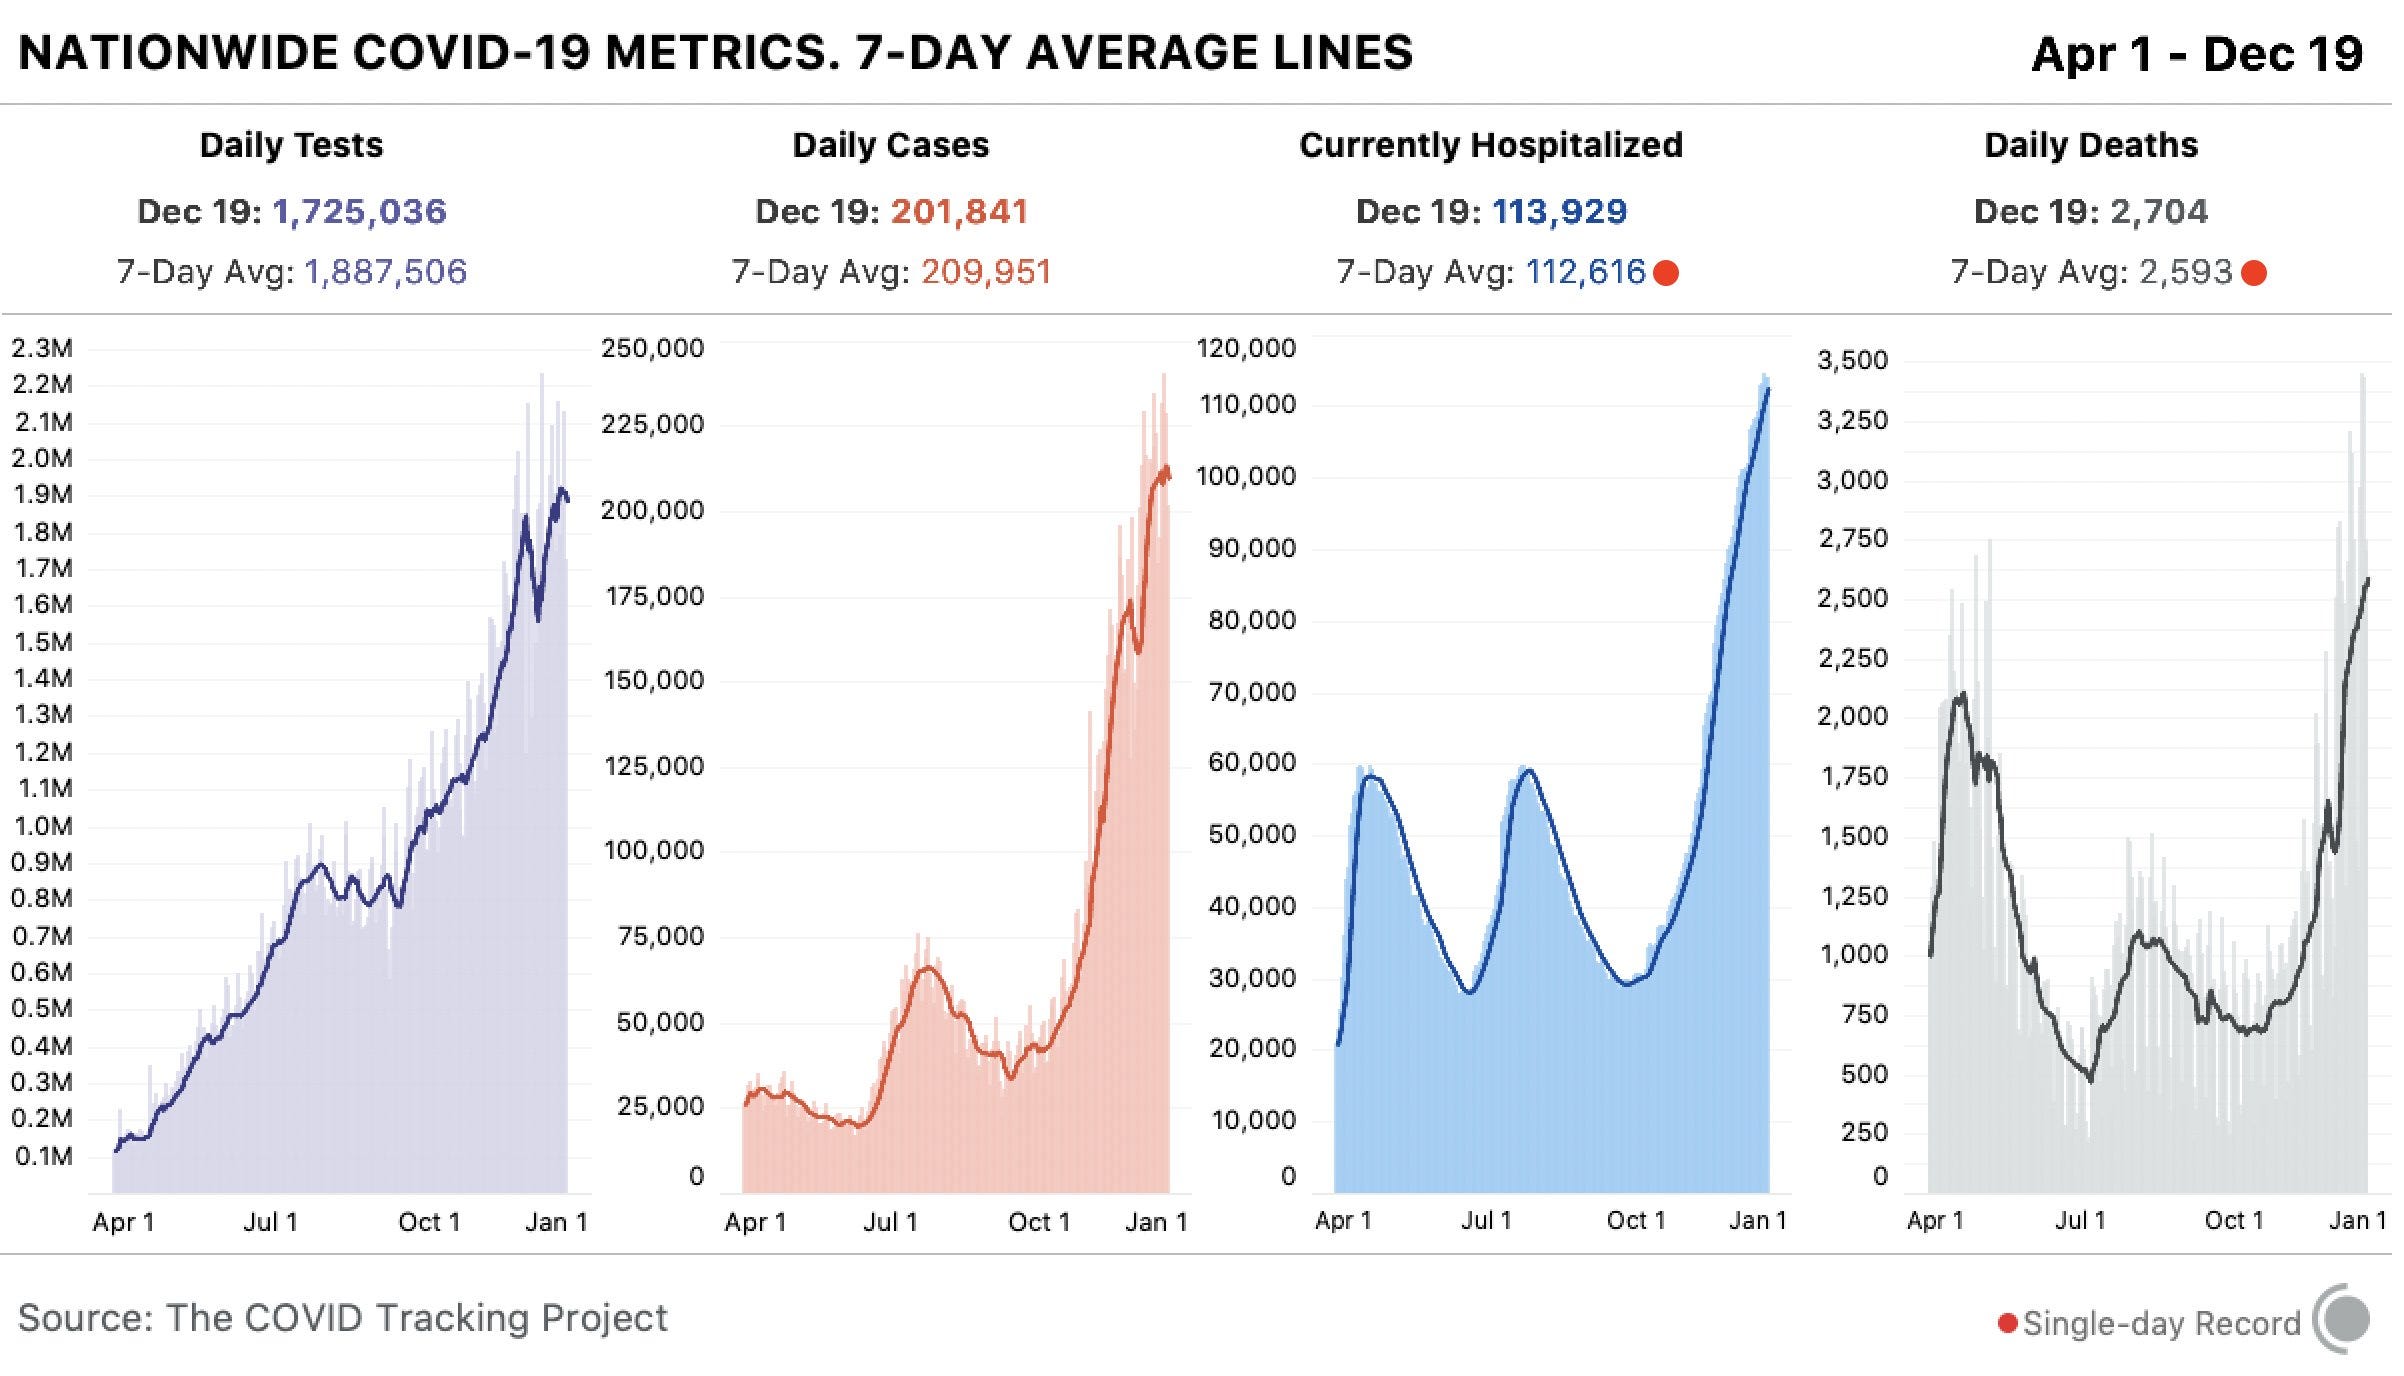
Nationwide COVID-19 metrics published in the COVID Tracking Project’s daily update on December 19. Seven-day averages for hospitalizations and deaths are at all-time highs.
Cases appear to be slowing nationwide, the Project’s weekly update reports—but the trend should be interpreted with caution, as many cases reported last week were delayed by the Thanksgiving holiday. And national counts obscure regional patterns: while the Midwest may have finally passed its peak of new cases, the Northeast, South, and West are all facing still-rising outbreaks. California alone reported 287,000 cases this week, and the state’s hospitals are already full.
Last week, America also saw:
114,000 people now hospitalized with COVID-19 (35 for every 100,000 people)
18,300 new COVID-19 deaths (5.6 for every 100,000 people)
The nation continues to pass its own record for deaths reported in a single week. COVID-19 is, unambiguously, the leading cause of death in the U.S. right now.
From @IHME_UW, these are the leading causes of death in the US in the last 7 days.
COVID-19 is the clear #1.
This is why avoiding travel and remaining vigilant is absolutely vital right now.
In the past week (December 6 through 12), the U.S. reported about 1.6 million new cases, according to the COVID Tracking Project. This amounts to:
An average of 228,000 new cases each day (23% increase from the previous week)
487 total new cases for every 100,000 Americans
1 in 205 Americans getting diagnosed with COVID-19 in the past week
44% of the total cases reported across the globe this week, according to the World Health Organization
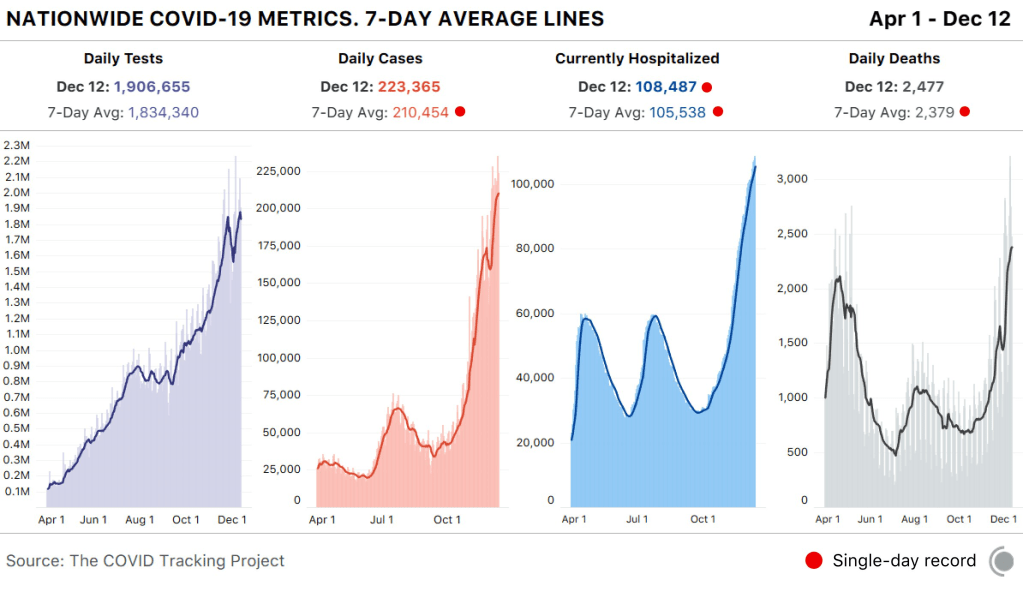
Nationwide COVID-19 metrics published in the COVID Tracking Project’s daily update on December 12. Seven-day averages for cases, deaths, and hospitalizations are all at all-time highs.
In the month of November, one in 74 Americans was diagnosed with COVID-19. This terrible rise in cases has already put enormous strain on the nation’s healthcare system, and the outbreak is not slowing down. One in 131 Americans was diagnosed with COVID-19 in the first 12 days of December alone.
108,500 people now hospitalized with COVID-19 (33.1 for every 100,000 people)
17,300 new COVID-19 deaths (5.3 for every 100,000 people)
In last Sunday’s issue, I reported that 15,000 deaths in one week marked a national record; this week, we saw 2,000 more. How do you think about numbers this big? You could compare the pandemic to 9/11, Pearl Harbor, and other American tragedies, but even this practice minimizes the fact that a day of 3,000 deaths is only one day in a year of mass suffering.
In the past week (November 29 through December 5), the U.S. reported about 1.3 million new cases, according to the COVID Tracking Project. This amounts to:
An average of 186,000 new cases each day (16% increase from the previous week)
297 total new cases for every 100,000 Americans
1 in 252 Americans getting diagnosed with COVID-19 in the past week
9% of the total cases the U.S. reported in the full course of the pandemic
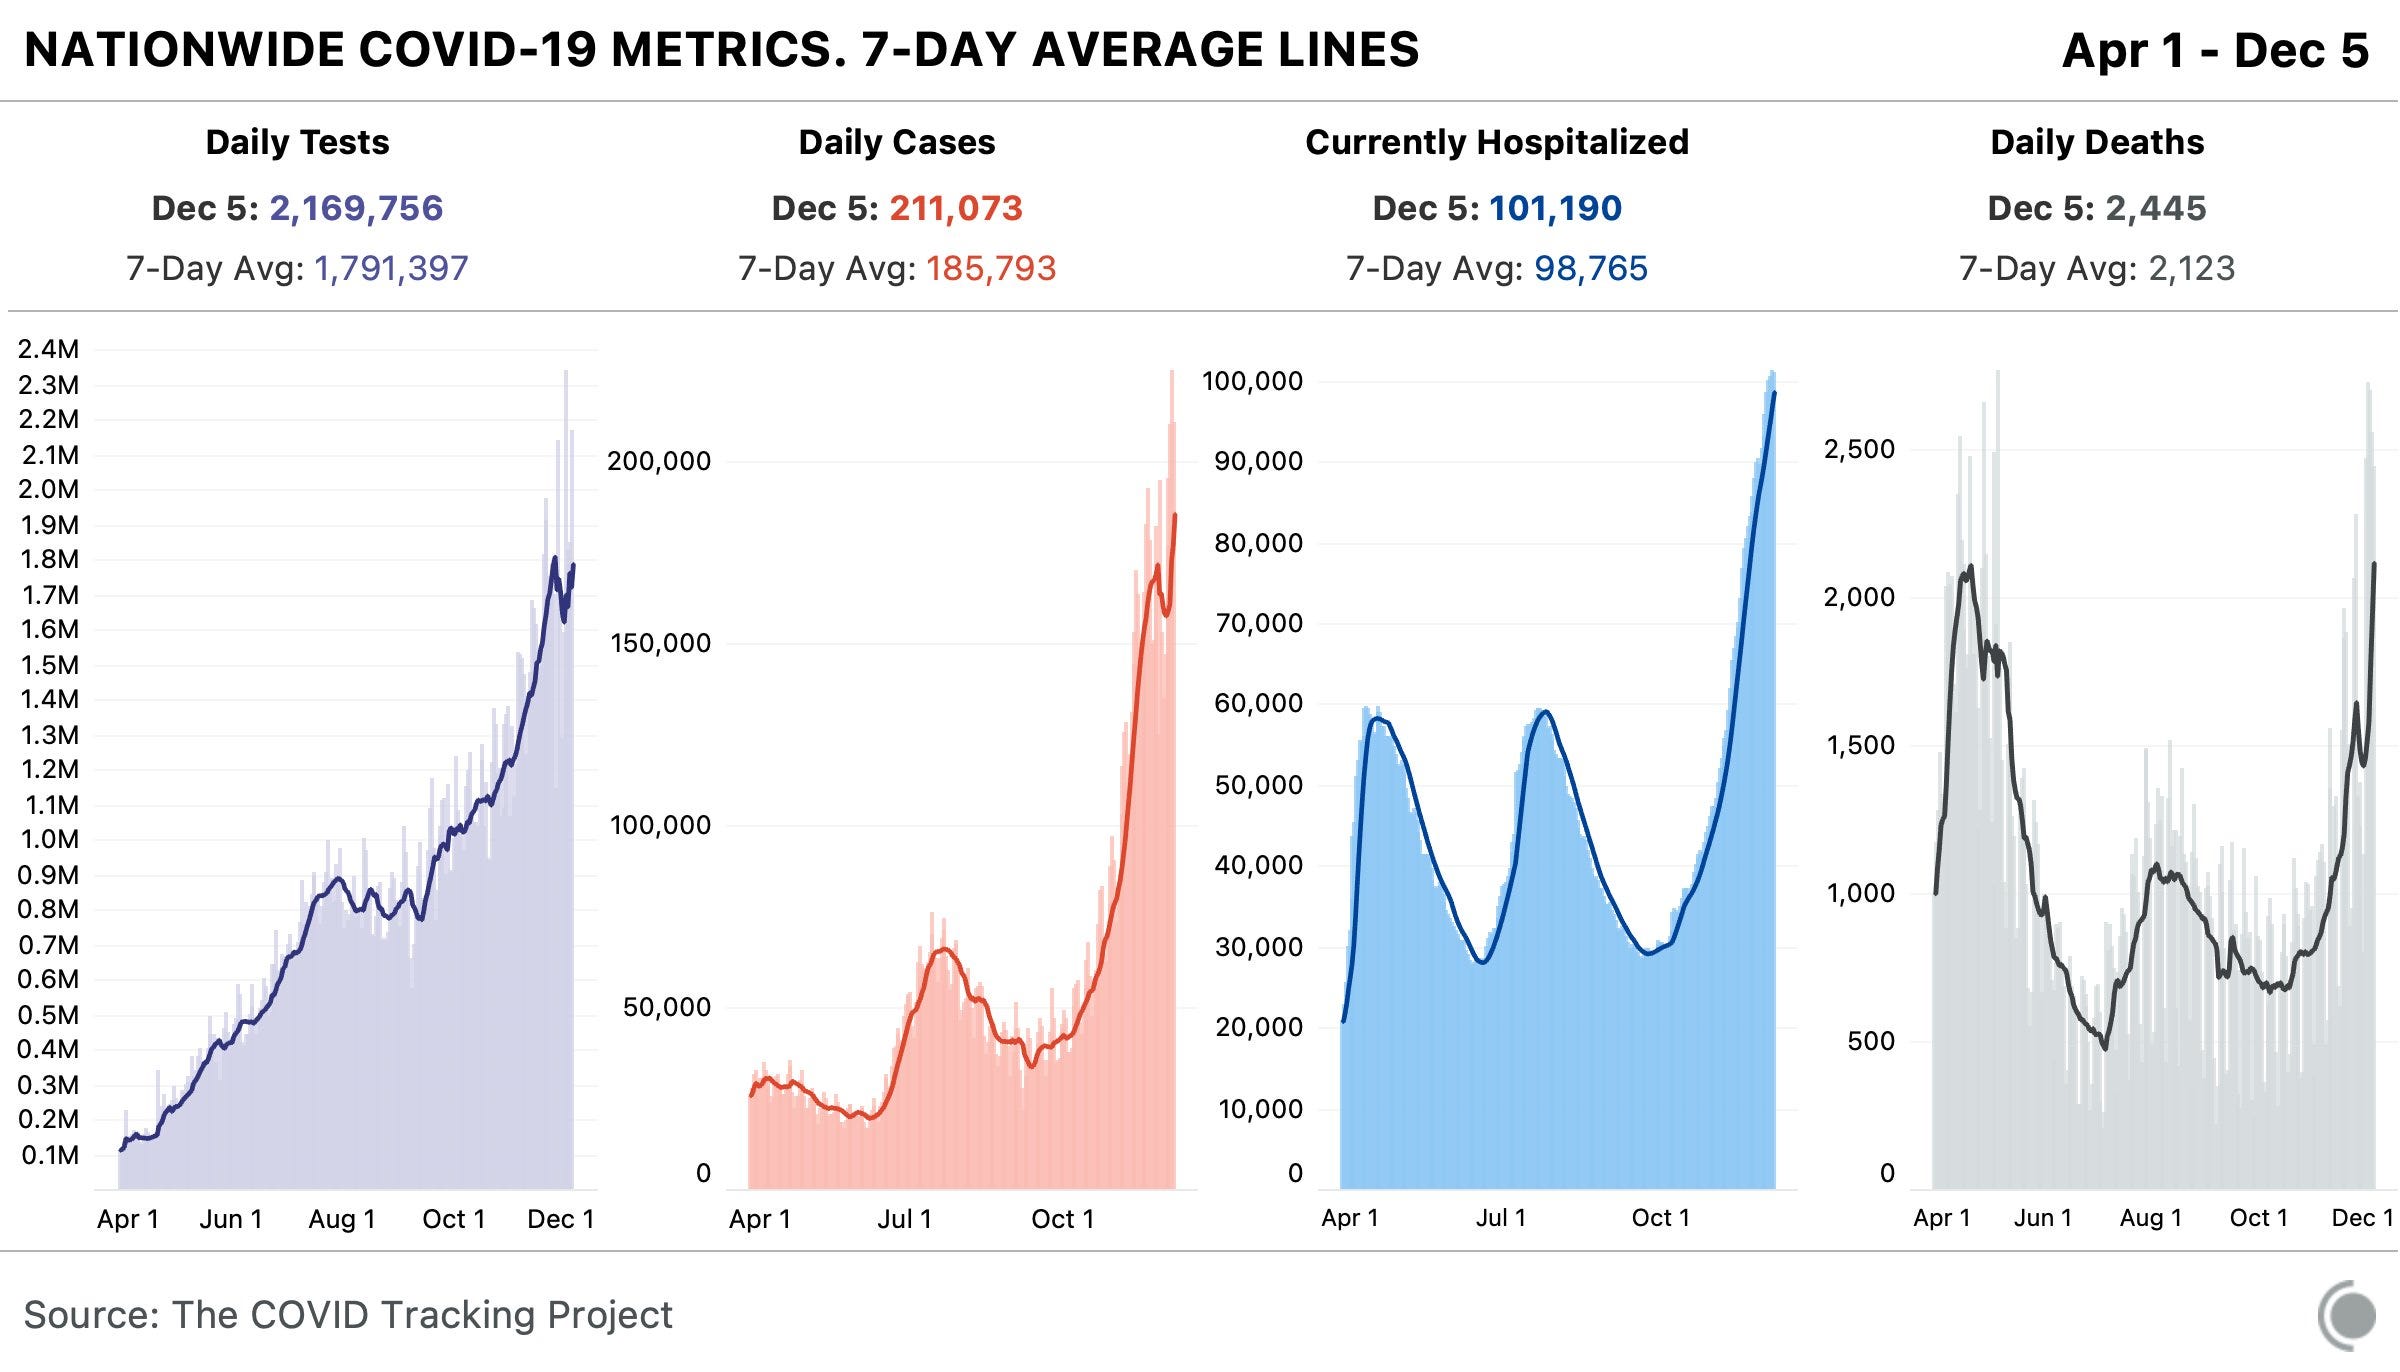
Nationwide COVID-19 metrics published in the COVID Tracking Project’s daily update on December 5. The seven-day average for reported COVID-19 deaths is at an all-time high.
More Americans are getting sick with COVID-19 now than ever before in the pandemic. And this outbreak isn’t isolated. Eleven states broke case records on Thursday, for example, including states in all major regions of the country.
Last week, I warned you about data fluctuations which I expected to see thanks to the Thanksgiving holiday. America first reported fewer cases, deaths, and tests, as public health workers took a day or two off and data pipelines were interrupted. Then, the cases which were not reported over the holiday were added to the count belatedly, culminating in a record of 225,000 new cases on Friday.
If you visit the COVID Tracking Project’s website, you’ll still see a warning notice about these Thanksgiving data disruptions. However, one key number tells us that the pandemic is, in fact, still getting more dire: more patients are getting admitted to the hospital than ever before.
Last week, America saw:
Over 100,000 people now hospitalized with COVID-19 (it’s 101,200 as of yesterday, twice the number of patients at the beginning of November)
15,000 new COVID-19 deaths (5 for every 100,000 people)
To understand the impact of that hospitalization record, read Alexis Madrigal and Rob Meyer in The Atlantic:
Many states have reported that their hospitals are running out of room and restricting which patients can be admitted. In South Dakota, a network of 37 hospitals reported sending more than 150 people home with oxygen tanks to keep beds open for even sicker patients. A hospital in Amarillo, Texas, reported that COVID-19 patients are waiting in the emergency room for beds to become available. Some patients in Laredo, Texas, were sent to hospitals in San Antonio—until that city stopped accepting transfers. Elsewhere in Texas, patients were sent to Oklahoma, but hospitals there have also tightened their admission criteria.
Or, for one doctor’s perspective, read this thread from Dr. Esther Choo:
There is a magical number we rarely talk about, and that's how many patients every doctor can see and still take good care of all them.
Deaths are also rising. The deaths of 15,000 Americans were reported last week—the highest number of any week in the pandemic thus far. In fact, COVID-19 was the leading cause of death in America last week, according to the Institute for Health Metrics and Evaluation.
In the past week (November 22 through 28), the U.S. reported about 1.1 million new cases, according to the COVID Tracking Project. This amounts to:
An average of 160,000 new cases each day (4% decrease from the previous week)
343 total new cases for every 100,000 Americans
1 in 292 Americans getting diagnosed with COVID-19 in the past week
9% of the total cases the U.S. reported in the full course of the pandemic
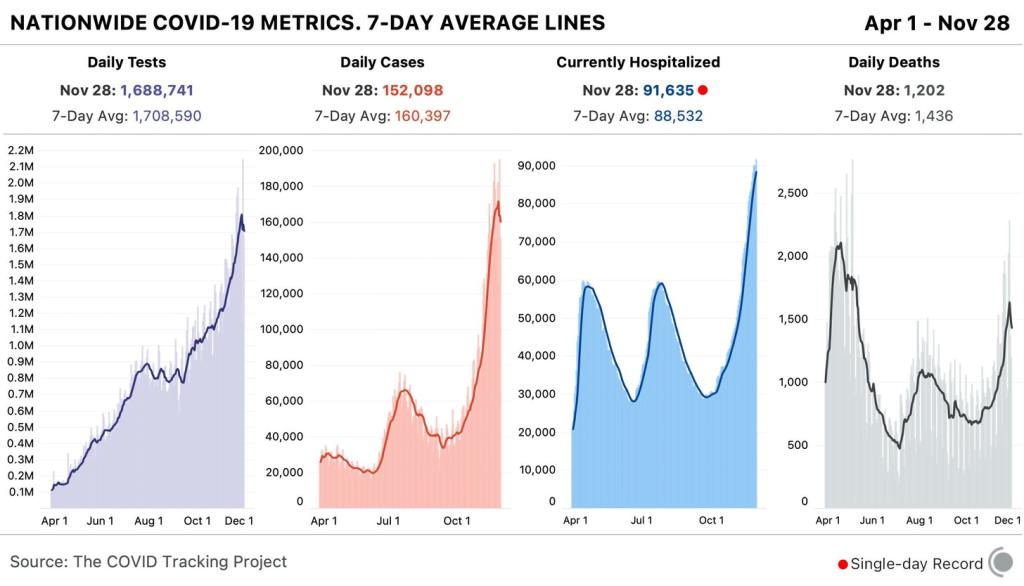
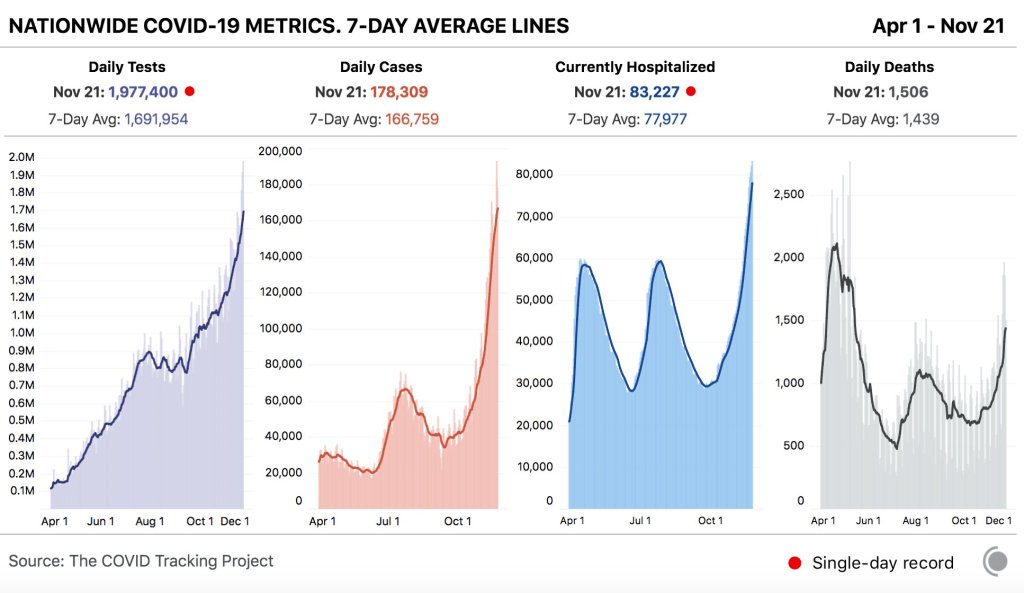
Nationwide COVID-19 metrics published in the COVID Tracking Project’s daily update on November 21. While reported cases have fluctuated due to the Thanksgiving holiday (see below), hospitalizations continue to rise.
1 in every 82 Americans has been diagnosed with COVID-19 since the beginning of November. Sit with that number for a minute. Picture 82 people. Imagine one of them getting sick, going to the hospital, having debilitating symptoms for months afterward. That is the weight of this pandemic on America right now.
The COVID Exit Strategy tracker now categorizes the virus spread in every state except for Maine, Vermont, and Hawaii as “uncontrolled,” and even those three states are “trending poorly.” I know we just finished an exhaustive public health news cycle about Thanksgiving travel, but… I would recommend that you start making your Christmas plans now.
America also saw:
10,000 new COVID-19 deaths last week (3.1 per 100,000 people)
91,600 people currently hospitalized with the disease, as of yesterday (93% increase from the start of November)
This week, though, I need to caveat the data pretty heavily. The public health officials who collect and report COVID-19 numbers celebrate holidays just like the rest of us; but when dashboards go dark for a day or two, those data gaps can lead to some weird trends.
First, by Thanksgiving Day and perhaps as early as Wednesday, all three metrics [tests, cases, and deaths] will flatten out or drop, probably for several days. This decrease will make it look like things are getting better at the national level. Then, in the week following the holiday, our test, case, and death numbers will spike, which will look like a confirmation that Thanksgiving is causing outbreaks to worsen. But neither of these expected movements in the data will necessarily mean anything about the state of the pandemic itself. Holidays, like weekends, cause testing and reporting to go down and then, a few days later, to “catch up.” So the data we see early next week will reflect not only actual increases in cases, test, and deaths, but also the potentially very large backlog from the holiday.
And indeed, new daily cases dropped from 183,000 on Wednesday to 125,000 on Thursday, rose to 194,000 on Friday, then dropped back to 152,000 on Saturday. Even in the states which still reported new cases, deaths, and tests on Thanksgiving, many testing sites and labs were closed, further contributing to reporting backlogs and discrepancies.
If you’re watching (or reporting) the numbers in your community, the Project recommends using seven-day averages—for example, rather than just looking at today’s new cases for evidence that the pandemic is slowing, calculate the average of today’s new cases and new cases from the six previous days. Current hospitalization figures and the hospital capacity data reported by the Department of Health and Human Services (HHS) may also be more reliable, as hospitals don’t take days off.
Finally, I’d like to echo the COVID Tracking Project in thanking the many thousands of people behind these data. There are healthcare workers, lab technicians, public health leaders, and data pipeline IT workers behind every single number that you see in this newsletter. I am grateful for all of their efforts.
We couldn’t bring you a single data point without the thousands of people in labs, state and local health departments, test sites, and hospitals who record every single number we compile. We hope that at least some of these folks are getting some much-needed rest today.
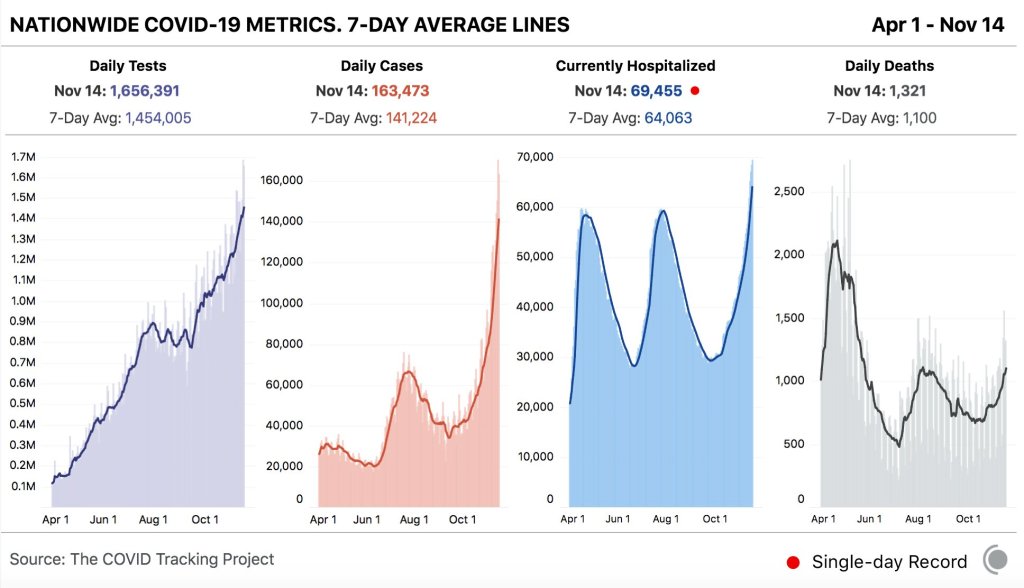
In the past week (November 15 through 21), the U.S. reported about 1.2 million new cases, according to the COVID Tracking Project. This amounts to:
An average of 167,000 new cases each day (19% increase from the previous week)
358 total new cases for every 100,000 Americans
1 in 279 Americans getting diagnosed with COVID-19 in the past week
10% of the total cases the U.S. reported in the full course of the pandemic
Nationwide COVID-19 metrics published in the COVID Tracking Project’s daily update on November 21. The new cases seven-day average has doubled since the beginning of November.
1 in every 114 Americans has been diagnosed with COVID-19 since the beginning of November, and cases aren’t slowing anywhere in the nation. The COVID Exit Strategy tracker categorizes the spread in every state except for Maine and Hawaii as “uncontrolled”; even Vermont, praised by public health experts for its mitigation efforts, is now seeing record numbers.
America also saw:
10,100 new COVID-19 deaths last week (3.1 per 100,000 people)
83,200 people currently hospitalized with the disease, as of yesterday (20% increase from the previous week; 76% increase from the start of November)
Here’s how it works. You take the number of COVID-19 cases reported in the past week and divide the current U.S. population by that case number. There are variations; the metric may also be calculated for different time spans or smaller geographies, such as a specific U.S. state. But the standard calculation focuses on the nation, over the past week.
For example: in the past week, one in 331 Americans has been diagnosed with COVID-19. If we extend that out to the past two weeks: one in 192 Americans has been diagnosed with COVID-19 since November 1.
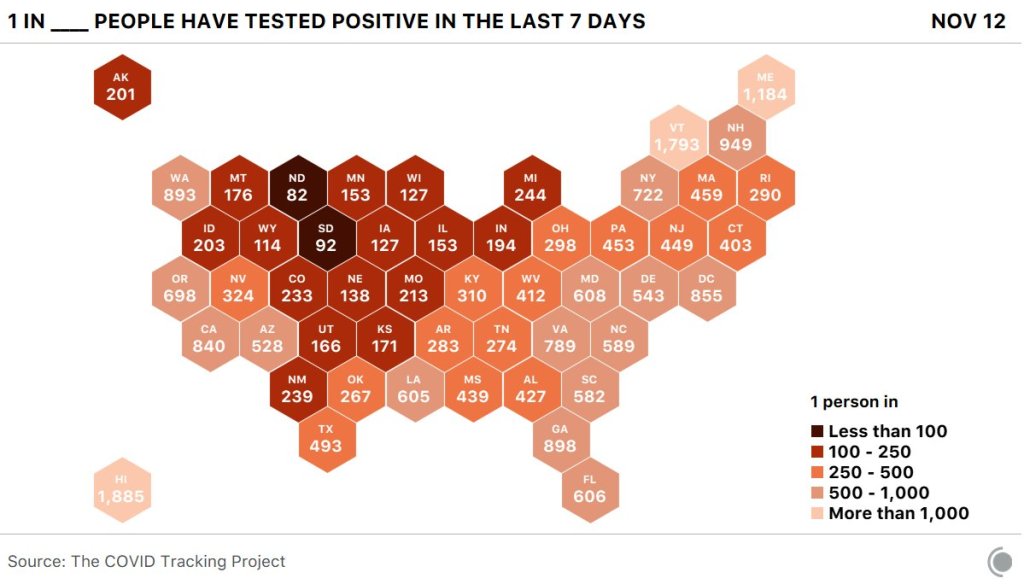
Here’s what it looks like by state (reflecting data from November 5 to 12):
“1 in X” chart published in the COVID Tracking Project’s daily update on November 12.
The biggest challenge that data journalists like me face right now is putting massive COVID-19 numbers into a context that readers may easily understand. I’ve used a variety of analogies, comparisons, and visualizations, but I like this number because it feels visceral. I’ve had lectures smaller than 331 people. I’ve been to protests ten times bigger. It’s a number of people that I can picture, a number of people that would fit in my neighborhood park.
Among COVID Tracking Project volunteers, this metric is known as the Camberg Number—after Nicki Camberg, City Data Manager at the Project, who first shared it in Slack earlier in November. I asked her where she got the idea for this calculation and how she’s thinking about pandemic data during this terrifying surge.
Here’s what she said:
When thinking about COVID-19, the metrics we’ve been using have started to blur together and stop having the same impact after months of staring at them. What is the difference between 100,000 and 150,000 new cases? Well, obviously, 50,000 more cases, but I can’t conceptualize that, nor can most people. Numbers that high feel almost abstract and easy to ignore. I could feel myself starting to normalize these increasing case and hospitalization rates, and I had to figure out a way to stop that from happening. If I, someone who spends all day every day collecting, discussing, and working with COVID-19 data, was starting to get desensitized to the pandemic—what must it be like for the general public?
I knew I had to find a way to make it more personally relatable, but also find a way to use the data I look at every day to better inform my own decisions. When I go to the grocery store, what is the probability that someone in the store with me tested positive? How many people in my grade currently have COVID? If my grandmother leaves her house, how many people does she have to interact with before it’s likely she was in the presence with someone who could infect her?
The first time I calculated this number was November 5th. The US had just hit 116,000 new cases in a day, the second day in a row of record breaking cases and the start of a week of near-constant exponential increases. I calculated that roughly 1 in 3,000 Americans were diagnosed with COVID-19 that day, and I was shocked. 1 in 3,000 people? That number felt like a punch in the gut, and made me see the devastating effect of this pandemic more than any other statistic I’d heard for months. It gets even worse when this is applied to state or local levels (which one can do using the newly released CTP City Dataset), and it is genuinely devastating when done by race.
From the feedback I’ve gotten, it seems like a lot of people are feeling the same way I am: jaded and exhausted after half a year of a never ending pandemic. Sometimes we need a shock to the system to realize that this is not normal, is not something that can be ignored. Until there is a vaccine, cases will only continue to spike with the holiday season unless we all choose to practice radical empathy and collectively do all we can to curb the spread of the virus.
In the past week (November 8 through 14), the U.S. reported about 990,000 cases, according to the COVID Tracking Project. This amounts to:
An average of 141,000 new cases each day (38% increase from the previous week)
302 total new cases per 100,000 people
1 in 331 Americans getting diagnosed with COVID-19
3.4 times the total cases Canada has reported over the entire course of the pandemic
Nationwide COVID-19 metrics published in the COVID Tracking Project’s daily update on November 14. Hospitalizations are up 24% from the previous Saturday.
Cases continue to rise across the country; 38 states reported over 1,000 cases yesterday. The COVID Exit Strategy tracker now categorizes every state except for three as “uncontrolled spread,” and even Maine and Vermont are now “trending poorly.”
America also saw:
7,700 new COVID-19 deaths last week (2.4 per 100,000 people)
69,000 people currently hospitalized with the disease, as of yesterday (24% increase from the previous week)
So many people have been infected and become seriously ill in recent weeks that hospital systems are overwhelmed. Two new articles published this past Friday, by ProPublica’s Caroline Chen and The Atlantic’s Ed Yong, center the experiences of America’s stressed, scared, and exhausted healthcare workers. Both pieces give faces and voices to these immense numbers. If you read nothing else this weekend—even if you don’t read the rest of this newsletter—please read those two stories.
I offered my own take on the current outbreak in a Twitter thread last Wednesday. This is the message I want to highlight:
take a moment and think about how scared you were in March. think about how you spoke to your family, donated to mutual aid funds, watched the numbers in your community. can you do that again? can you be that careful, that caring? (8/10)
We already know what we need to do to get this nationwide outbreak under control. We did it in March. Stay home. Limit your activity and travel to the essentials. Shrink your circle of contacts. Take care of your neighbors. And, whenever you’re outside the house—wear a mask.
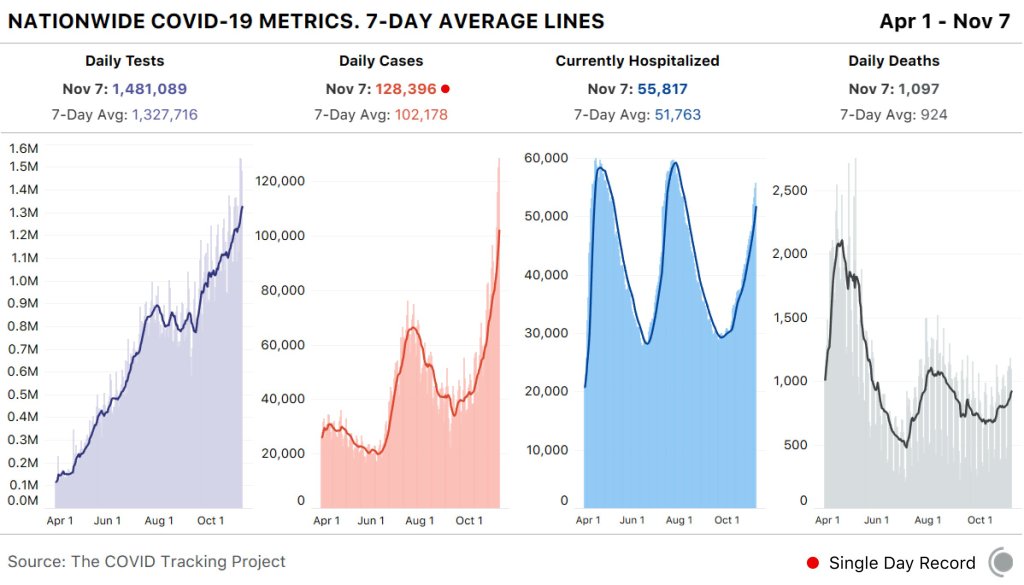
In the past week (November 1 through 7), the U.S. reported about 715,000new COVID-19 cases, according to the COVID Tracking Project. This amounts to:
An average of 102,000 new cases each day
218 total new cases per 100,000 people
1 in 460 Americans getting diagnosed with COVID-19
2.7 times the total cases Canada has reported over the entire course of the pandemic
While the Midwest is bearing the brunt of this recent surge, cases are rising across the country. 23 states broke their COVID-19 records in the past week, and the COVID Exit Strategy tracker currently categorizes almost every state as “trending poorly” or “uncontrolled spread.” Vermont and Hawaii are the only two exceptions.
America also saw:
6,900 new COVID-19 deaths last week (2.1 per 100,000 people)
55,800 people currently hospitalized with the disease (as of November 7)
There is no doubt that we’re seeing a third national surge, and we should not expect it to let up anytime soon. I recommend checking the COVID-19 Risk Levels Dashboard (by the Harvard Global Health Institute, Brown School of Public Health, et al.) for more detail on the current risk in your community.
Nationwide COVID-19 metrics published in the COVID Tracking Project’s daily update on November 7. America broke its single-day new case record for the fourth day in a row.
Earlier this weekend, I attended a protest in New York City called, “March for the Dead.” The event sought to memorialize New Yorkers who died of COVID-19 and demand that the federal government better address the realities of this pandemic and protect vulnerable Americans.
(Disclaimer: one of the event’s organizers, Justin Hendrix, volunteers with me at the COVID Tracking Project.)
While this newsletter is a journalism project, it felt fitting this week for me to share a few lines I wrote on the subway home after listening to the name reading. “March for the Dead” reminded me of the people behind the numbers I spend so much time compiling and analyzing—a reminder that I think anyone covering this pandemic sorely needs.
how long would it take to read all the names?
1,700 names in the city’s memorial. it took an hour, maybe, give or take. i wasn’t really keeping track. i was listening to the names, the way they rang out in the open square. the way they fell heavy on the pavement, like drops of rain at the start of a thunderstorm. but this is not the start of a thunderstorm, of course. it’s a hurricane, and another hurricane, and a wildfire, and a tornado, and all of it preventable. the father of one of the readers, kept in a nursing home. grocery store clerks, cafe workers, nurses, and parents, siblings. so many pairs of names that rhyme. so many bodies in tiny apartments, bodies in shelters, bodies hooked up to breathing machines, gasping for every molecule of oxygen.
this is not the start of a thunderstorm. it’s a hurricane, and we aren’t stopping it. an hour, perhaps, for 1,700 names. how long would it take, to read all 25,000 names of those who died in new york city? all 175,000 who died in america? all the thousands more who have not been counted yet? how long would it take to talk to the families and friends of the people who bore those names, to find out their favorite colors, what they ate for breakfast, what they were looking forward to this year? how long would it take to attend 175,000 funerals?
this is a metric i can’t count. my back would crack under the weight. all i can do is sit in the square, sit quietly, and listen. and then i return to work, i keep counting the numbers i can count. i let them echo.
My last big story for this week is to heavily recommend this ProPublica feature by Caroline Chen and Ash Ngu on how to navigate COVID-19 data. Chen is a veteran health journalist who has been reporting on COVID-19 since January (and who reported on previous disease outbreaks before that). Her story explains how to understand test positivity rates, data lags, and the inherent uncertainty that comes with any attempt to quantify this pandemic.
You should really read the full story, but I’ll summarize the main points for you here in case you’re just going to bookmark it for later:
Test positivity rates indicate the share of COVID-19 tests in a region which are coming back positive. If the rate is high (above 10%), this may mean only sick people have access to tests, and testing is not occurring widely enough to fully capture the scale of an outbreak. If the rate is low (below 5%), this may mean anyone who wants a test can get one, and epidemiologists will be able to quickly identify and trace new outbreaks.
Daily case counts often are not a good indicator of how a region’s outbreak is progressing, because counts of new cases may be undercounted on weekends or during testing delays. For a more accurate picture, look at the seven-day rolling average—a figure that averages a particular day’s number of new cases with the numbers of the six previous days. Also, rises in deaths tend to lag rises in cases by several weeks, reflecting the progression of the disease in COVID-19 patients.
It is difficult to state definitively whether a certain event—such as a restaurant opening or a protest—impacted COVID-19 spread in an area. No one event occurs in a vacuum, and any resulting data around that event were likely impacted by testing lags, testing availability, and other factors.
Don’t just look at one statistic; look at the whole picture. Ask whether case counts are rising in your area, yes, but also ask: are enough people getting tested? Are the hospitals filling up? How does your state or county compare to others nearby?
Find and follow sources you trust to help you interpret data as they are released. A good source will advise you in the areas where they have expertise and let you know when a question is out of their wheelhouse.