Tag: National numbers

  • National numbers, July 11

    National numbers, July 11

    COVID-19 hospitalizations by age, via the CDC. Adults between ages 18 and 49 now make up over 40% of these patients.

    In the past week (July 3 through 9), the U.S. reported about 104,000 new cases, according to the CDC. This amounts to:

    • An average of 14,900 new cases each day
    • 32 total new cases for every 100,000 Americans
    • 16% more new cases than last week (June 26-July 2)

    Last week, America also saw:

    • 14,300 new COVID-19 patients admitted to hospitals (4.3 for every 100,000 people)
    • 1,100 new COVID-19 deaths (0.3 for every 100,000 people)
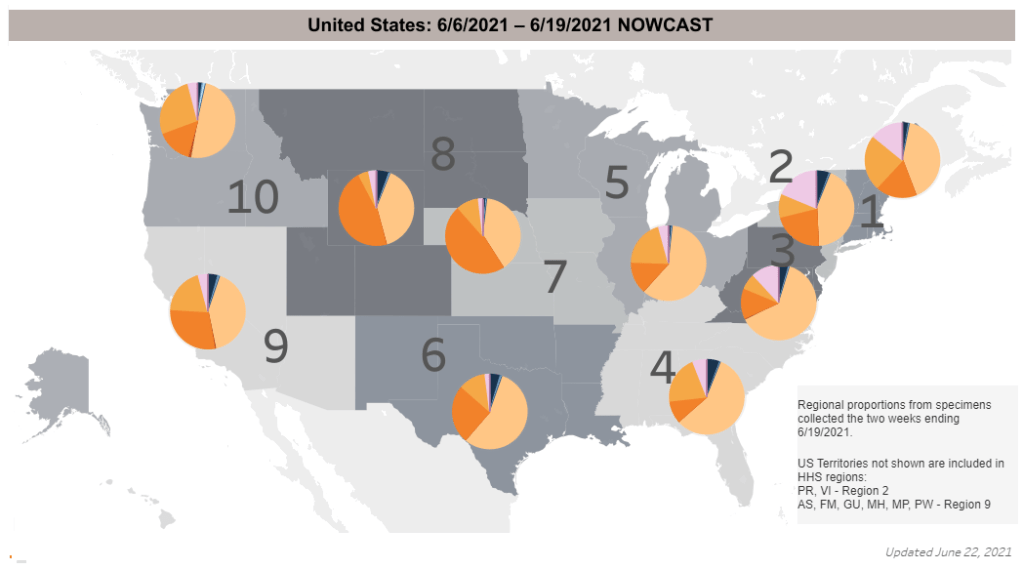
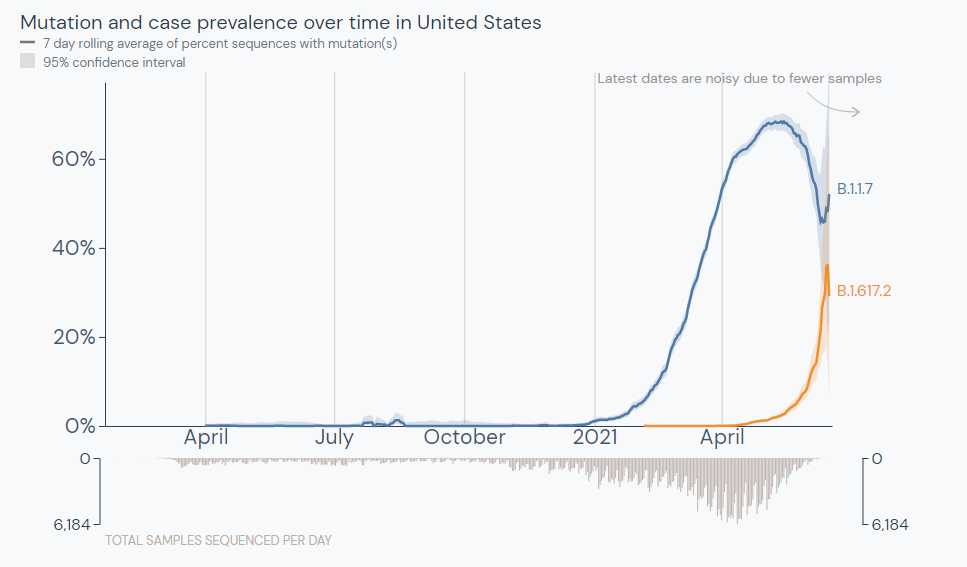
    • 52% of new cases now Delta-caused (as of July 3)
    • An average of 500,000 vaccinations per day (per Bloomberg)

    The Delta variant is now officially causing more than half of new cases in the U.S., per the CDC’s Nowcast estimates. This super-transmissible variant has contributed to rising cases in under-vaccinated parts of the country.

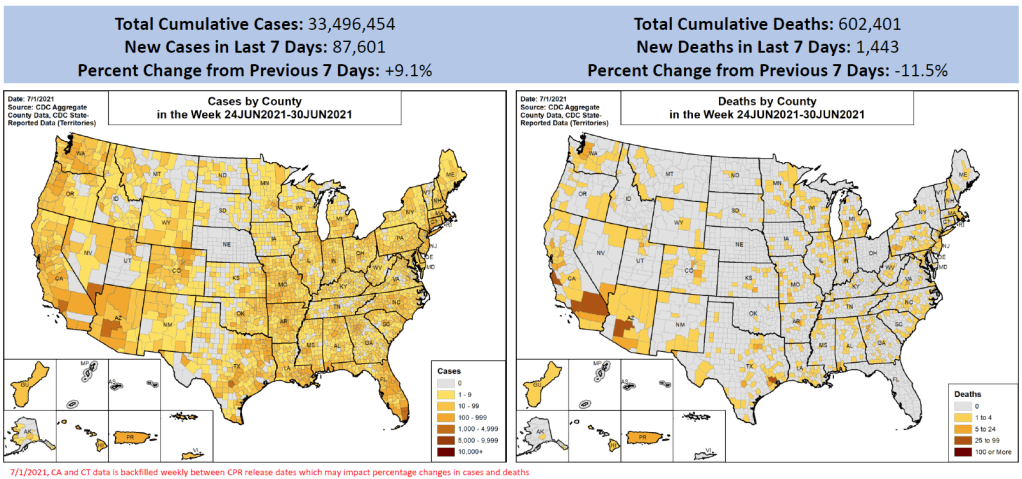
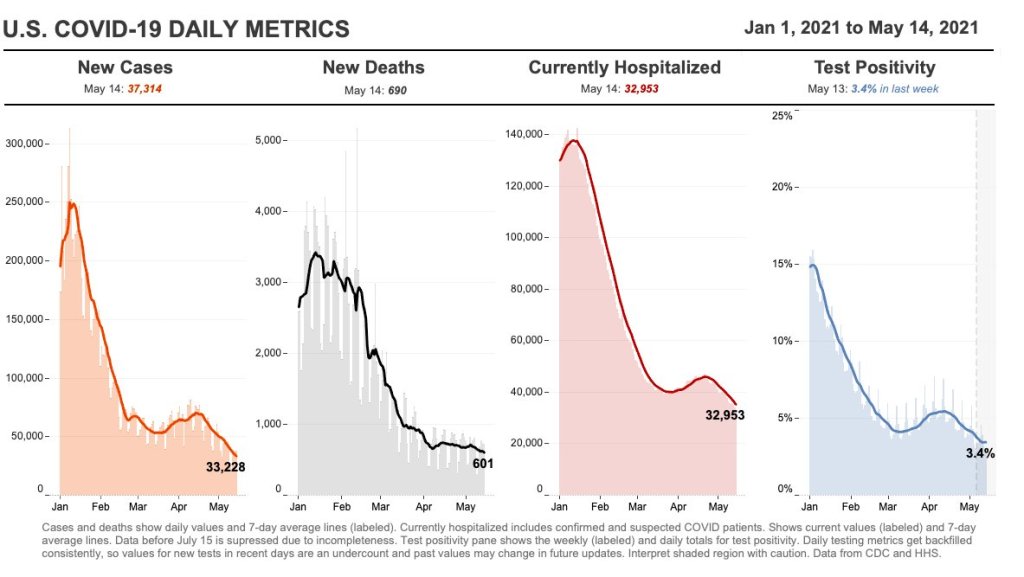
    Cases are now up 16% from last week—and there may be more cases that were delayed in reporting due to the July 4 holiday. Missouri continues to be a hotspot, with 127 cases per 100,000 people in the last week; Arkansas is close behind, at 123 cases per 100,000. Both states have under 40% of their populations fully vaccinated.

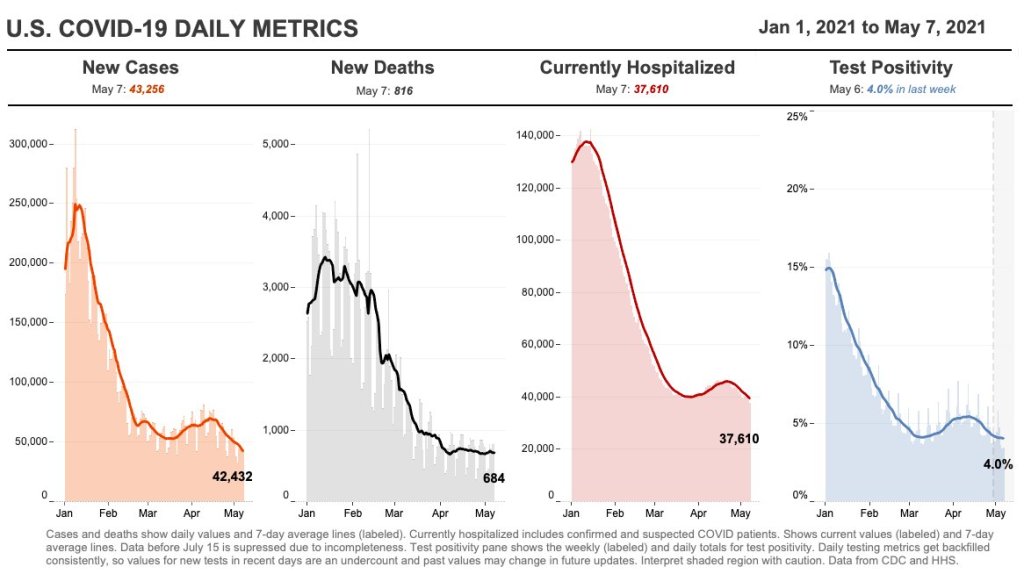
    Hospitalizations are also rising. We’re up to 2,000 admissions a day; this is far from the country’s peak in January (over 16,000 admissions a day), but is concerning after months of decreases. Like cases, hospitalizations are rising more in the South and West.

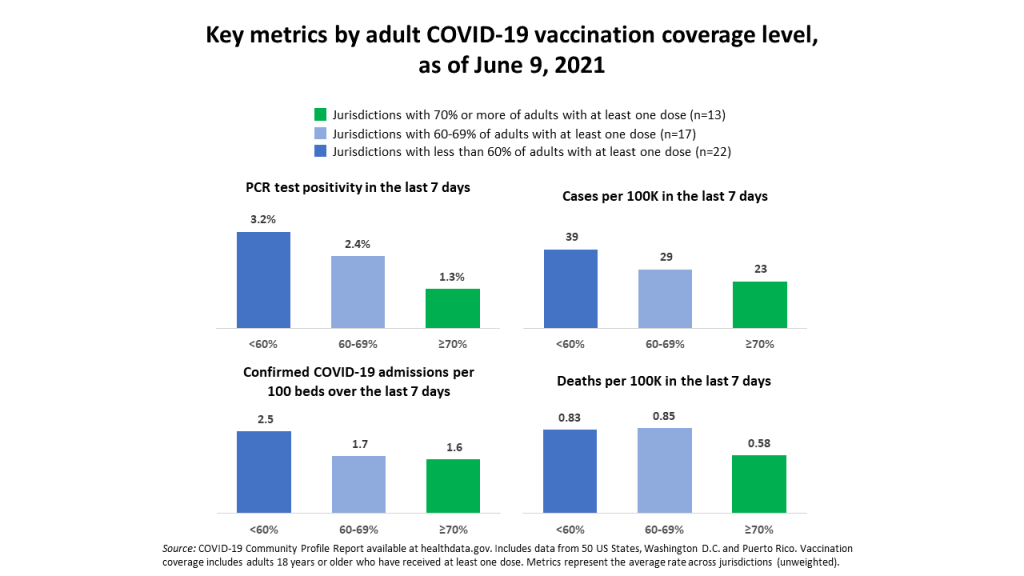
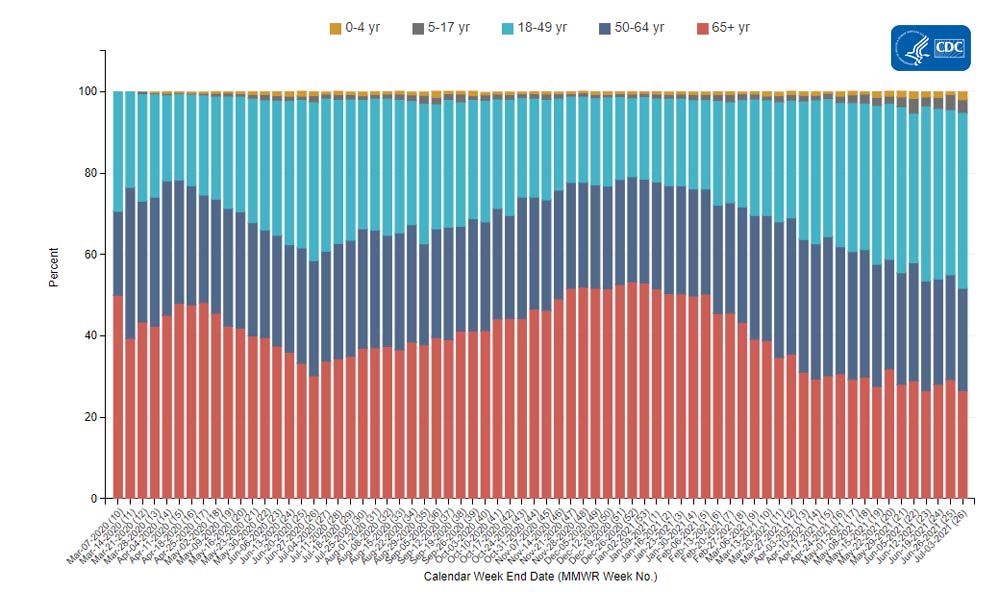
    Numerous studies have shown that the vast majority of COVID-19 patients now in U.S. hospitals are unvaccinated. These patients are also younger, on average, than those hospitalized in earlier stages of the pandemic. Adults between ages 18 and 49 now make up over 40% of COVID-19 hospitalizations, according to the CDC; those over 65 only make up 27% of hospitalizations.

    Meanwhile, vaccinations continue to slow. The U.S. administered an average of only 500,000 shots a day last week, per Bloomberg, and surveys indicate that many remaining unvaccinated Americans are unlikely to be convinced. Two changes that might be able to turn the tide, according to the Kaiser Family Foundation: full FDA approval for a vaccine and more vaccination encouragement (or mandates) from employers.

  • National numbers, July 4

    National numbers, July 4

    Cases are rising in unvaccinated areas, such as Las Vegas and parts of Texas. Chart via the July 1 Community Profile Report.

    In the past week (June 26 through July 2), the U.S. reported about 88,000 new cases, according to the CDC. This amounts to:

    • An average of 12,500 new cases each day
    • 27 total new cases for every 100,000 Americans
    • 9.1% more new cases than last week (June 19-25)

    Last week, America also saw:

    • 13,000 new COVID-19 patients admitted to hospitals (4.0 for every 100,000 people)
    • 1,400 new COVID-19 deaths (0.4 for every 100,000 people)
    • 26% of new cases now Delta-caused (as of June 19)
    • An average of 1.1 million vaccinations per day (per Bloomberg)

    This is the first week since April that we’ve seen new COVID-19 case numbers go up in the U.S. It’s nominally a small bump—about 7,300 more cases than last week—but represents a 9% increase, and may be the beginning of a summer surge. (Even if we see a dip in the numbers this week due to the July 4 holiday.)

    The culprit for this case rise is, of course, the Delta variant (B.1.617.2). According to CDC estimates, the variant makes up about 26% of new cases in the country. But, as I have explained in previous issues, the CDC data are old—that 26% estimate is as of June 19, about two weeks ago.

    The Delta variant is doubling every two weeks, so we can assume that the variant now causes at least half of new cases in the U.S. Estimates from other genomic sequencing sources (which are more up-to-date than the CDC, though less comprehensive) indicate that the variant may now be causing up to 60% of new cases.

    This variant poses the most danger to unvaccinated people; many of the current Delta outbreaks are happening in regions with lower vaccination rates. Nevada and Missouri, the two states with the highest new case counts last week, have about 42% and 39% of their populations fully vaccinated, respectively.

    Some metropolitan areas in Missouri, Texas, and other parts of the Midwest have less than one-third of their populations fully vaccinated—and saw more than 200 new cases for every 100,000 people last week. That’s about seven times the national average for new cases. 

    Nationally, hospitalizations also rose very slightly this week, while deaths remained low, at about 200 new COVID-19 deaths each day. The vaccines continue to protect seniors and other more vulnerable people from severe disease. But it is likely that, in the coming weeks, these numbers will start to rise in the areas seeing Delta outbreaks. Many Midwest hospitals are already filling up.

    More on vulnerable, non-vaccinated pockets later in this issue.

  • National numbers, June 27

    National numbers, June 27

    In the past week (June 19 through 25), the U.S. reported about 79,000 new cases, according to the CDC. This amounts to:

    • An average of 11,000 new cases each day
    • 24 total new cases for every 100,000 Americans
    • 4% fewer new cases than last week (June 12-18)

    Last week, America also saw:

    • 12,900 new COVID-19 patients admitted to hospitals (3.9 for every 100,000 people)
    • 2,000 new COVID-19 deaths (0.6 for every 100,000 people)
    • 52% of new cases in the country now Alpha-caused (as of June 19)
    • 21% of new cases now Delta-caused (as of June 19)
    • An average of 0.75 million vaccinations per day (per Bloomberg)
    CDC map showing estimated variant prevalence by region. The Delta variant, shown in orange here, is most common in the Midwest, where many are unvaccinated.

    Cases have continued to plateau this week, with less than a 5% drop in the daily average. As I’ve said in previous weeks, this is partially due to slowing vaccinations—the White House admitted last week that the U.S. won’t meet Biden’s July 4 goal—and partially due to the Delta variant, which now causes at least 20% of new cases in the country. (More on Delta later.)

    While those parts of the country that are widely vaccinated are still seeing low case numbers, others may need to prepare for another surge. A few Midwest states, in particular, have seen case jumps in recent weeks; the Delta variant is more prevalent in this region than others, per CDC data. (See the orange pie chart slices on the map above.)

    Missouri now has the highest rate of new COVID-19 cases per capita: 87 cases for every 100,000 people during the week ending June 23, more than three times higher than the national average. The state has seen a sharp increase in COVID-19 patients requiring hospital care, including younger adults who may be less likely to get vaccinated. Experts in the state worry that this may be “a preview of what is to come in other parts of the country that don’t have higher vaccination rates.”

    Just under 300 Americans are now dying from COVID-19 every day. A new analysis from the Associated Press confirms what many public health experts have expected: the vast majority of those deaths have occured in unvaccinated people. In May, only 150 out of over 18,000 COVID-19 deaths were in fully vaccinated Americans, the AP analysis found.

    This is why CDC Director Dr. Rochelle Walensky recently said that “nearly every death, especially among adults, due to COVID-19, is, at this point, entirely preventable.”

  • National numbers, June 20

    National numbers, June 20

    The Delta variant is outcompeting the Alpha variant in the U.S. Source: outbreak.info

    In the past week (June 11 through 17), the U.S. reported about 80,000 new cases, according to the CDC. This amounts to:

    • An average of 11,000 new cases each day
    • 24 total new cases for every 100,000 Americans
    • 19% fewer new cases than last week (June 5-11)

    Last week, America also saw:

    • 13,800 new COVID-19 patients admitted to hospitals (4.2 for every 100,000 people)
    • 2,000 new COVID-19 deaths (0.6 for every 100,000 people)
    • 66% of new cases in the country now Alpha-caused (as of June 5)
    • 10% of new cases now Delta-caused (as of June 5)
    • An average of 1.3 million vaccinations per day (per Bloomberg)

    Data note: The CDC skipped an update on Friday in honor of Juneteenth, so this update is a day off from our usual schedule (reflecting a Friday-Thursday week instead of a Saturday-Friday week).

    Last week, I wrote that I’m getting very worried about the Delta variant (or B.1.617.2, the variant first identified in India). Now, I’m even more worried.

    The CDC updated its variant prevalence estimates this week, reporting that the variant makes up 10% of U.S. cases as of June 5. This aligns with other estimates I cited last week, and suggests that the variant is spreading here at a truly rapid pace—its prevalence multiplied by four times in two weeks, according to CDC data.

    That means Delta could be the dominant variant in the U.S. within a month, if not sooner. Vaccinated Americans are well-protected against this variant, but those who are unvaccinated need to get their shots—and soon.

    Vaccinations have picked up a bit this week, per Bloomberg. In the past week, we’ve seen 1.3 million shots administered a day. Still, researchers have estimated that the U.S. is likely to fall short of Biden’s 70%-by-July-4 goal. Disparities persist in the rollout as well.

    Meanwhile, national case numbers continue to drop (though not as dramatically as the drops a few weeks ago), while hospitalization and death numbers remain low. Notably, the vast majority of COVID-19 patients currently in hospitals are unvaccinated.

    When New York Governor Cuomo set off fireworks on Tuesday to celebrate the state’s full reopening, my girlfriend and I went up to our building’s roof to watch—only to be unable to see the show. We later realized that the fireworks were set off in New York Harbor, visible mostly to lower Manhattan (but not the outer boroughs, which have felt the brunt of COVID-19). It felt like an apt metaphor for the current state of the pandemic.

  • National numbers, June 13

    National numbers, June 13

    Vaccines are protecting many communities in the U.S., but those not yet vaccinated remain vulnerable. Posted on Twitter by Cyrus Shahpar.

    In the past week (June 5 through 11), the U.S. reported about 98,000 new cases, according to the CDC. This amounts to:

    • An average of 14,000 new cases each day
    • 30 total new cases for every 100,000 Americans
    • 6% fewer new cases than last week (May 29-June 4)

    Last week, America also saw:

    • 15,700 new COVID-19 patients admitted to hospitals (4.8 for every 100,000 people)
    • 2,400 new COVID-19 deaths (0.7 for every 100,000 people)
    • 69% of new cases in the country now Alpha-caused (as of June 5)
    • 6% of new cases now Delta-caused (as of June 5)
    • An average of 1.1 million vaccinations per day (per Bloomberg)

    After several weeks of sharp declines, new COVID-19 cases in the U.S. now appear to be in a plateau. There are a few factors likely influencing this shift.

    First, the nation’s public health agencies (and data reporting systems) are making up for the reporting lags caused by Memorial Day weekend. As we’ve discussed in the CDD before, holidays always lead to low case numbers immediately after, followed by slight bumps in the following week.

    Second, vaccinations are still progressing at a slow pace—and the unvaccinated remain vulnerable. Jurisdictions with fewer vaccinated adults are seeing more cases, more hospital admissions, and higher PCR test positivity, as Cyrus Shahpar, the White House COVID-19 Director, pointed out on Twitter this week.

    Third, the Delta variant (a.k.a. B.1.617.2, a.k.a. the variant first discovered in India) is rapidly spreading in the U.S.—making the unvaccinated even more vulnerable. (More on that later in the issue.)

    Still, the vaccines are protecting many of the most vulnerable, leading to continued low hospitalization and death numbers. Total confirmed and suspected COVID-19 hospitalizations for the country are below 20,000 for the first time since HHS started tracking this metric.

    Meanwhile, the U.S. is responding to global vaccination needs by pledging to send 500 million doses abroad by the end of 2022. Many of those doses won’t go out until next year, and the world does need faster distribution in order to prevent further variant evolution. But it’s a decent start.

  • National numbers, June 6

    National numbers, June 6

    In the past week (May 29 through June 4), the U.S. reported about 100,000 new cases, according to the CDC. This amounts to:

    • An average of 14,000 new cases each day
    • 31 total new cases for every 100,000 Americans
    • 35% fewer new cases than last week (May 22-28)

    Last week, America also saw:

    • 18,000 new COVID-19 patients admitted to hospitals (5.5 for every 100,000 people)
    • 2,300 new COVID-19 deaths (0.7 for every 100,000 people)
    • 70% of new cases in the country now B.1.1.7-caused (as of May 8)
    • An average of 1 million vaccinations per day (per Bloomberg)

    Cases continued to fall this week, with a seven-day average now under 20,000 new cases a day. This is basically the lowest number we’ve seen in the U.S. since spring 2020—though it’s important to note that the U.S. was doing minimal testing at that time, so the true case numbers in March 2020 were likely much higher than what was reported.

    Also, last weekend’s holiday—like past holidays—likely resulted in fewer cases being reported early this week. Many testing sites and public health departments close for holidays, and it’s hard to imagine who might want to go get a nose swab on Memorial Day. Fewer than 10,000 new cases were reported last Monday and Tuesday, according to the CDC, followed by double that number each day for the rest of the week.

    Despite such low overall case numbers, infection rates remain high for the unvaccinated. A recent Washington Post analysis adjusted COVID-19 infection rates by subtracting vaccinated residents from state populations. In Washington state, for example, the case rate among unvaccinated residents is “as high as it was in late January.”

    Also, as policy researcher Julia Raifman pointed out on Twitter, fewer than half of the lowest income workers with kids are vaccinated—likely because of vaccine accessibility issues. Workers in this income bracket are also more likely to report that they had to miss work due to a COVID-19 infection, compared to higher-income Americans. 

    Nationwide, about half of the U.S. population has had at least one dose, including 63% of adults and 86% of seniors. The rate of vaccinations has slowed this past week (now only one million doses administered a day)—though this may in part be a holiday reporting lag as well. Biden’s administration continues throwing incentives at the problem in the hopes of meeting his July 4 goal.

    Testing numbers have also fallen in recent weeks, likely because vaccinated Americans have few reasons to need a test. Data watcher (and former COVID Tracking Project volunteer) Conor Kelly noted that we’re averaging under 1 million tests a day for the first time since fall 2020. At the same time, though, the national positivity rate for PCR tests is lower than ever—it hit 2.2% on June 1.

    Things are looking pretty good here in the U.S., though some experts say a summer or fall surge could still be possible if we relax restrictions too much. Other countries without vaccine access are not nearly so lucky.

  • National numbers, May 30

    National numbers, May 30

    New COVID-19 cases by region, via the WHO (data as of May 29).

    In the past week (May 22 through 28), the U.S. reported about 151,000 new cases, according to the CDC. This amounts to:

    • An average of 22,000 new cases each day
    • 46 total new cases for every 100,000 Americans
    • 22% fewer new cases than last week (May 15-21)

    Last week, America also saw:

    • 21,900 new COVID-19 patients admitted to hospitals (6.7 for every 100,000 people)
    • 3,000 new COVID-19 deaths (0.9 for every 100,000 people)
    • 70% of new cases in the country now B.1.1.7-caused (as of May 8)
    • An average of 1.4 million vaccinations per day (per Bloomberg)

    Cases, deaths, and hospitalizations all continue to drop nationwide. The U.S. reported about 3,000 COVID-19 deaths last week, in total—at the peak of the winter surge, we saw more than 3,000 deaths a day.

    This trend is echoed in most states. In the May 27 Community Profile Report, the HHS classifies almost every state as “orange” (between 50 and 100 new cases per 100,000 residents over the past week) or “yellow” (between 10 and 50 cases per 100,000). Wyoming is the only state in the “red” classification, at 101 cases per 100,000 over the past week—while California is in the green, with only 9 cases per 100,000.

    In New York City, where I live, every single ZIP code currently has a test positivity rate at 3% or lower—for the first time since last summer. This is yet another piece of good news showing how well the vaccines work. Half of the total U.S. population has had at least one dose and more than half of the adult population is fully vaccinated, as of yesterday.

    The vaccines also continue to do their part against variants. The CDC variant data—updated this week—indicate that B.1.1.7 is still growing, but it’s leveling off as new cases slow. This variant has gone from causing about 60% of cases in early April, to 67% in mid-April, to 70% in early May; a much slower decline than what we saw in February and March.

    Of more concern: P.1, the variant first identified in Brazil, is causing 7% of U.S. cases as of May 8—and the CDC’s Nowcast estimate puts it at almost 10% of cases by May 22. B.1.617, the variant first identified in India, is also sharply increasing; its case share doubled from April 24 to May 8. Both of these variants are more transmissible (B.1.617 dangerously so) and may have lowered vaccine efficacy.

    But the harm these variants can cause in the heavily-vaccinated U.S. pales in comparison to the risk they pose in other nations. As evidenced by the World Health Organization chart above, the share of cases in Southeast Asia and other lower-income nations is increasing even as cases in the U.S. and Europe drop. The U.S. should focus on providing aid to the nations where vaccinations are lagging so that we can help inoculate people before more, harder-to-contain variants evolve.

    In other words, there’s a reason I’m not giving space to the lab leak theory in this publication. If you’d like to read more about the issue, I recommend this article by Amy Maxmen.

  • National numbers, May 23

    National numbers, May 23

    In the past week (May 15 through 21), the U.S. reported about 195,000 new cases, according to the CDC. This amounts to:

    • An average of 28,000 new cases each day
    • 59 total new cases for every 100,000 Americans
    • 19% fewer new cases than last week (May 8-14)
    Nationwide COVID-19 metrics as of May 21, sourcing data from the CDC and HHS. Posted on Twitter by Conor Kelly.

    Last week, America also saw:

    • 24,000 new COVID-19 patients admitted to hospitals (7.3 for every 100,000 people)
    • 3,500 new COVID-19 deaths (1.1 for every 100,000 people)
    • 66% of new cases in the country now B.1.1.7-caused (as of April 24)
    • An average of 1.9 million vaccinations per day (per Bloomberg)

    I’m starting to feel like a broken record in these updates—but in a good way. U.S. cases continue falling, with our seven-day average now at a level not seen since May 2020.

    Trends in COVID-19 deaths usually echo trends in cases with about a month’s delay. After several weeks of falling cases, the U.S. is now seeing fewer than 500 new COVID-19 deaths a day. This week, 24 states averaged fewer than one new death a day for every 100,000 residents.

    These states include California, Arizona, the Dakotas, and other states that made headlines in past months for their concerning outbreaks—yet another indication that the vaccines are working. Only three states (Michigan, Pennsylvania, and Alaska) saw over two deaths a day for every 100,000 people.

    Vaccinations continue at the slow, steady, 1.5-to-2 million a day pace we’ve seen for the past couple of weeks. About 61% of adults have had at least one dose, and almost half of adults are now fully vaccinated. Meanwhile, many kids in the 12 to 15 age range are taking advantage of their new eligibility: about 1.6 million have received at least one dose so far. 16% of the first doses administered in the last two weeks went to this population.

    Variant numbers haven’t been updated since last week. B.1.1.7 continues to be the dominant variant in the U.S., and other concerning variants (such as B.1.617 from India) continue to spread. But accumulating evidence suggests that the vaccines work well against all variants. Just yesterday, researchers in the U.K. reported 81% effectiveness against B.1.617, according to the Financial Times.

  • National numbers, May 16

    National numbers, May 16

    In the past week (May 8 through 14), the U.S. reported about 248,000 new cases, according to the CDC. This amounts to:

    • An average of 35,000 new cases each day
    • 76 total new cases for every 100,000 Americans
    • 24% fewer new cases than last week (May 1-7)
    Nationwide COVID-19 metrics as of May 14, sourcing data from the CDC and HHS. Posted on Twitter by Conor Kelly.

    Last week, America also saw:

    • 28,300 new COVID-19 patients admitted to hospitals (8.6 for every 100,000 people)
    • 4,100 new COVID-19 deaths (1.3 for every 100,000 people)
    • 66% of new cases in the country now B.1.1.7-caused (as of April 24)
    • An average of 1.9 million vaccinations per day (per Bloomberg)

    COVID-19 case numbers continue to drop this week: the current U.S. average is about 35,000 new cases a day, a 50% drop from where we were a month ago. (We saw 70,000 new daily cases in the week ending April 16.) Daily cases have not been this low since early September, between the summer and fall/winter surges.

    Hospitalizations are also down: about 4,000 new COVID-19 patients were admitted each day this week, compared to about 5,500 a month ago. While this drop is not as dramatic as the drop in cases, it may actually be an indicator that hospitals are admitting and caring for patients with less severe illness—who may not have been admitted in, say, January. Regardless, the more beds a hospital has to spare, the better care it can provide. All states have inpatient bed occupancy rates at 80% or below except for Massachusetss and Rhode Island.

    The CDC updated its variant data this week with figures as of April 24. B.1.1.7 is causing two out of every three COVID-19 cases in the country, according to these data. After B.1.1.7, the most prevalent variant is B.1.526 (14%); this variant, first discovered in NYC, is still classified as a “variant of interest,” so state-by-state data are not available. P.1 also gaining ground: it now causes 5% of U.S. cases, with much higher values in some states (20% of Illinois cases, 11% of Massachusetts cases).

    Though these variants may be worrying, our continued case drop shows that the vaccines are beating them—more on that later. 37% of the overall U.S. population is now fully vaccinated, and 47% has had at least one dose. 

    But some states are doing much better than others. Only 26% of Mississippi’s population is fully vaccinated, compared to almost 50% in Connecticut and Maine. Racial inequities persist as well: Bloomberg reports that only 10 states have vaccinated at least a third of their Black and Hispanic populations, while over 30 states have vaccinated this share of their White and Asian populations.

    As the pace of vaccinations continues to slow (1.9 million per day, as of yesterday), these disparities must be addressed.

  • National numbers, May 9

    National numbers, May 9

    In the past week (May 1 through 6), the U.S. reported about 321,000 new cases, according to the CDC. This amounts to:

    • An average of 46,000 new cases each day
    • 98 total new cases for every 100,000 Americans
    • 13% fewer new cases than last week (April 24-30)
    Nationwide COVID-19 metrics as of May 7, sourcing data from the CDC and HHS. Posted on Twitter by Conor Kelly.

    Last week, America also saw:

    • 32,500 new COVID-19 patients admitted to hospitals (10 for every 100,000 people)
    • 4,600 new COVID-19 deaths (1.4 for every 100,000 people)
    • 59.6% of new cases in the country now B.1.1.7-caused (as of April 10)
    • An average of 2.0 million vaccinations per day (per Bloomberg)

    The rate of new cases continues to drop: this is the first time we’ve seen an average under 50,000 daily cases since early October, 2020. Nationally, fewer than one in one thousand Americans was diagnosed with COVID-19 last week. Still, even after a couple of weeks of declines, case rates in Michigan and other Northeastern and Midwestern states remain at a concerning level: over 100 new cases per 100,000 people. 

    Hospitalization and death numbers have remained fairly constant for the last month. Between 4,000 and 5,000 new COVID-19 patients are admitted to the hospital each day; as I discussed in this recent story for Science News, younger patients (under age 50) are making up a larger share of those hospitalized than this age group did in earlier periods of the pandemic.

    The demographic change is, of course, thanks to vaccination. While about 43% of American adults are now fully vaccinated, an impressive 71% of seniors (over age 65) are fully vaccinated—and 84% of seniors have received at least one dose, as of May 8. Still, we have many shots in arms to go before reaching President Biden’s new goal: one dose for at least 70% of Americans by July 4.

    A recent update to the Kaiser Family Foundation’s COVID-19 Vaccine Monitor shows how vaccine supply/demand tension is playing out across the country. Some states in the South and West with lower vaccinated shares of their populations are also administering new first doses at lower rates. In Mississippi, for example, only 41% of the population has received a first dose and the state is administering new first doses at a daily rate of 136 per 100,000. Overall, the U.S. is administering 2 million doses per day, way down from last month’s 3+ million peak.

    This past Wednesday, the Biden administration announced its support of waiving intellectual property rights for COVID-19 vaccines. The announcement garnered a lot of enthusiasm in the public health community, especially as cases continue to surge in India, other parts of Asia, and South America. But a lot of negotiations remain until vaccine technology can actually be shared with the world; if you’re looking for a detailed rundown, I recommend this issue of Geneva Health Files, a newsletter run by my former CUNY classmate Priti Patnaik.