Tag: March data

  • National numbers, March 26

    National numbers, March 26

    Data from WastewaterSCAN suggest that most sites in its network saw downward coronavirus trends or plateaus in recent weeks.

    In the past week (March 16 through 22), the U.S. officially reported about 130,000 new COVID-19 cases, according to the CDC. This amounts to:

    • An average of 19,000 new cases each day
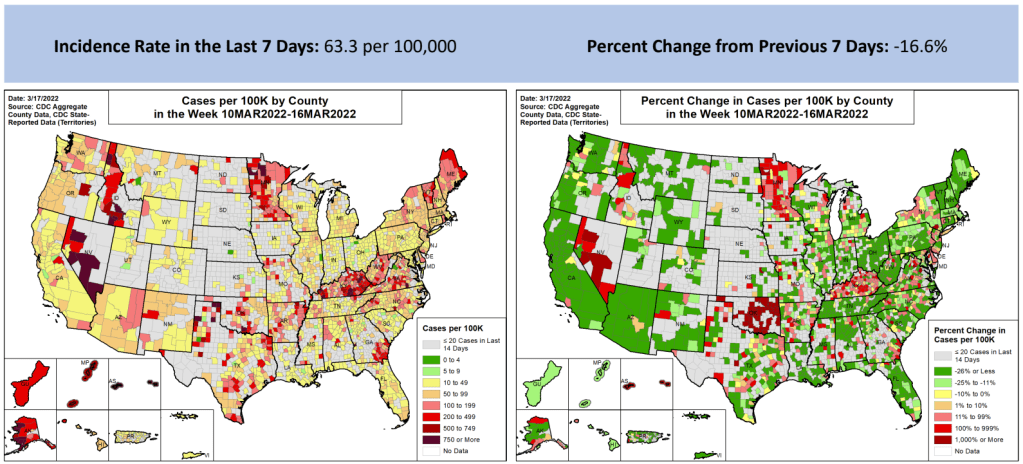
    • 41 total new cases for every 100,000 Americans
    • 13% fewer new cases than last week (March 9-15)

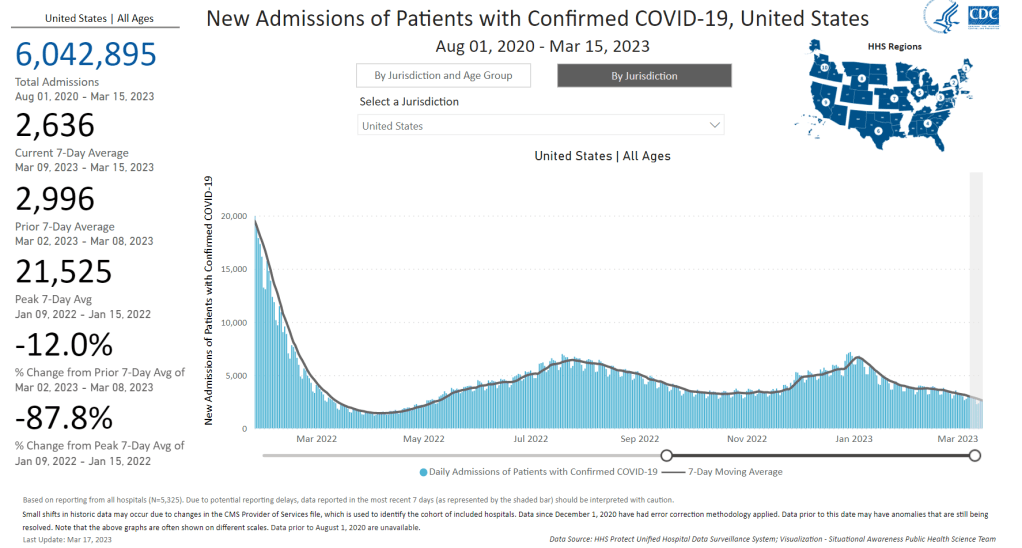
    In the past week, the U.S. also reported about 17,000 new COVID-19 patients admitted to hospitals. This amounts to:

    • An average of 2,400 new admissions each day
    • 5.2 total admissions for every 100,000 Americans
    • 9% fewer new admissions than last week

    Additionally, the U.S. reported:

    • 2,000 new COVID-19 deaths (300 per day)
    • 90% of new cases are caused by Omicron XBB.1.5; 3% by XBB.1.9.1; 2% by XBB.1.5.1; 0.4% by CH.1.1 (as of March 18)
    • An average of 40,000 vaccinations per day

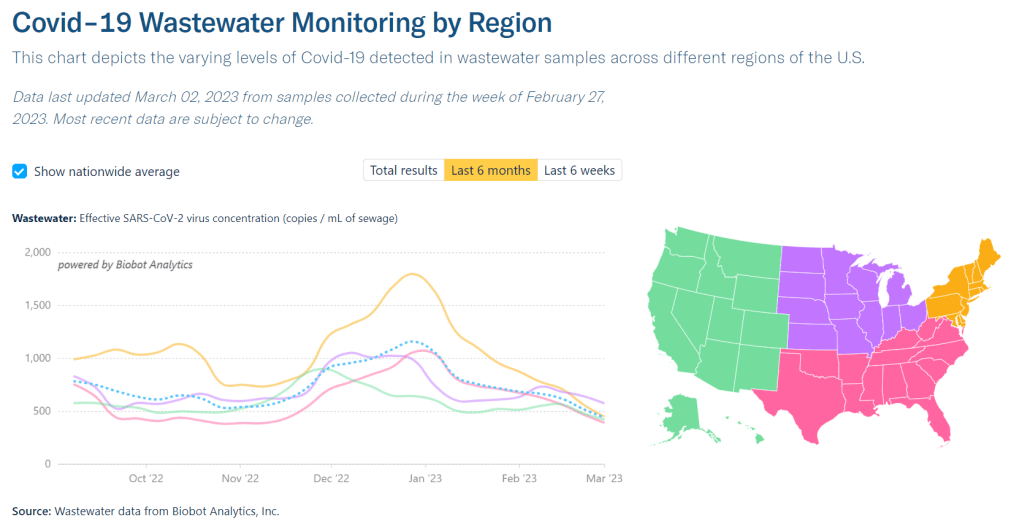
    Nationally, we continue to see the same slow decline of COVID-19 spread across the U.S., as shown by official case data, hospitalizations, and wastewater surveillance.

    Reported cases dropped by 13% last week compared to the week prior, while new hospital admissions dropped by 9%. As I’ve noted in the last couple of updates, the CDC continues to deal with reporting delays from different state health departments. This week, Texas, Arkansas, Florida, and Indiana did not report cases to the CDC.

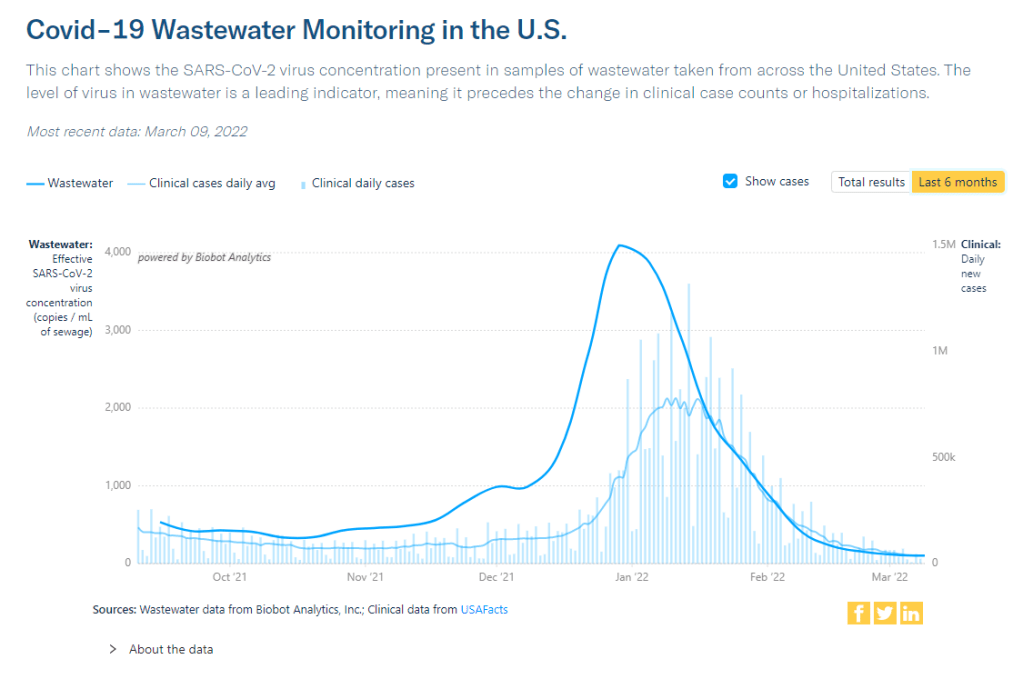
    Wastewater surveillance data from Biobot and the WastewaterSCAN project suggest that COVID-19 levels are at slow declines or plateaus in most parts of the country, but some places may be seeing small increases. Biobot’s dashboard shows slight upticks in the Northeast, Midwest, and West coast regions, as of its March 22 update. 

    Overall, Biobot’s data suggests that national coronavirus concentrations are lower than they’ve been in about a year—but still higher than we’ve seen at this point in 2021 and 2022. The low case numbers that health departments are putting out mask a high baseline of infections, in which many people are not getting PCR tests or reporting their cases to the healthcare system.

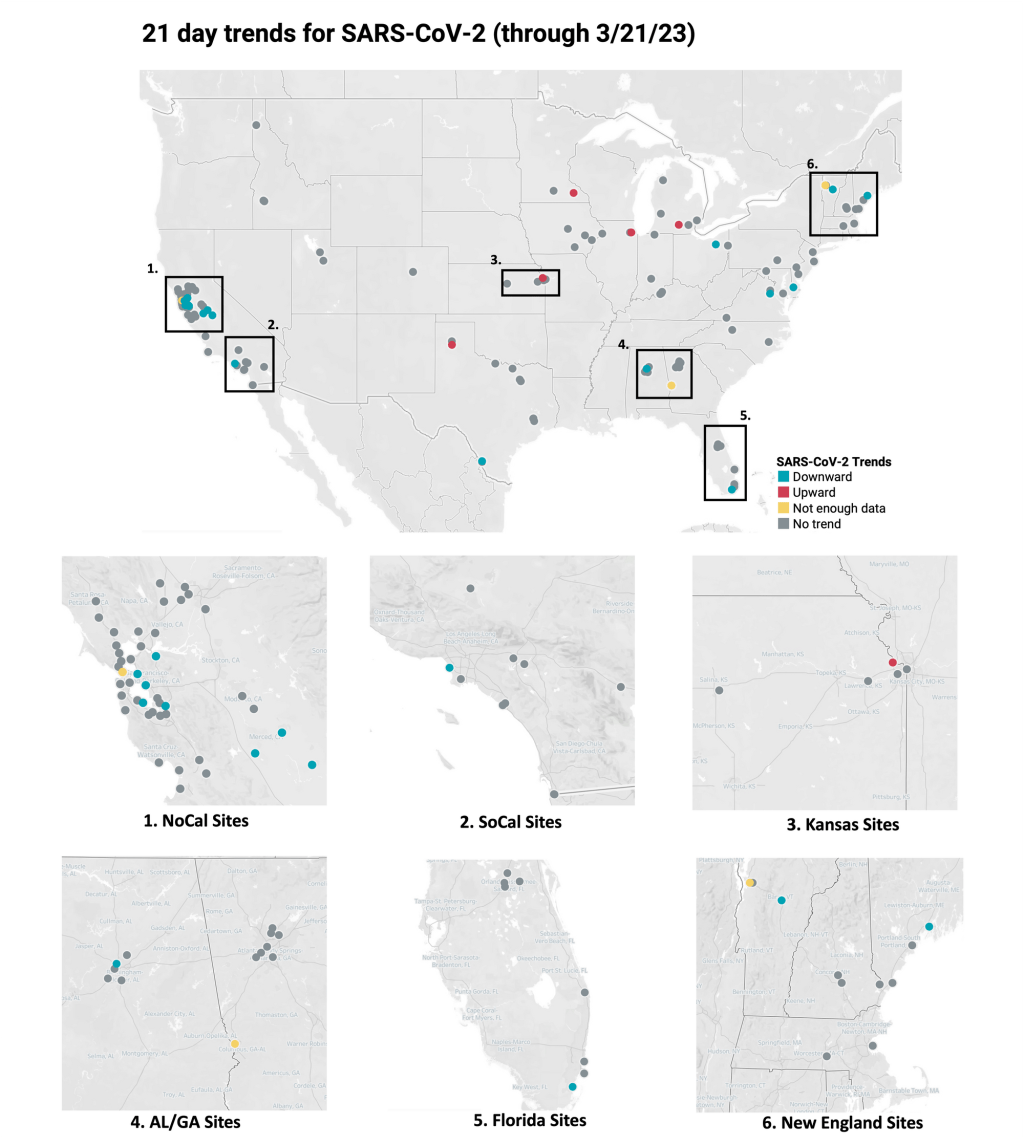
    Data from the WastewaterSCAN project suggest that most of the project’s 148 monitoring sites reported downward trends or plateaus in coronavirus levels over the last three weeks. A few places have reported upticks, though, including sites in Kansas, Michigan, South Carolina, Massachusetts, and Oklahoma. 

    One reason for these upticks could be XBB.1.9.1, the latest Omicron subvariant to draw concern among virologists. The CDC started reporting estimates for XBB.1.9.1 in its latest variant update (this Friday): the agency estimates that this variant caused 2.5% of new cases nationwide last week, with higher prevalence (about 13%) in the Midwest region that includes Iowa, Kansas, Missouri, and Nebraska.

    XBB.1.9.1 is doubling “roughly every 8 days,” according to Marc Johnson, a virologist at the University of Missouri who leads the state’s wastewater surveillance program. Johnson predicts that this subvariant will be dominant in the U.S. by the end of April, but it could face competition from XBB.1.16—another descendant of XBB that has been spreading rapidly in India. 

    Could the spread of these XBB sublineages across the U.S. cause a significant rise in cases and hospitalizations? It’s hard to say, given the complex picture of immunity in the country, with millions of people recently infected by a variety of variants. “Future waves are getting harder and harder to forecast,” Katelyn Jetelina wrote in Your Local Epidemiologist this week. Regardless, the same safety measures (masks, testing, etc.) continue to work against all new versions of the virus.

  • National numbers, March 19

    National numbers, March 19

    New hospital admissions have fallen significantly from their recent peak in January, but are still much higher than at this time last year. Chart from the CDC.

    In the past week (March 9 through 15), the U.S. officially reported about 150,000 new COVID-19 cases, according to the CDC. This amounts to:

    • An average of 21,000 new cases each day
    • 46 total new cases for every 100,000 Americans
    • 20% fewer new cases than last week (March 2-8)

    In the past week, the U.S. also reported about 19,000 new COVID-19 patients admitted to hospitals. This amounts to:

    • An average of 2,800 new admissions each day
    • 5.9 total admissions for every 100,000 Americans
    • 10% fewer new admissions than last week

    Additionally, the U.S. reported:

    • 1,700 new COVID-19 deaths (240 per day)
    • 90% of new cases are caused by Omicron XBB.1.5; 2% by XBB.1.5.1; 0.5% by CH.1.1 (as of March 18)
    • An average of 40,000 vaccinations per day

    The trend continues: COVID-19 spread is still on the decline across the U.S., but it’s a slow decline. These updates are getting pretty repetitive to write, as we’ve been seeing this pattern since late January—which, honestly, I’m taking as a good sign.

    Last week, I noted that the drop in official COVID-19 cases (reported to the CDC) was exaggerated slightly because of data delays; three states didn’t report cases in the week ending March 8. This week, the same thing happened for three different states: Texas, Arkansas, and Indiana. We’ll likely continue to see reporting issues like this, as state and local health departments put fewer resources into tracking COVID-19.

    Even so, the official case data, hospital admissions, and wastewater surveillance all point to continued decreases in coronavirus transmission. National hospital admissions dropped by about 12% this week compared to the week prior. But there are still a lot of Americans getting severe COVID-19 symptoms, with more than 3,000 people newly hospitalized each week for the last month.

    Wastewater surveillance data from Biobot suggest that coronavirus spread is getting lower, but it’s still at much higher levels nationally than we saw at this time in 2021 and 2022. Regionally, the Midwest now has slightly more virus circulating than other parts of the country, but all four major regions are seeing slow declines or plateaus.

    In other good news: flu activity is still low nationally, according to the CDC’s flu surveillance. Experts had worried we might see a second flu surge, driven by a different strain of the influenza virus, after the initial surge died down in January. But so far, that hasn’t happened. Almost every state reported moderate or low levels of influenza-like activity in the week ending March 11.

    XBB.1.5 continues to be the dominant coronavirus lineage in the U.S., causing an estimated 90% of cases nationwide in the week ending March 18. XBB.1.5.1, a descendant of XBB.1.5, is growing slowly (it caused an estimated 2% of cases nationwide this week) and doesn’t seem to be very competitive yet. The CDC also has yet to break out XBB.1.9 or XBB.1.16, other subvariants that mutated from XBB.

    Yesterday, I spoke about wastewater surveillance at New York City School of Data, a civic conference that’s part of the city’s Open Data Week. While the conference wasn’t focused on health or science topics, the organizers required masks and checked attendees’ vaccinations. I also brought my CO2 monitor to the event, and found ventilation was generally good in the session rooms. This conference was a nice reminder that some organizations are still following the data and science on COVID-19 precautions.

  • National numbers, March 12

    National numbers, March 12

    In New York City, where I live, COVID-19 test positivity is the lowest it’s been since early spring 2022. Chart from the NYC health department.

    In the past week (March 2 through 8), the U.S. officially reported about 170,000 new COVID-19 cases, according to the CDC. This amounts to:

    • An average of 24,000 new cases each day
    • 52 total new cases for every 100,000 Americans
    • 25% fewer new cases than last week (February 23-March 1)

    In the past week, the U.S. also reported about 20,000 new COVID-19 patients admitted to hospitals. This amounts to:

    • An average of 2,800 new admissions each day
    • 6.1 total admissions for every 100,000 Americans
    • 13% fewer new admissions than last week

    Additionally, the U.S. reported:

    • 1,900 new COVID-19 deaths (270 per day)
    • 90% of new cases are caused by Omicron XBB.1.5; 2% by XBB.1.5.1; 1% by CH.1.1 (as of March 11)
    • An average of 50,000 vaccinations per day

    Following the same pattern we’ve seen for the last few weeks, COVID-19 spread is still on the decline nationally. Official case counts, hospital admissions, and wastewater surveillance data all continue to point in this direction.

    This week, the decline in CDC-reported cases was sharper than it’s been in a couple of months (with 25% fewer cases reported than the prior week). But this may be due to reporting issues, rather than an actual change in transmission patterns: the CDC’s case trends page explains that Florida, Washington State, and Utah all did not report cases in the week ending March 8.

    Still, I’m heartened by the fact that hospital admissions—which are reported more reliably—dropped by 13% this week, compared to smaller week-over-week changes over the last month. Wastewater surveillance data from Biobot also continue to show steady declines, though we’re still not close to the national lows observed during this time in 2021 and 2022.

    Biobot’s data suggest declining surveillance in all four major regions of the country, with coronavirus levels in the Northeast now dropping below the Midwest, South, and West coast. Some individual counties in the Midwest are still reporting increased viral concentrations in their wastewater; I specifically noted Sheridan County and Teton County, Wyoming in Biobot’s data.

    Omicron XBB.1.5 has been the dominant variant in the U.S. since mid-January, and we have yet to see a new subvariant rise to meaningfully compete with it. CH.1.1, which has driven increased transmission in other parts of the world, has remained under 2% of new cases nationally, per the CDC’s estimates.

    The CDC’s latest variant update also breaks out XBB.1.5.1, an offshoot of XBB.1.5, at about 2% of new cases nationally. I have yet to see much discussion of this offshoot or how it differs from XBB.1.5; I’ll cover it more in future issues as we learn more. In addition, variant experts are keeping an eye on XBB.1.9, XBB.1.16, and other subvariants that have further mutated from the XBB lineage.

    In his latest Substack newsletter, long-time COVID-19 commentator Eric Topol suggests that the U.S. might be in a welcome “break from COVID-19 waves.” He points to XBB.1.5’s dominance and the fact that its rise “was not associated with a surge of COVID-19 hospitalizations or deaths in the United States or elsewhere in the world” despite the subvariant’s increased capacity to spread.

    At the same time, Topol explains the problem with our current “high baseline” of continued COVID-19 spread, which leads to continued severe cases among vulnerable people and the ongoing risk of Long COVID. He also explores the potential for another Omicron-like event, which would potentially cause another major surge. His article is helpful for understanding our current COVID-19 moment.

    In NYC, where I live, COVID-19 case rates and test positivity are lower than they’ve been since early 2022—while still much higher than we saw last spring post-Omicron BA.1, or in spring 2021 as vaccines were widely rolled out. And the numbers are likely going to get more unreliable soon, as the city begins to wind down public testing sites.

  • National numbers, March 5

    National numbers, March 5

    Wastewater data from Biobot suggest that COVID-19 spread is still declining throughout the country, but slowly.

    In the past week (February 23 through March 1), the U.S. officially reported about 230,000 new COVID-19 cases, according to the CDC. This amounts to:

    • An average of 32,000 new cases each day
    • 69 total new cases for every 100,000 Americans
    • 5% fewer new cases than last week (February 16-22)

    In the past week, the U.S. also reported about 23,000 new COVID-19 patients admitted to hospitals. This amounts to:

    • An average of 3,300 new admissions each day
    • 7.1 total admissions for every 100,000 Americans
    • 8% fewer new admissions than last week

    Additionally, the U.S. reported:

    • 2,300 new COVID-19 deaths (330 per day)
    • 90% of new cases are caused by Omicron XBB.1.5; 8% by BQ.1 and BQ.1.1; 1% by CH.1.1 (as of March 4)
    • An average of 50,000 vaccinations per day

    At the national level, major COVID-19 metrics continue to indicate slow declines in transmission. As I’ve been writing for the last few weeks, we’re at a “low tide” point in COVID-19 spread: clearly lower than the peaks that occur after holidays or new variants, but much higher than the baselines that we experienced before the Omicron era.

    Official cases reported by the CDC dropped by 5% last week compared to the week prior, while new hospital admissions dropped by 8%. Wastewater data from Biobot show declining coronavirus levels nationally, but viral concentrations in wastewater are twice as high as they were at this point in 2021 or 2022.

    Biobot’s regional data suggest that the Midwest has overtaken the Northeast in coronavirus concentrations for the first time since late summer 2022. Both regions are seeing declines, but the declining spread in the Northeast has accelerated a bit faster than that in the Midwest.

    While most individual states and counties are reporting COVID-19 declines as well, a few have reported increased coronavirus in their wastewater in recent weeks. This includes counties in Idaho, Wyoming, Montana, Florida, Texas, and others in the Midwest and South.

    Omicron XBB.1.5 continues to be the dominant variant in the U.S., now accounting for about 90% of new cases in the last week, per CDC estimates. Viral evolution experts will be watching to see if XBB.1.5 mutates further, or if some other variant arrives to compete with it.

    As we head into the spring, U.S. COVID-19 data continue to get harder to find and less reliable. Last week, the Department of Health and Human Services announced that it would retire its Community Profile Reports, which I used to rely on as a regular source for this newsletter.

    Meanwhile, a study from Denis Nash and his team at the City University of New York that estimated true COVID-19 prevalence during the BA.4/BA.5 surge last summer was recently published in the journal Preventative Medicine. I covered this study when it was released as a preprint last fall, and find it striking that no other estimates like this have emerged since then.

  • National numbers, March 27

    National numbers, March 27

    The Northeast has seen a small uptick in coronavirus levels in its wastewater in recent weeks, followed by a plateau. Chart via Biobot Analytics.

    In the past week (March 19 through 25), the U.S. reported about 190,000 new COVID-19 cases, according to the CDC. This amounts to:

    • An average of 27,000 new cases each day
    • 58 total new cases for every 100,000 Americans
    • 5% fewer new cases than last week (March 12-18)

    In the past week, the U.S. also reported about 13,000 new COVID-19 patients admitted to hospitals. This amounts to:

    • An average of 1,800 new admissions each day
    • 3.9 total admissions for every 100,000 Americans
    • 21% fewer new admissions than last week

    Additionally, the U.S. reported:

    • 5,200 new COVID-19 deaths (1.6 for every 100,000 people)
    • 100% of new cases are Omicron-caused; 35% BA.2-caused (as of March 19)
    • An average of 100,000 vaccinations per day (per Bloomberg)

    New COVID-19 case numbers for the U.S. overall are still decreasing, according to the CDC’s data. But the drop from the previous week’s cases to this week’s cases (about 5%) is lower than any week-over-week change since Omicron peaked in January, suggesting that we’re heading for a plateau—if not a new increase.

    Last week, I discussed a potential new surge in the U.S. driven by the Omicron sublineage BA.2, which is more transmissible than the version of Omicron we faced a couple of months ago. BA.2 caused about 35% of new COVID-19 cases nationwide in the week ending March 19, according to CDC estimates, up from 22% in the prior week.

    As BA.2 slowly outcompetes the other Omicron sublineages in the U.S., we also continue to see case upticks in some parts of the country. States that reported case increases in the last week include Arkansas, Kentucky, Maine, New York, Colorado, Massachusetts, and Vermont, according to the March 24 Community Profile Report. (Arkansas and Kentucky reported week-over-week increases above 25%, while the other states here reported increases above 10%.)

    Wastewater data align somewhat with these case increases. Biobot’s tracker shows a slight uptick (followed by a plateau) in coronavirus levels in the Northeast’s wastewater, at a regional level, along with plateaus in other parts of the country. And about 40% of sites in the CDC’s national wastewater network have reported increases over the last two weeks—though the CDC’s data are difficult to interpret, as this tracker doesn’t provide context on actual wastewater levels at each site.

    To be clear, it’s good news that we aren’t seeing major case increases yet, just some small upticks. At the same time, numbers of newly hospitalized COVID-19 patients and deaths are dropping to levels not seen since last summer; this week, about 750 people died of the disease each day, according to the CDC—the first time this number has been under 1,000 in several months.

    In a recent TIME article, several experts suggested that vaccines plus lingering immunity from the Omicron wave in December and January may protect the U.S. from a major surge with BA.2. Still, with safety measures dropping across the country, in the event that we do see a major new surge (from BA.2 or otherwise), we won’t be prepared to curb virus transmission in a meaningful way.

  • National numbers, March 20

    National numbers, March 20

    COVID-19 case rates are still going down across the country, but it’s unclear how long this lull between surges will last. Chart via the March 17 Community Profile Report.

    In the past week (March 12 through 18), the U.S. reported about 210,000 new COVID-19 cases, according to the CDC. This amounts to:

    • An average of 30,000 new cases each day
    • 64 total new cases for every 100,000 Americans
    • 17% fewer new cases than last week (March 5-11)

    In the past week, the U.S. also reported about 16,000 new COVID-19 patients admitted to hospitals. This amounts to:

    • An average of 2,300 new admissions each day
    • 4.9 total admissions for every 100,000 Americans
    • 27% fewer new admissions than last week

    Additionally, the U.S. reported:

    • 7,400 new COVID-19 deaths (2.2 for every 100,000 people)
    • 100% of new cases are Omicron-caused; 23% BA.2-caused (as of March 12)
    • An average of 100,000 vaccinations per day (per Bloomberg)

    National COVID-19 case numbers are still falling, as we reach two months since the peak of the Omicron surge. The U.S. reported about 30,000 new cases each day last week, according to the CDC; that’s the lowest this number has been since last summer.

    Hospitalization and death numbers are also still falling. The CDC reports that only 2,300 new COVID-19 patients were admitted to U.S. hospitals each day last week, compared to almost ten times that number at Omicron’s peak. Hospital systems in all 50 states and D.C. are currently labeled as “having capacity” on the Circuit Breaker Dashboard.

    While this is all good news, it’s unclear how long this lull in cases will last. BA.2, the Omicron sister strain, is slowly outcompeting the original variant thanks to its even-more-transmissible capabilities: it’s gone from causing about 2% of new COVID-19 cases nationwide in the week ending February 12 to causing 23% of new cases in the week ending March 12, according to CDC estimates.

    This strain is wreaking havoc in Asia and Europe, and U.S. experts are concerned that we may see a new surge in the coming weeks. Wastewater data may also suggest an oncoming surge, as a growing number of sewershed collection sites are reporting increases in their coronavirus levels. (More on this later in the issue.)

    At the state level, a few places are beginning to see case increases: Washington, D.C., New York, Kentucky, Rhode Island, and Illinois all reported modest increases this week, according to the March 17 Community Profile Report. D.C. had the highest case increase, 20% more cases than the previous week. Some of these locations were also the first to be hit in the Omicron surge last December.

    U.S. leaders should be taking advantage of this lull between surges to improve our preparedness: distribute masks and rapid tests, expand surveillance systems, and—most importantly—encourage people to get vaccinated so that they are protected when case rates rise again. Yet instead, Republicans in Congress are refusing to provide more public health funding, and the rate of Americans getting their first vaccine doses is lower than it has been since December 2020.

  • National numbers, March 13

    National numbers, March 13

    Wastewater surveillance in the U.S. shows that we are currently in a plateau. Chart from Biobot, retrieved March 12.

    In the past week (March 5 through 11), the U.S. reported about 260,000 new COVID-19 cases, according to the CDC. This amounts to:

    • An average of 37,000 new cases each day
    • 79 total new cases for every 100,000 Americans
    • 29% fewer new cases than last week (February 26-March 4)

    In the past week, the U.S. also reported about 22,000 new COVID-19 patients admitted to hospitals. This amounts to:

    • An average of 3,100 new admissions each day
    • 6.6 total admissions for every 100,000 Americans
    • 28% fewer new admissions than last week

    Additionally, the U.S. reported:

    • 8,200 new COVID-19 deaths (2.5 for every 100,000 people)
    • 100% of new cases are Omicron-caused; 12% BA.2-caused (as of March 5)
    • An average of 100,000 vaccinations per day (per Bloomberg)

    Note: I’m shifting the format of these National Numbers posts to focus more on hospitalizations and wastewater, as case data become both less reliable and less available in many parts of the U.S.

    Overall, new COVID-19 cases are continuing to fall across the U.S. The country reported about 37,000 new cases a day last week, according to the CDC, compared to ten times that number in early February.

    Case numbers have become less reliable lately as testing sites close and people are redirected to use at-home rapid tests, which are generally not reported. Still, we’re seeing a similar trend in new COVID-19 patients admitted to hospitals: both new cases and new admissions dropped almost 30% last week from the week prior.

    Additionally, wastewater levels are decreasing or plateauing across the country, according to the Biobot tracker, which compiles trends from over 90 locations. The CDC wastewater surveillance tracker is showing similar overall trends as well.

    More than 98% of the U.S. population now lives in a location with a low or medium COVID-19 Community Level, according to the CDC. But a few places did see case increases last week: these include Nebraska, Kentucky, Alaska, and Delaware, according to the March 10 Community Profile Report.

    BA.2, the Omicron sister variant that is even more transmissible than the original version of this strain, is slowly gaining ground in the U.S.: it’s gone from causing an estimated 1% of cases in the first week of February to 12% in the first week of March, according to the CDC’s modeling.

    It hasn’t impacted case trends here yet, but deserves close attention in the coming weeks and months. Gothamist has a helpful article about BA.2’s potential impact in New York, where the variant’s prevalence in wastewater is doubling statewide every two weeks.

    Meanwhile, several European countries—including the U.K., Germany, the Netherlands, and others—reported case increases this week. This is likely due to ending pandemic safety measures, Omicron gaining its second wind, or some combination of the two; regardless, it doesn’t bode well for the U.S., which is also ending pretty much all pandemic safety measures.

  • National numbers, March 6

    National numbers, March 6

    About 90% of the U.S. population now lives in a medium- or low-level COVID-19 “Community Level,” according to the CDC.

    In the past week (February 26 through March 4), the U.S. reported about 371,000 new COVID-19 cases, according to the CDC. This amounts to:

    • An average of 53,000 new cases each day
    • 113 total new cases for every 100,000 Americans
    • 29% fewer new cases than last week (February 19-25)

    Last week, America also saw:

    • 30,000 new COVID-19 patients admitted to hospitals (9 for every 100,000 people)
    • 11,000 new COVID-19 deaths (3.3 for every 100,000 people)
    • 100% of new cases are Omicron-caused (as of February 26)
    • An average of 140,000 vaccinations per day (per Bloomberg)

    New COVID-19 cases continue falling in the U.S. as the Omicron wave fizzles out. This week, the CDC reported an average of 53,000 new cases a day—less than one-tenth the cases reported at the peak of this surge.

    Hospitalization metrics also continue falling. About 30,000 new COVID-19 patients were admitted to U.S. hospitals this week, compared to almost 150,000 at the peak of the surge. According to the Hospital Circuit Breaker dashboard, only two states are currently at or over hospital capacity: Nebraska and Vermont.

    We’re now in the second week of the CDC’s new “Community Level” guidance for safety precautions tied to regional COVID-19 metrics. As of this week, “more than 90% of the U.S. population is in a location with low or medium COVID-19 Community Level,” according to the agency.

    Of course, the agency’s old guidance—still available on its COVID-19 dashboard—is less generous. According to these metrics, almost half of the country is still seeing “high community transmission,” with more than 100 new cases per 100,000 people in the last week. Remember, even though case numbers are much lower now than they were in early January, the Omicron surge warped our whole sense of COVID-19 proportion.

    Meanwhile, some parts of the country where Omicron arrived and peaked earlier are now in distinct plateaus. This includes Washington, D.C. and New York City; in NYC, case rates have actually started ticking back up very slightly in the last week.

    I personally trust NYC case numbers more than that metric in other places because the city still has widely available public testing. But as other cities and states close testing sites and redirect people to at-home tests, case numbers will continue becoming less reliable over the coming weeks. So, I am thinking about shifting these national updates to focus more on other metrics, like hospitalizations and wastewater.

    Readers, what do you think? Any recommendations for metrics you’d like to read more about here? Comment below or email me and let me know.

  • National Numbers, March 28

    National Numbers, March 28

    In the past week (March 20 through 26), the U.S. reported about 399,000 new cases, according to the CDC. This amounts to:

    • An average of 57,000 new cases each day
    • 122 total new cases for every 100,000 Americans
    • 1 in 823 Americans getting diagnosed with COVID-19 in the past week
    • 27,000 more new cases than last week (March 13-19)
    Nationwide COVID-19 metrics as of March 26, sourcing data from the CDC and HHS. Posted on Twitter by Conor Kelly.

    Last week, America also saw:

    • 33,000 new COVID-19 patients admitted to hospitals (10.1 for every 100,000 people)
    • 6,600 new COVID-19 deaths (2.0 for every 100,000 people)
    • An average of 2.6 million vaccinations per day (per Bloomberg)

    After several weeks of declines, our national count of new cases has started creeping up: the current 7-day average is 57,000, after 53,000 last week and 55,000 the week before. Michigan continues to see concerning numbers, as do New York, New Jersey, Florida, Texas, and California—all states with higher counts of reported variant cases.

    Last week, I described America’s present situation as a race between vaccines and variants. As of Thursday, we have 8,300 reported B.1.1.7 cases—up from about 5,000 last week, and likely still a significant undercount. The variant-driven surge that some experts warned may come in late March may now be starting.

    Still, the pace of vaccinations continues to pick up. We hit more vaccination records this week: 3.4 million doses were reported on Friday, and 3.5 million were reported yesterday. Over 50 million Americans have now been fully vaccinated, according to White House COVID-19 Data Director Cyrus Shahpar.

    President Biden set a new goal for his first 100 days in office: 200 million vaccinations, double the 100-million goal that we hit last week. At the nation’s current pace (about 2.6 million doses administered each day), we are well on track to meet that milestone.

    43 states have announced that they’ll open up vaccine eligibility to all adults on or before Biden’s May 1 deadline, as of Friday—though opening up wider eligibility can sometimes mean that vaccine access for vulnerable populations becomes even more challenging. A recent data release from the CDC makes it easier for us to analyze vaccinations at a more local level; more on that later in the issue.

  • National Numbers, March 21

    National Numbers, March 21

    In the past week (March 13 through 19), the U.S. reported about 372,000 new cases, according to the CDC. This amounts to:

    • An average of 53,000 new cases each day
    • 113 total new cases for every 100,000 Americans
    • 1 in 881 Americans getting diagnosed with COVID-19 in the past week
    • Only 10,000 fewer new cases than last week (March 6-12)
    Nationwide COVID-19 metrics as of March 19, sourcing data from the CDC and HHS. Posted on Twitter by Conor Kelly.

    Last week, America also saw:

    • 32,900 new COVID-19 patients admitted to hospitals (10 for every 100,000 people)
    • 7,200 new COVID-19 deaths (2.2 for every 100,000 people)
    • An average of 2.3 million vaccinations per day (per Bloomberg)

    Three months into his presidency, Joe Biden has already met one of his biggest goals: 100 million vaccinations in 100 days. This includes 79 million people who have received at least one dose, and 43 million who are now fully vaccinated. Two-thirds of Americans age 65 and older have received at least their first dose.

    Our current phase of the pandemic may be described as a race between vaccinations and the spread of variants. Right now, it’s not clear who’s winning. Despite our current vaccination pace, the U.S. reported only 10,000 fewer new cases this week than in the week prior—and rates in some states are rising.

    Michigan is one particular area of concern: COVID Tracking Project data watchers devoted an analysis post to the state this week, writing, “the Detroit area now ranks fourth for percent change in COVID-19 hospital admissions from previous week—and first in increasing cases and test positivity.” Hospitalization rates in New York and New Jersey are also in a plateau.

    These concerning patterns may be tied to coronavirus variants. Michigan has the second-highest reported count of B.1.1.7 cases, after Florida, and New York City is currently facing its own variant. The CDC’s national B.1.1.7 count passed 5,000 this week—more than double the count from late February.

    As genomic surveillance in the U.S. improves, the picture we can paint of our variant prevalence becomes increasingly concerning. But that picture is still fuzzy—more on that later in this issue.