Tag: January data

  • National numbers, January 29

    National numbers, January 29

    Biobot’s regional data suggest that most of the country is seeing declining COVID-19 spread, but we’re heading into high plateaus.

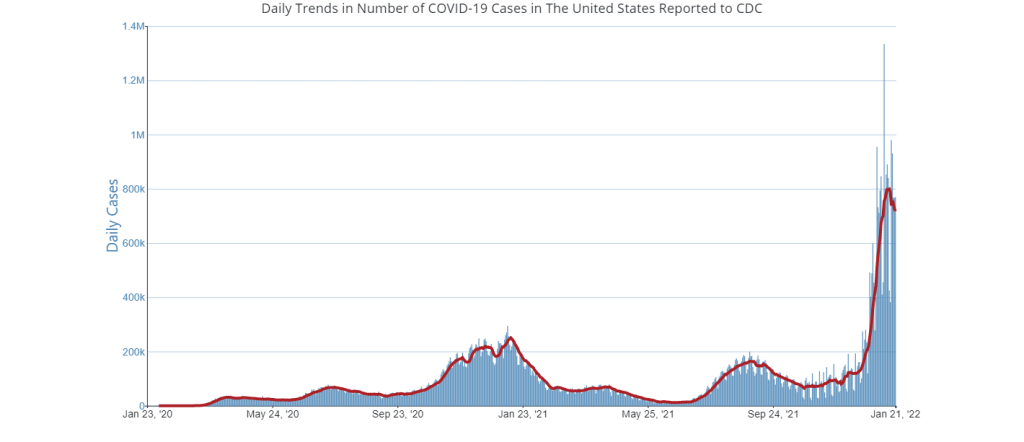
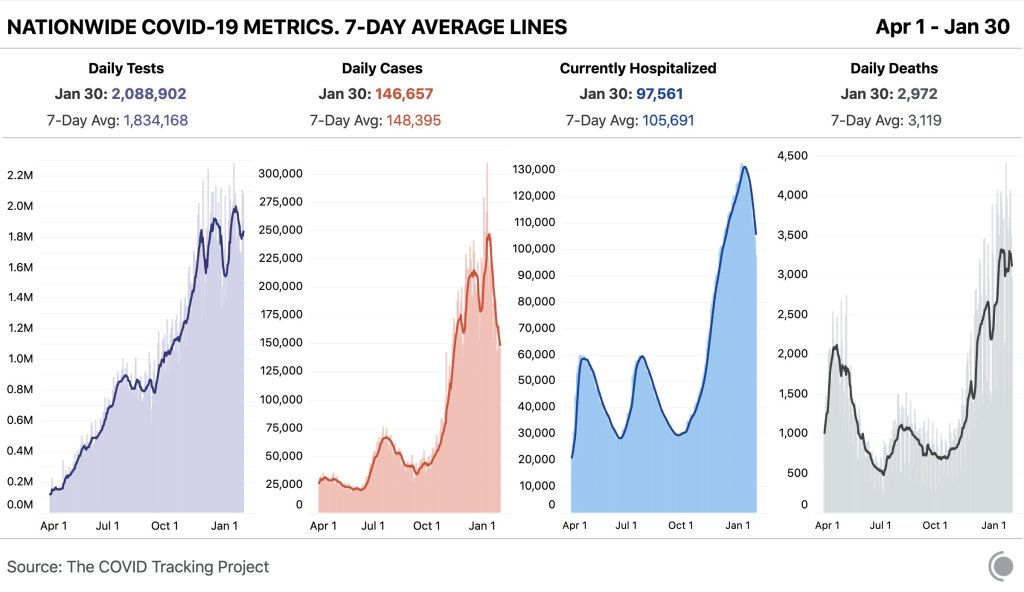
    In the past week (January 19 through 25), the U.S. officially reported about 300,000 new COVID-19 cases, according to the CDC. This amounts to:

    • An average of 42,000 new cases each day
    • 90 total new cases for every 100,000 Americans
    • 11% fewer new cases than last week (January 12-18)

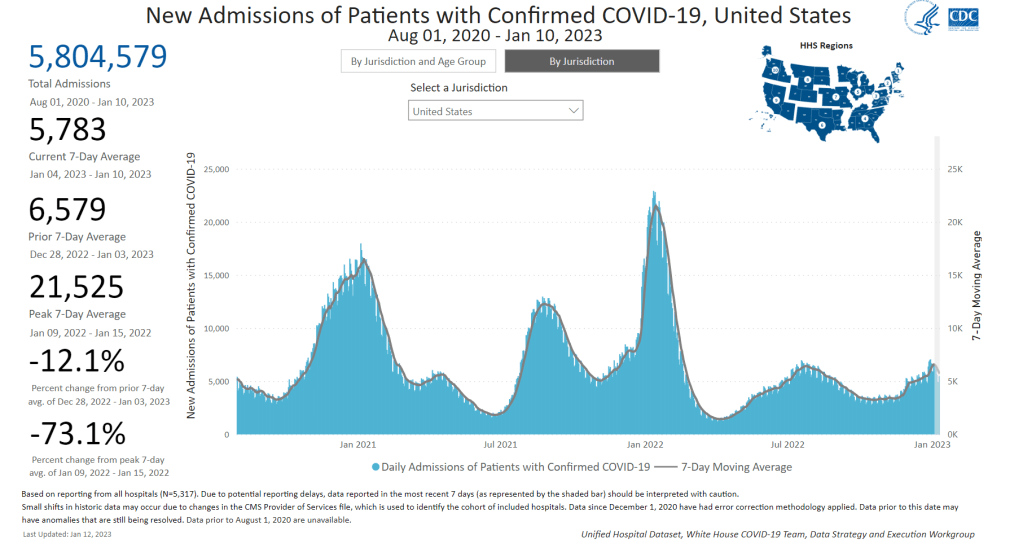
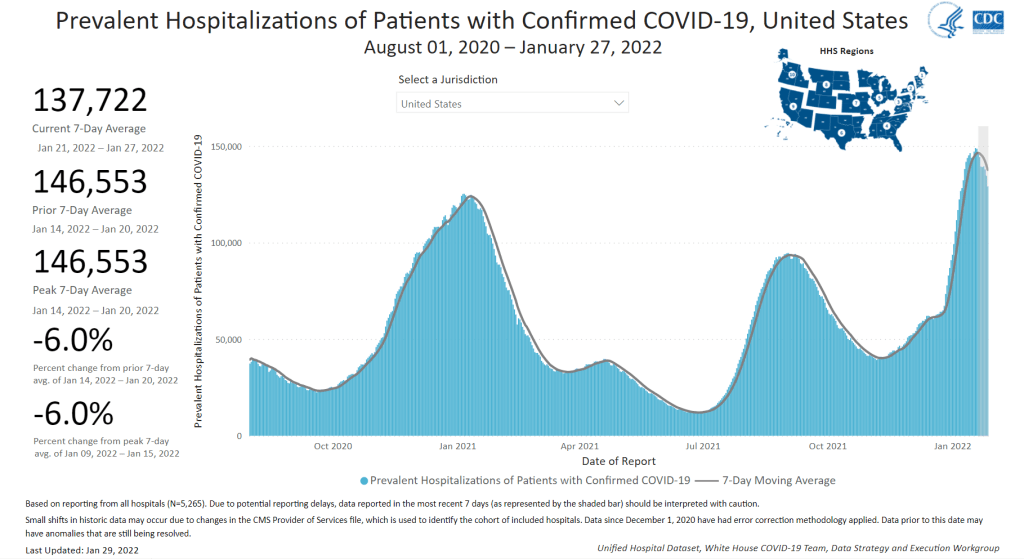
    In the past week, the U.S. also reported about 30,000 new COVID-19 patients admitted to hospitals. This amounts to:

    • An average of 4,200 new admissions each day
    • 9.0 total admissions for every 100,000 Americans
    • 14% fewer new admissions than last week

    Additionally, the U.S. reported:

    • 3,800 new COVID-19 deaths (540 per day)
    • 61% of new cases are caused by Omicron XBB.1.5; 31% by BQ.1 and BQ.1.1; 2% by CH.1.1 (as of January 28)
    • An average of 100,000 vaccinations per day

    At the national level, COVID-19 spread appears to be approaching another plateau. New cases and hospitalizations (as reported by the CDC) are still in decline, but their descent is slowing: reported cases dropped by 11% this week, compared to 24% last week.

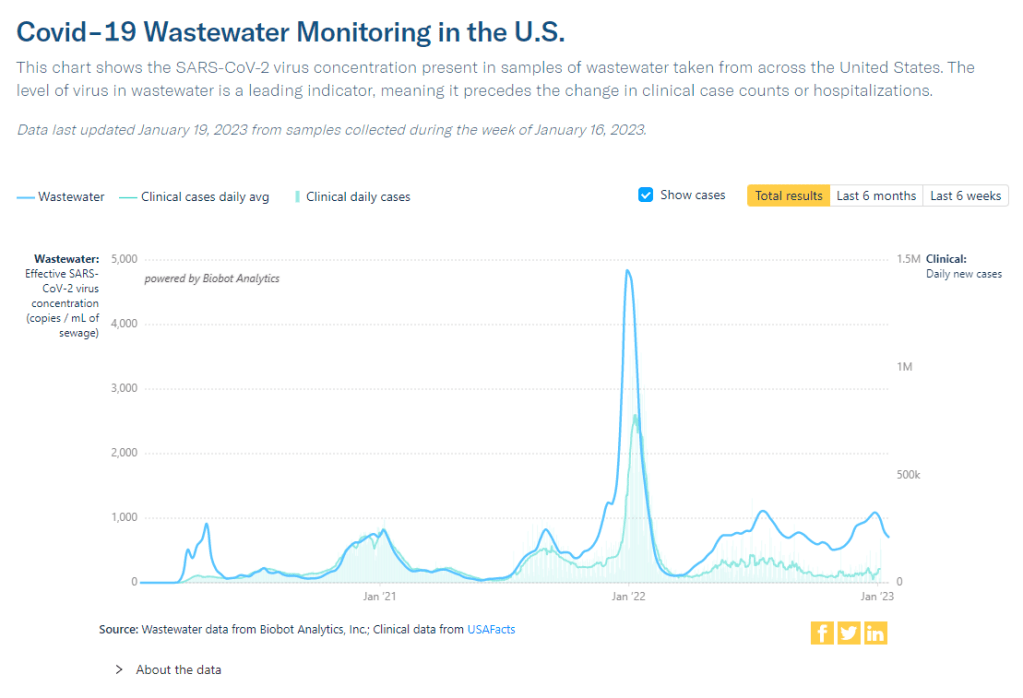
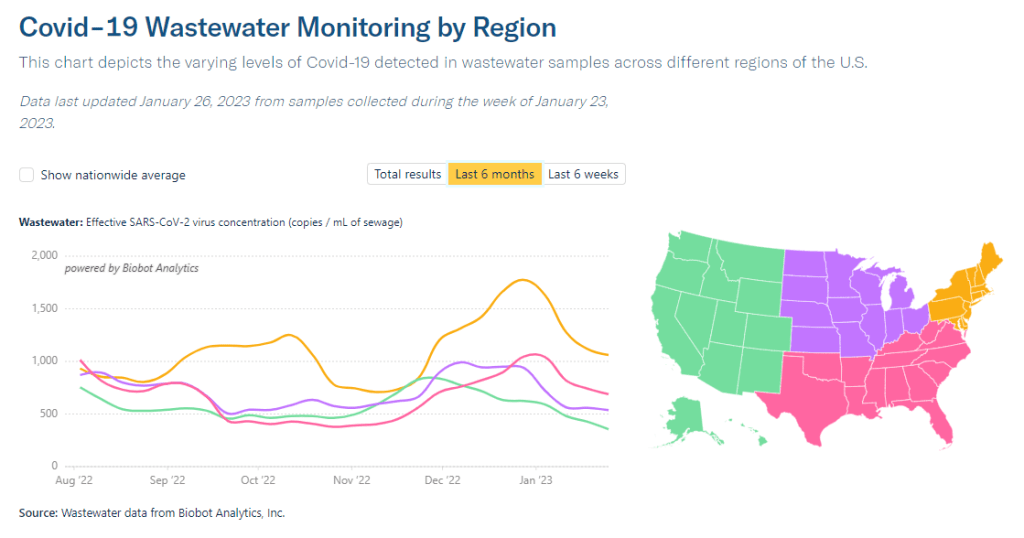
    Wastewater surveillance presents the same trends. National data from Biobot suggest that COVID-19 transmission is leveling out in a similar place to where we were in October and November 2022, before the holiday surge drove up spread.

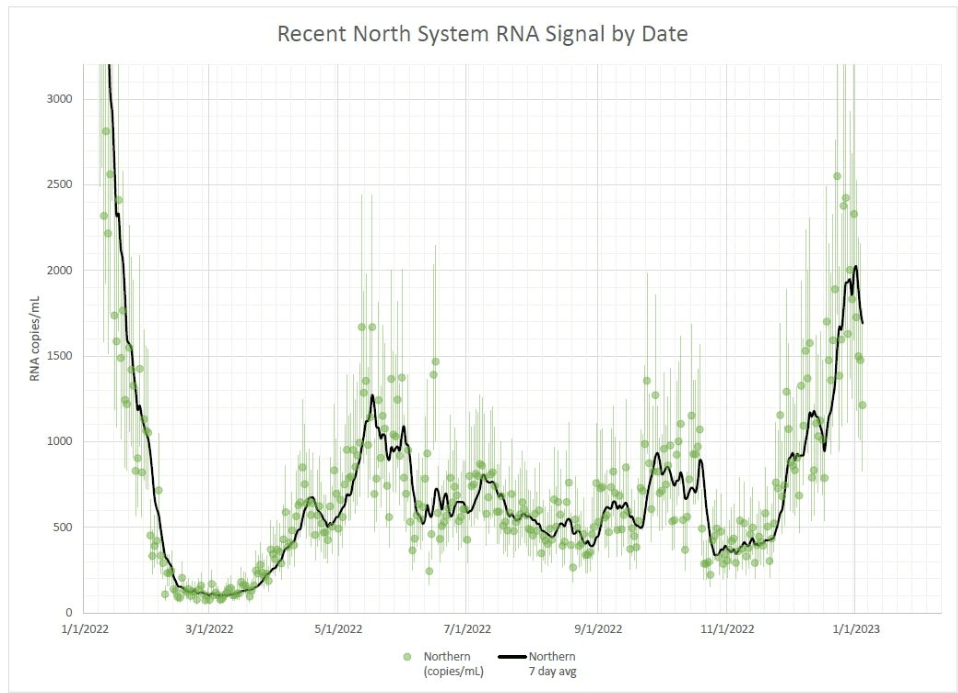
    Biobot’s regional data show a slowing decline in the Northeast, plateaus in the Midwest and South, and a somewhat-more-pronounced decline in the West. And wastewater surveillance data from the CDC shows that COVID-19 spread is going up in some places, down in others: out of about 1,000 sites reporting data in the last two weeks, 48% reported decreases in coronavirus levels while 40% reported increases.

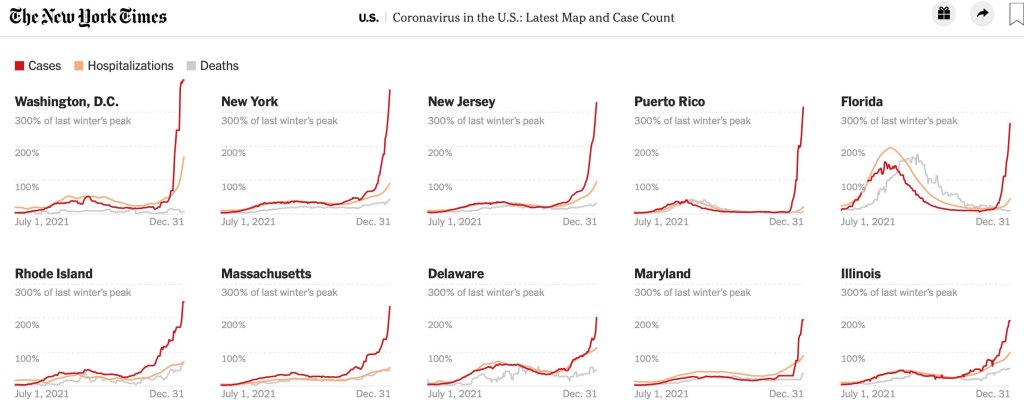
    Unlike in recent weeks where every state has reported declines in COVID-19 cases and hospitalizations, a few places are now reporting definitive upticks, according to the latest Community Profile Report. These states include Alaska, Vermont, Maine, South Dakota, North Dakota, Nevada, Oklahoma, Minnesota, and Indiana.

    Why might some states report COVID-19 upticks just after we emerged from a surge over the holidays? One explanation could be the XBB.1.5 variant, which continues to outcompete other Omicron lineages. XBB.1.5 now comprises about 60% of new cases nationwide (according to the CDC’s estimates); while it is most dominant in the Northeast, it’s growing—and likely reinfecting people—in other regions.

    The CDC’s latest variant estimates also now include Omicron CH.1.1, which has been connected to rising cases in the U.K. and New Zealand in recent months. Per the CDC, CH.1.1 has been present in the U.S. at low levels (like, 1% or less) for a few weeks now, without posing a major challenge to XBB.1.5. But it is still a variant worth keeping an eye on.

    As flu and RSV cases continue to trend down, the U.S. is confronted with the final weeks of a respiratory disease-heavy winter that was pretty rough on our healthcare system—but fell short of the mind-boggling case numbers that we saw in the prior two winters. Yes, we didn’t see a repeat of “the first Omicron wave”; but still, millions of people got sick, thousands died. Many will likely experience Long COVID as a consequence of their infections this winter.

    Is this an acceptable baseline for future winters? Or should we do better? (This recent article in The Atlantic by Katherine Wu expands on the problem of expectations, and makes a case for doing better.)

  • National numbers, January 22

    National numbers, January 22

    While COVID-19 spread has dropped in recent weeks, according to Biobot’s wastewater surveillance, it is still at much higher levels than it’s been earlier in the pandemic.

    In the past week (January 12 through 18), the U.S. officially reported about 330,000 new COVID-19 cases, according to the CDC. This amounts to:

    • An average of 47,000 new cases each day
    • 101 total new cases for every 100,000 Americans
    • 24% fewer new cases than last week (January 5-11)

    In the past week, the U.S. also reported about 35,000 new COVID-19 patients admitted to hospitals. This amounts to:

    • An average of 5,000 new admissions each day
    • 10.7 total admissions for every 100,000 Americans
    • 16% fewer new admissions than last week

    Additionally, the U.S. reported:

    • 4,000 new COVID-19 deaths (560 per day)
    • 49% of new cases are caused by Omicron XBB.1.5; 40% by BQ.1 and BQ.1.1 (as of January 21)
    • An average of 150,000 vaccinations per day (CDC link)

    National COVID-19 metrics continue to suggest that the U.S. is coming out of its holiday surge, though some parts of the country may face increased transmission as the Omicron variant XBB.1.5 spreads.

    Official COVID-19 case numbers and new hospital admissions both reported declines this week, according to the CDC (of 24% and 16% respectively, compared to the prior week). Biobot’s wastewater surveillance data also show a decline, with coronavirus concentration at a similar level to mid-November 2022, just before Thanksgiving.

    This trend is fairly consistent across states and regions, according to case and hospitalization data from the latest HHS Community Profile Report. However, Biobot’s regional and county-level data suggest that COVID-19 spread is in a plateau or even starting to increase in some parts of the South and Midwest regions.

    Hospitalizations for the flu and RSV are following a similar pattern to COVID-19, according to a new CDC dashboard that reports on all three illnesses together. Almost all states reported moderate or low levels of influenza-like activity in the week ending January 14, very different from the patterns we were seeing a few weeks ago. The only areas still reporting high influenza-like activity are California, North Dakota, New Mexico, Texas, Puerto Rico, New York City, and Washington D.C.

    All of this is good news, suggesting that the worst of this winter’s respiratory virus surges may be behind us. But COVID-19 is still spreading across the country at fairly high levels, reflecting the high baseline that the U.S. has faced ever since new Omicron subvariants started to hit in spring 2022.

    We also need to continue watching XBB.1.5, the latest and most contagious version of Omicron. This subvariant caused about half of new cases in the U.S. in the last week, according to CDC estimates. It’s most prevalent in the Northeast but is quickly gaining ground in the Southeast and other regions. (And the BQ lineages that currently dominate these regions can spread quickly, too.)

    In the coming weeks, we’ll see how much XBB.1.5 (and any other variants) contribute to increased transmission in these regions. Meanwhile, COVID-19 deaths went up recently as the holiday surge took its toll: more than 500 people have died from COVID-19 every day in the last two weeks. Deaths are always the most delayed—and the most tragic—metric.

  • National numbers, January 15

    National numbers, January 15

    New hospital admissions for COVID-19 are starting to trend down, according to the CDC, though we’ll need more data to see if this trend persists.

    In the past week (January 5 through 11), the U.S. officially reported about 420,000 new COVID-19 cases, according to the CDC. This amounts to:

    • An average of 59,000 new cases each day
    • 126 total new cases for every 100,000 Americans
    • 13% fewer new cases than last week (December 29-January 4)

    In the past week, the U.S. also reported about 40,000 new COVID-19 patients admitted to hospitals. This amounts to:

    • An average of 5,800 new admissions each day
    • 12.3 total admissions for every 100,000 Americans
    • 12% fewer new admissions than last week

    Additionally, the U.S. reported:

    • 3,900 new COVID-19 deaths (560 per day)
    • 43% of new cases are caused by Omicron XBB.1.5; 45% by BQ.1 and BQ.1.1 (as of January 14)
    • An average of 150,000 vaccinations per day (CDC link)

    Last week, I wrote that a combination of holiday travel/gatherings and the latest Omicron subvariant, XBB.1.5, was driving a winter surge. This week, COVID-19 metrics suggest that the surge may have peaked, though we’ll need more data to say for sure—and XBB.1.5 remains a concern.

    After reporting a significant increase in coronavirus levels through the end of December, Biobot’s wastewater dashboard is now showing downturns nationally and for all four U.S. regions. The CDC’s wastewater dashboard similarly shows that about two-thirds of sites in the National Wastewater Surveillance System have reported decreasing COVID-19 levels in the last two weeks, as of January 10.

    “Importantly, this data is subject to change as we update 2x weekly,” Biobot’s Twitter shared on Thursday, when the company’s dashboard was most recently updated. “Stay tuned for Tuesday’s update.”

    Official COVID-19 cases and hospital admissions are also trending down, according to CDC data: new cases dropped by 13% from the week ending January 4 to the week ending January 11, while newly hospitalized patients dropped by 12%. But this trend isn’t universal; five states and Washington D.C. reported increased hospitalizations this week, with the biggest upticks in Rhode Island, Louisiana, and Maine.

    XBB.1.5, the latest and most contagious Omicron subvariant, caused an estimated 43% of new cases nationwide in the week ending January 14, per the CDC. It’s clearly outcompeting BQ.1 and BQ.1.1 as well as a number of other strains in the “Omicron soup” we currently face, but is not taking over as quickly as we saw the original Omicron do in late 2021.

    This strain continues to dominate the Northeast—particularly New England and New York/New Jersey—where COVID-19 spread is trending down. But it’s just starting to pick up in other parts of the country; to me, it seems likely that the Northeast had a holidays-and-XBB.1.5 combined surge, while other areas may face a second COVID-19 increase as this variant spreads more widely.

    Meanwhile, other respiratory viruses continue to place additional burden on our health system. For example, the CDC recently released estimates about this year’s flu season, finding that the flu may have caused up to 560,000 hospitalizations and 48,000 deaths since fall 2022.

  • National numbers, January 8

    National numbers, January 8

    Wastewater surveillance in Boston suggests COVID-19 transmission has reached levels not seen since last winter.

    In the past week (December 29 through January 4), the U.S. officially reported about 470,000 new COVID-19 cases, according to the CDC. This amounts to:

    • An average of 67,000 new cases each day
    • 143 total new cases for every 100,000 Americans
    • 16% more new cases than last week (December 22-28)

    In the past week, the U.S. also reported about 46,000 new COVID-19 patients admitted to hospitals. This amounts to:

    • An average of 6,500 new admissions each day
    • 13.9 total admissions for every 100,000 Americans
    • 16% more new admissions than last week

    Additionally, the U.S. reported:

    • 2,700 new COVID-19 deaths (390 per day)
    • 28% of new cases are caused by Omicron XBB.1.5; 56% by BQ.1 and BQ.1.1; 5% by XBB (as of January 7)
    • An average of 150,000 vaccinations per day

    Well, here we are: the winter COVID-19 surge. It may have happened later than some experts predicted, but the U.S. is clearly now experiencing an uptick in virus transmission as the latest, most contagious Omicron subvariants collide with holiday travel and gatherings.

    You might notice that the CDC’s official case numbers didn’t rise too dramatically this week (though the national count is up 16% compared to last week). That’s unsurprising: case increases after holidays are always delayed, because many testing sites and public health officials take time off from processing new data. Christmas and New Year’s tend to deliver the worst of this trend—and in 2022, limited access to PCR testing made case numbers even less reliable.

    Wastewater surveillance, on the other hand, clearly shows a significant rise in coronavirus spread from early December through early January—building on another rise that followed Thanksgiving. Biobot’s dashboard suggests that the U.S. as a whole is seeing about as much COVID-19 transmission now as we saw at the peak of the summer BA.5 wave. In some places, transmission is the highest it’s been since last January (during the original Omicron surge.)

    The CDC’s wastewater data similarly show increasing COVID-19: out of 600 sites with available recent data, more than half were reporting upticks in the two-week period ending January 2. 117 of those sites reported an increase between 100% and 999%, and 87 reported an increase over 1,000%.

    Regionally, the Northeast has reported the biggest recent COVID-19 spike in wastewater, though the trend may already be turning around. We see this both in Biobot’s regional data and in individual cities and counties, like Boston and New York City. The Northeast is also a hotspot for XBB.1.5, a homegrown Omicron subvariant that’s spreading faster than other lineages. (More on that later in the issue.)

    In addition to the wastewater surveillance, hospitalization data have remained uninterrupted by the holidays with clear increases in COVID-19 patients through December and into this week. This week, about 6,600 new COVID-19 patients were admitted to hospitals nationwide, a 16% increase from the prior week and about twice the number of people admitted during the week before Thanksgiving.

    Washington D.C., Connecticut, Massachusetts, and West Virginia reported the highest rates of new COVID-19 patients in the week ending January 3, according to the latest Community Profile Report. They were followed by other Northeast states New Jersey, New York, and Delaware. But states reporting the highest increases in hospitalization are in the South: Louisiana, Mississippi, Florida, Texas.

    Two pieces of good news for this week: the flu and RSV are both trending down after their surges earlier in the fall. High levels of influenza-like activity remain in the majority of states, though. And we may see a second flu peak driven by a second strain, as Katelyn Jetelina reports in Your Local Epidemiologist.

    All the same safety measures we know and love—masks, testing, vaccinations, etc.—continue to help reduce the risk of COVID-19 and other viruses. But uptake of these measures remains low. As of January 5, only 15% of the eligible U.S. population has received an Omicron-specific booster dose, per the CDC.

  • National numbers, January 30

    National numbers, January 30

    COVID-19 hospitalizations are on the decline nationwide, though they have not yet dropped as steeply as cases. Chart via the CDC, retrieved January 29.

    In the past week (January 22 through 28), the U.S. reported about 4.2 million new cases, according to the CDC. This amounts to:

    • An average of 597,000 new cases each day
    • 1,273 total new cases for every 100,000 Americans
    • One in 79 Americans testing positive for COVID-19
    • 20% fewer new cases than last week (January 15-21)

    Last week, America also saw:

    • 135,000 new COVID-19 patients admitted to hospitals (41 for every 100,000 people)
    • 16,000 new COVID-19 deaths (4.9 for every 100,000 people)
    • 100% of new cases are Omicron-caused (as of January 22)
    • An average of 600,000 vaccinations per day (per Bloomberg)

    Last week, COVID-19 case numbers started to indicate that the U.S.’s Omicron surge was turning a corner; this week, cases are clearly on the decline. National new case reports have dropped by about 24% in the past two weeks, from 784,000 new cases a day in mid-January to 597,000 new cases a day last week.

    COVID-19 hospitalizations are also on the decline, though this metric is not dropping as steeply: the number of patients hospitalized with confirmed COVID-19 nationwide went from nearly 150,000 in mid-January to 138,000 this past week, according to the CDC.

    Deaths, meanwhile, are still increasing, as trends in deaths tend to lag behind trends in cases by several weeks. Over 2,000 Americans died of COVID-19 each day last week, and the country is on track to reach 900,000 total deaths in early February (in the official count, anyway—the true death toll is likely much higher).

    Cases have been dropping in Northeast hotspots like New York, New Jersey, D.C., Maryland, and Delaware for several weeks now. In New York City, for example, the number of new COVID-19 cases last week was one-ninth the cases reported during the city’s Omicron peak in early January—though the city and state overall are still at case levels far above the CDC threshold for high transmission.

    At the same time, cases continue to increase in some Western states, including Montana, Idaho, and Washington. The states with the highest COVID-19 case rates per capita right now are Alaska, Oklahoma, Kentucky, North Dakota, and California; all reported about 2,000 new cases per 100,000 residents in the last week, according to the latest Community Profile Report.

    The Omicron surge has inspired many Americans to get vaccinated. About 75% of the U.S. population has now received at least one vaccine dose, per the CDC, and more than 40% of those fully vaccinated have received a booster shot. But vaccines are still unavailable for the youngest Americans, contributing to a rise in pediatric cases: in the week ending January 20, a record 1.1 million COVID-19 cases were reported among children.

  • National numbers, January 23

    National numbers, January 23

    Has Omicron peaked in the U.S.? Nationally, it seems possible, but the situation is more complicated at the state and local level. Chart via the CDC, retrieved on January 23.

    In the past week (January 15 through 21), the U.S. reported about 5.2 million new cases, according to the CDC. This amounts to:

    • An average of 745,000 new cases each day
    • 1,588 total new cases for every 100,000 Americans
    • One in 63 Americans testing positive for COVID-19
    • 5% fewer new cases than last week (January 8-14)

    Last week, America also saw:

    • 147,000 new COVID-19 patients admitted to hospitals (45 for every 100,000 people)
    • 12,200 new COVID-19 deaths (3.7 for every 100,000 people)
    • 100% of new cases are Omicron-caused (as of January 15)
    • An average of 300,000 vaccinations per day (per Bloomberg)

    Has Omicron peaked in the U.S.? Looking at the national data, you might think so: new COVID-19 cases in the U.S. have dropped 5% from 5.5 million last week to 5.2 million this past week. While those numbers are astronomically high compared to past pandemic waves, it’s encouraging to think that they might not get higher.

    Hospitalization data also seem to have reached a peak; while about 150,000 Americans are currently hospitalized with COVID-19, according to the HHS, this number is no longer rapidly increasing. Patient numbers are starting to decline in the states and cities that were first hit by Omicron.

    It’s too soon to say that we’re actually coming down on the other side of the Omicron curve, though. For one thing, as Dr. Katelyn Jetelina pointed out in a recent issue of Your Local Epidemiologist, holiday reporting and test capacity could be playing a role here.

    Last Monday was Martin Luther King Jr. Day, a federal holiday that many health agencies and test providers took off—though not a holiday on the reporting disruption level of Christmas or New Year’s. And tests are incredibly hard to find in some parts of the country, meaning that our current system simply isn’t catching a large number of COVID-19 cases. (Remember: most COVID-19 case counts do not include cases identified with at-home antigen tests.) In short, the current trend is encouraging, but we’ll have to see next week if it continues.

    While the national picture is hard to interpret, it’s clear that the Northeast states that dealt with Omicron first are now on the decline. In New York City, the case rate has been reduced by over a third, from 3,500 new cases per 100,000 in a week at the beginning of January to 1,000 new cases per 100,000 in the last week. Case rates are also going down in New Jersey, Maryland, D.C., Connecticut, and Massachusetts.

    At the same time, other parts of the country are still in the first half of their Omicron surges. Cases rose by over 40% from last week to this week in Wisconsin, Wyoming, Oklahoma, Idaho, Ohio, and New Mexico, according to the latest Community Profile Report. In fact, Wisconsin now has one of the highest per capita case rates in the country, at 2,800 new cases per 100,000 in the week ending January 19.

    A recent NBC News article explains that the urban regions first exposed to Omicron have higher vaccination rates and more available hospital beds, making them more prepared to weather the variant. But now, Omicron is beginning to reach rural parts of the country that are less vaccinated, less capable of taking on patients, and still reeling from Delta. For these communities, the next few weeks are bound to be rough.

  • National numbers, January 16

    National numbers, January 16

    The entire country has extremely high COVID-19 transmission right now. Chart via the January 13 Community Profile Report.

    In the past week (January 8 through 14), the U.S. reported about 5.5 million new cases, according to the CDC. This amounts to:

    • An average of 783,000 new cases each day
    • 1,669 total new cases for every 100,000 Americans
    • One in 60 Americans testing positive for COVID-19
    • 33% more new cases than last week (January 1-7)

    Last week, America also saw:

    • 144,000 new COVID-19 patients admitted to hospitals (44 for every 100,000 people)
    • 12,100 new COVID-19 deaths (3.7 for every 100,000 people)
    • 98% of new cases are Omicron-caused (as of January 8)
    • An average of 1.3 million vaccinations per day (per Bloomberg)

    The U.S. once again broke COVID-19 records this week, reporting about 5.5 million new cases in total. Last winter, the highest number of cases reported in a single week was about 1.7 million; this past week, the country reported over one million cases just on Monday (though that number included backlogs from the prior weekend).

    Last week, I wrote that one in eighty Americans had tested positive for COVID-19. This past week, that number is one in sixty—again, not including people who tested positive on rapid, at-home tests.

    The U.S. also broke last winter’s hospitalization record this week: 157,000 patients are now hospitalized with COVID-19 across the country, according to the Department of Health and Human Services (HHS). Last winter’s record was about 125,000. But this number doesn’t capture the dire situations in ICUs, staff shortages, and other issues that hospitals are facing right now. (More on that later in the issue.)

    Northeast states continue to report the highest case numbers: Rhode Island, New York, Massachusetts, New Jersey, Delaware, and Florida all reported over 2,000 new cases for every 100,000 people in the week ending January 12, according to the latest Community Profile Report. Some of the earliest Omicron hotspots appear to have peaked; in New York City, for example, the weekly case rate is back under 2,000 new cases per 100,000 in the week ending January 11, down from a height of 3,500 new cases per 100,000 on January 3.

    But talking about specific state hotspots obscures from the fact that every single state is seeing insane COVID-19 numbers right now. Only four states reported fewer than 1,000 new cases per 100,000 last week—Wyoming, Montana, Idaho, and Maine—but their cases are climbing fast. Remember, the CDC threshold for high transmission is 100 new cases per 100,000.

    Speaking of hotspots: I have a new story in FiveThirtyEight this week, explaining that the most important Omicron hotspots actually can’t be seen on case maps. Right now, we need to identify outbreaks among the people most vulnerable to severe disease and those most capable of shutting down society; but the deluge of cases right now makes it hard to see and protect those people.

    Here’s the kicker of the piece:

    Still, the toolkit for addressing omicron hot spots is the same as it has been throughout the pandemic, said [Julia Raifman, a professor of health law, policy and management at the Boston University School of Public Health]. New federal requirements for vaccinations, masks, testing and ventilation would help protect the people most vulnerable to severe symptoms while also reducing case numbers in settings that can shut down society.

    “Federal guidance on mask mandates tomorrow would likely reduce deaths by tens of thousands,” Raifman said. “The perfect doesn’t need to be the enemy of the good, you don’t need every state to pass it. But you can put in place a mask policy during the surge, and it will reduce transmission and reduce the harms to health care workers and businesses.”

    In other words: When you can’t pinpoint specific hot spots, you need broad measures that can impact everyone. That strategy was made harder on Thursday, as an Occupational Safety and Health Administration rule that would have required around 80 million workers to get vaccinated or comply with regular testing was blocked by the Supreme Court. Without this rule, low-income workers will continue to face heightened risk of COVID-19 infection — and their cases will continue to ripple out.

  • National numbers, January 9

    National numbers, January 9

    The national average case rate for the U.S. is twelve times the CDC’s benchmark for “high transmission” (100 new cases per 100,000). Chart via the January 6 Community Profile Report.

    In the past week (January 1 through 7), the U.S. reported about 4.1 million new cases, according to the CDC*. This amounts to:

    • An average of 586,000 new cases each day
    • 1,251 total new cases for every 100,000 Americans
    • One in 80 Americans testing positive for COVID-19
    • 86% more new cases than last week (December 25-31)

    Last week, America also saw:

    • 115,000 new COVID-19 patients admitted to hospitals (35 for every 100,000 people)
    • 8,700 new COVID-19 deaths (2.7 for every 100,000 people)
    • 95% of new cases are Omicron-caused (as of January 1)
    • An average of one million vaccinations per day (including booster shots; per Bloomberg)

    *Here at the COVID-19 Data Dispatch, we’re back to our regular schedule of national updates based on Friday data, as the CDC has resumed weekly reports following its holiday hiatus.

    Omicron continues to drive record cases across the U.S., as we move from tense holiday gatherings to extremely fractured schools and workplaces. This week, the CDC reported 4.1 million new cases—almost double last week’s number, and about 2.5 times the case peak reported during last winter’s surge.

    Put another way: 4.1 million cases amounts to about one in eighty Americans testing positive for COVID-19 in the past week. And that number doesn’t include the vast majority of rapid, at-home tests that continue to be in high demand across the country.

    At the same time, hospitalizations are increasing rapidly, with over 100,000 current COVID-19 patients now reported by the CDC. We appear to be on track to pass last year’s peak, 124,000 COVID-19 patients in beds nationwide.

    I’ve seen a lot of discussion in recent days about hospitalizations “with” COVID-19 versus hospitalizations “for” COVID-19. As Omicron is less severe and more transmissible than other variants, the argument goes, aren’t a lot of those 100,000 COVID-19 patients people who have mild or asymptomatic cases, but tested positive for COVID-19 upon going to the hospital for a different condition?

    While it’s true that some COVID-19 patients in hospitals are “incidental,” meaning their cases were caught during routine hospital screening, these cases can still have a major impact on the hospital system. Healthcare workers need to separate these patients from non-COVID patients, take extra care with their PPE, and utilize other resources. Plus, a lot of patients that, at first, appear to “incidentally” have COVID-19 may see the disease worsen their chronic conditions, such as diabetes or COPD.

    To better understand the strain on hospitals right now, I recommend reading Ed Yong’s latest feature in The Atlantic—which gets into the “with” versus “for” issue, hospital staffing challenges, and other problems.

    When it comes to hotspots: the Northeast continues to see the highest case rates. New Jersey and New York are leading the pack, both with over 2,400 new cases for every 100,000 residents reported in the last week according to the latest Community Profile Report. (Reminder: the CDC threshold for “high transmission” is 100 new cases per 100,000, so New York and New Jersey are at 24 times the rate of this benchmark.)

    Rhode Island, Puerto Rico, D.C., Delaware, Massachusetts, and Florida also have incredibly high case rates, over 1,800 per 100,000 in the last week. Meanwhile, cases are rising rapidly in a number of other Southern and Western states: Texas, the Carolinas, Utah, Arkansas, California, Oregon, and Mississippi have all reported more than 150% case increases in the past week.

    If you are able to work from home and avoid public spaces as much as possible, now is the time to do so. January is going to be rough.

  • National numbers, January 2

    National numbers, January 2

    While COVID-19 case numbers in many parts of the country have shot past last winter’s records, hospitalizations and deaths have remained relatively low. Chart via the New York Times, shared on Twitter by Benjamin Ryan.

    In the past week (December 24 through 30), the U.S. reported about 2.2 million new cases, according to the CDC.* This amounts to:

    • An average of 316,000 new cases each day
    • 674 total new cases for every 100,000 Americans
    • 79% more new cases than last week (December 17-23)

    Last week, America also saw:

    • 71,000 new COVID-19 patients admitted to hospitals (22 for every 100,000 people)
    • 7,700 new COVID-19 deaths (2.4 for every 100,000 people)
    • 59% of new cases are Omicron-caused (as of December 25)
    • An average of 1.3 million vaccinations per day (including booster shots; per Bloomberg)

    *This week’s update, like last week’s, is based on Thursday data (as of December 30) because the CDC has once again taken Friday through Sunday off.

    It’s difficult to interpret COVID-19 data in the wake of any major holiday, as public health officials and testing sites alike take well-deserved time off. The weeks after Christmas are particularly tricky: the numbers are just starting to recover from one holiday when New Year’s hits, causing another round of delays. This year, the CDC took three-day weekends over both Christmas and New Year’s.

    All of that said, we have enough data to say that cases are rising incredibly fast across the U.S. The country reported over 300,000 new cases a day this week—the highest seven-day average of the entire pandemic so far. Over 500,000 new cases were reported on Friday alone.

    New York City continues to be a major Omicron hotspot. Last week, I wrote that one in every 100 New Yorkers had tested positive within a seven-day period, according to NYC data; this week, that number is one in 50. NYC’s positivity rate is over 25%, indicating that one in every four PCR tests conducted in the city is returning a positive result—but also indicating that the city is not testing enough to actually identify all cases. City data don’t include rapid at-home tests, contributing to the data gap here.

    NYC’s case rate seems to be slowing down, suggesting that the city may soon follow South Africa in seeing an intense, yet short Omicron surge. But “growth is still growth,” as analyst Conor Kelly points out:

    Meanwhile, plenty of other places in the U.S. are facing rapid growth from Omicron. In Florida, cases increased by almost 1,000% in the last two weeks of December—bringing the state from the lowest per-capita case rate in the country to the fourth-highest. Several other Southern states have also seen cases more than double in the last week: Georgia, Alabama, Louisiana, California, Mississippi, Washington, and Maryland, among others.

    There is some good news in this surge, though: while COVID-19 cases surge to record highs, hospitalizations remain much lower than they were at this point last year. The CDC currently reports about 67,000 COVID-19 patients in hospitals nationwide, compared to a peak of over 120,000 in January 2021. Omicron hotspots like NYC and DC are similarly reporting hospitalization numbers that, while rising sharply, are not following cases as closely as they did last year. 

    COVID-19 experts call this phenomenon “decoupling”: thanks to vaccinations, treatments, and (possibly) some inherent biological qualities of Omicron, hospitalization increases no longer directly follow case increases. Still, a smaller percentage of cases requiring hospitalization can still mean a lot of hospitalizations, when case numbers are as high as they are right now. And hospitals, already facing dire staffing shortages, were in crisis mode before Omicron hit.

  • National numbers, Jan. 31

    National numbers, Jan. 31

    In the past week (January 24 through 31), the U.S. reported about 1.0 million new cases, according to the COVID Tracking Project. This amounts to:

    • An average of 148,000 new cases each day
    • 317 total new cases for every 100,000 Americans
    • 1 in 316 Americans getting diagnosed with COVID-19 in the past week
    • 38% fewer new cases than we reported three weeks ago
    Nationwide COVID-19 metrics published in the COVID Tracking Project’s daily update on January 30. Current hospitalizations are under 100,000 for the first time in almost two months.

    Last week, America also saw:

    • 97,600 people now hospitalized with COVID-19 (30 for every 100,000 people)
    • 21,800 new COVID-19 deaths (6.7 for every 100,000 people)
    • An average of 1.35 million vaccinations per day (according to Bloomberg)

    The number of patients hospitalized with COVID-19 is under 100,000 for the first time since December 1. Still, this current number is about 60% higher than the peak number of patients hospitalized during either of the U.S.’s previous surges last spring and summer (60,000).

    In late 2020, COVID-19 became the leading cause of death in the U.S. It was the third-highest cause of death in that year overall. Already, in 2021, over 3,000 Americans have died of COVID-19 each day—making this disease a far higher burden than heart disease and cancer, typically the top two drivers of mortality.

    While new COVID-19 cases and hospitalizations continue to slow, continuing the trend from last week, new SARS-CoV-2 variants continue to give experts cause for concern. South Carolina’s public health department identified two cases of the B 1.351 variant first reported in South Africa; this variant is known to be more contagious and less susceptible to vaccines. Meanwhile, the B.1.1.7 variant (first reported in the U.K.) continues to spread—CDC officials are concerned that it could be the dominant strain here by the spring.

    And New York—which has already reported 42 B.1.1.7 cases—is planning to open indoor dining in February. I’m no public health expert, but I plan to be ordering takeout for a long time yet.