Tag: global public health

  • 25 million doses is a drop in the global vaccination bucket

    25 million doses is a drop in the global vaccination bucket

    The vaccination gap, based on IMF data. Posted on Twitter by Gavin Yamey.

    In the reader survey I sent out a few weeks ago, I asked, “What is one question you have about COVID-19 in the U.S. right now?” One reader responded with an inquiry into vaccine equity: “What will it look like when the U.S. is ‘open’ and vaccinated and many other parts of the world are not?”

    That question feels especially relevant this week. On Thursday, the Biden administration made a big (and long-awaited) announcement: the federal government is sending 25 million vaccine doses from America’s stockpile to other countries. The administration has previously promised to send at least 80 million doses abroad by the end of June, but this week’s announcement included more details—such as countries that will receive these initial doses and other logistics.

    Out of the 25 million, about 19 million doses are going to COVAX. COVAX, a global effort run by the World Health Organization and other international government bodies and philanthropic organizations, brings vaccines to low-income nations at no cost. The COVAX doses will go to India, other parts of Asia, Central and South America, and Africa, Bloomberg’s Josh Wingrove reports.

    The remaining 6 million doses will be sent directly to countries, including Ukraine, Kosovo, Haiti, Georgia, Egypt, Jordan and Iraq. Some doses are going directly to India as well—while the worst of this nation’s surge may be over, it’s still facing high case counts, full hospitals, and a terrifying “black fungus” linked with the Delta variant (B.1.617).

    At first glance, this might seem like a noble move on the Biden administration’s part. The U.S. is seeing low case numbers and widespread reopenings, so we can share some supplies to “help the pandemic around the globe,” as COVID-19 response coordinator Jeff Zients said at a briefing on Thursday.

    But 25 million doses—or even the 80 million doses that the administration has promised by the end of this month—is a drop in the bucket compared to actual international needs. For example: COVAX needs 1.8 billion doses to vaccinate about half the adult population in low-income countries. COVAX has specifically prioritized 92 low-income nations, representing a total population of 3.8 billion.

    That 1.8 billion dose number is a highlight of a major report released last week by the Rockefeller Foundation, a global charitable foundation, discussing what it would take to vaccinate the world. I covered the report for Science News. According to this report, Gavi (the Vaccine Alliance), an international public-private body that runs COVAX, needs to raise $9.3 billion in order to pay for those 1.8 billion doses. Gavi has been working to raise this money from countries and independent donors at a global health summit this past week.

    While $9.3 billion might seem like a massive price tag, the cost of failing to provide these vaccines would actually be far greater. The global economy may lose up to $9.2 trillion if richer nations fail to support equitable vaccine distribution, according to an estimate from the International Chamber of Commerce.

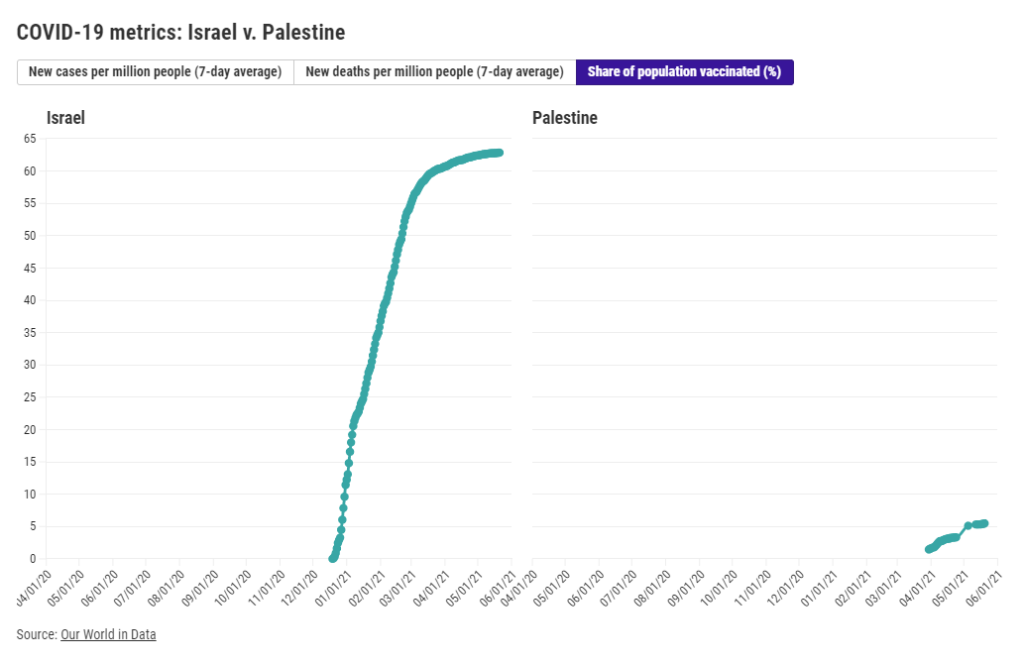
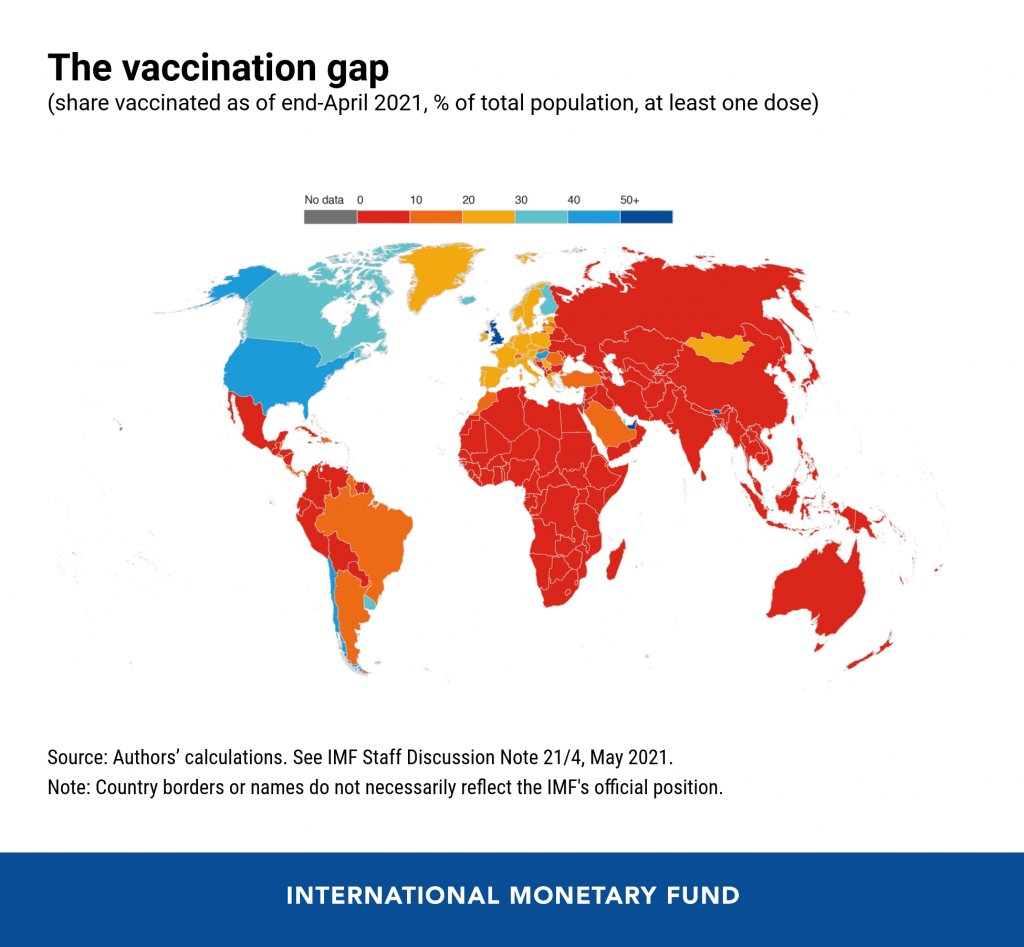
    So far, the U.S. has administered about 300 million vaccine doses (as of yesterday), covering over half the total population. In a number of low-income countries, less than one percent of the population has received a dose. Tedros Adhanom Ghebreyesus, Director General of the WHO, said at a recent assembly that, if all doses administered globally had been sent out equitably, the doses would have covered “all health workers and older people.” Instead, high-income nations are largely protected while low-income nations are vulnerable to future surges and highly-transmissible variants.

    Through this lens, the 25 million dose shipment announced this week is far from impressive. It’s a useful start, certainly, but it’s not going to end the pandemic anywhere. Even the 80 million doses promised by the end of June is a tiny number—about 4% of the doses COVAX is hoping to obtain. It’s also only 11% of the doses that vaccine makers have pledged to deliver to the U.S. by the end of July, according to Bloomberg.

    That larger June shipment has also been held up because the Biden administration is planning to send AstraZeneca vaccines—which are under review from the FDA because they were produced at the Emergent factory that infamously wasted millions of Johnson & Johnson doses. The AstraZeneca vaccine is not authorized for use in the U.S., so of course it will make up the majority of the doses we send abroad this summer.

    Speaking of unused doses: the Biden administration may also start sending unused doses from states to other countries, POLITICO reported this week. The administration wants to get thousands of Pfizer, Moderna, and J&J doses—on the verge of expiring—to countries that would actually use them. While this possible policy hasn’t yet been realized, it hammers home a clear message: the U.S. will donate “unwanted” vaccine doses only when we are absolutely certain that we don’t need them here.

    Now, let’s return to our reader’s question. What happens when the U.S. is safely vaccinated, but other parts of the world aren’t?

    From a health standpoint, the U.S. will probably be okay. The vaccines are very effective, even against variants—likely protecting the country from another major surge. We will need careful surveillance to guard against future variants that may evolve beyond the vaccines (see: last week’s issue), and it’s possible that overly zealous reopening this summer will lead to outbreaks next fall and winter. But seniors and other vulnerable people would be more protected than they have been in past surges, and booster shots (for the variants) will likely be on their way soon. In short, America’s wealth will protect us.

    Around the world, however, outbreaks will continue. Every time a new person gets infected with the coronavirus, the virus has a new opportunity to mutate. And with every mutation, the virus learns to spread faster, to evade common treatments, even to evade vaccines. Thanks to globalization, as long as the virus is a threat anywhere, it continues to be a threat everywhere.

    Plus, as low-income nations suffer from continued outbreaks, the global economy will continue to suffer. Out of that $9.2 trillion cost estimated by the International Chamber of Commerce, the majority will likely fall on wealthier nations (like the U.S.) that rely on other countries for products and labor.

    “The pandemic itself has gone beyond a health crisis — it has now gone into an economic crisis,” Christy Feig, the Rockefeller Foundation’s director of communications and advocacy, told me when I spoke to her for Science News. “The only way to unchoke the economy is by getting the vaccines to as many countries as possible, so that we can stop the spread of the disease before more variants come.”

    (P.S. If you’d like to read more on how the pandemic may end in the U.S. and elsewhere, I recommend this story by STAT’s Helen Branswell.)

    More international reporting

    • How violence in Israel and Palestine is impacting COVID-19 rates

      How violence in Israel and Palestine is impacting COVID-19 rates

      As many Americans who lived through wildfire season, hurricane season, or the Texas winter storm know well: it’s hard to protect yourself in a pandemic when you’re dealing with another simultaneous disaster.

      And it is especially hard to protect yourself when you live in a region that’s cut off from resources and medical expertise—as is the case for people in Gaza and other Palestinian territories.

      In the past couple of weeks, violence in this region has shut down hospitals and prevented vaccine deliveries. Unvaccinated people have crowded into shelters in Gaza, while all testing and vaccination efforts have stalled.

      Gaza has also lost critical medical leadership in the recent violence: two senior doctors at  Al-Shifa Hospital, the largest hospital in the Gaza Strip, were killed in recent Israeli airstrikes. An early-morning attack on the al-Wehda district last Sunday killed Dr. Ayman Abu al-Ouf, head of internal medicine at the hospital, and Dr. Mooein Ahmad al-Aloul, a psychiatric neurologist, along with at least 30 others.

      Al Jazeera reports that “medical personnel remain in short supply” throughout the Palestinian territories, leaving people to instead rely on international aid groups for medical care. And constant air raids have limited medical care even further. One Israeli attack blocked the main road leading to Al-Shifa hospital, for example, and a Doctors Without Borders clinic was hit last weekend.

      “People are not daring to visit health facilities. We are fearing this will have a major negative impact,” Sacha Bootsma, an official from the World Health Organization, told the New York Times.

      About 5% of Palestinians have been vaccinated as of May 20. Most of those doses have come from COVAX, the global vaccine alliance, and shipments have faced logistical challenges in getting to Gaza through an Israeli blockade. The United Nations released a statement in January calling on Israel to “ensure swift and equitable access to COVID-19 vaccines for the Palestinian people under occupation,” but Israeli leaders have denied this responsibility.

      Israel, meanwhile, is largely protected against a COVID-19 surge. The country has been a global leader in vaccinations; by the end of February, over half of the population had received at least one dose. Now, almost two-thirds of the population are vaccinated.

      Cases in Israel have remained at low levels throughout the violence in recent weeks thanks to the vaccines. The country has seen fewer than 20 new cases per million people a day since mid-April. Palestine, meanwhile, faced a surge during March and April, with the territories’ highest COVID-19 case numbers yet.

      While reported case numbers in Palestine have dropped in recent weeks, this is more likely due to a lack of testing than an actual drop in infections. And the situation is not improving. Though Israeli and Palestinian forces have now formally reached a cease-fire, Israeli police have continued to attack Palestinians—including an attack against worshippers at al-Aqsa Mosque.

      Continued violence and lack of medical care for Palestinians may mean that the pandemic continues here long after it ends for Israel. As is true of all COVID-19 outbreaks, continued transmission may breed coronavirus variants that threaten the rest of the world.

      More international reporting

      • The 2021 Tokyo Olympics begin on July 23. Will Japan be ready?

        The 2021 Tokyo Olympics begin on July 23. Will Japan be ready?

        Japan’s new COVID-19 cases per million, as of May 8. Chart via Our World in Data.

        They’re definitely not ready now. The Japanese government just announced it would extend an already-standing state of emergency through May 31 following a large spike in COVID-19 cases. After “Golden Week,” a sequence of Japanese Holidays lasting from late April to early May, Tokyo reported 907 new cases for the week. (New York City reported 985 cases just on May 7, for comparison.) A variant called N501Y has caused recent surges in cases, like in Osaka where hospitals struggled to treat the influx. N501Y is more infectious, and it has been correlated with more serious cases.

        This surge comes as Japan struggles to roll out vaccinations. According to Our World in Data, as of May 6, 2.44% of the country’s population has received at least one dose of the vaccine. (In the United States, around 57% of the population has received at least one dose as of May 8.) So far, Japan has only approved the Pfizer-BioNTech vaccine for use, though it may approve the Moderna and AstraZeneca vaccines by May 20. Pfizer has also announced that the company will donate vaccines to athletes and staff, and the International Olympic Committee has said, “It is expected that a significant proportion of Games participants will have been vaccinated before arriving in Japan.”

        An online campaign called Stop Tokyo Olympics has gained more than 200,000 signatures to an online petition, per Reuters. A Japanese poll in January showed that 80% of respondents said the games should be postponed or cancelled, and this trend has held true since.

        Japan has been extremely successful in controlling the pandemic so far, but that has also led to a lack in urgency in vaccinating the population, and again, surges have happened. The Olympics are very difficult to do in an NBA-like bubble. The scale of the Olympics is much larger, and with case counts across the world as high as they are, it’s hard to imagine that someone won’t come down with COVID-19 during the games. As the New York Times points out, the chances of a COVID-19 free Olympics are slim—instead, the priority will be controlling cases as they come up.

        Officials have repeatedly insisted that the games will go on as planned, and there is no sign that they will be cancelled or postponed. Will this current state of emergency crush the curve enough? We won’t know until July.

        More international data

        • In India’s COVID-19 catastrophe, figures are only part of the story

          In India’s COVID-19 catastrophe, figures are only part of the story

          By Payal Dhar

          India’s COVID-19 curve resembles a vertical line right now. An already fragile health infrastructure is on its knees, the government has shown itself to be incapable. There are no hospital beds to be had, no medicines, no oxygen, no emergency care; even the dead have to endure 20-hour queues for last rites. A nine-day streak of 300,000-plus new cases daily has ended with fresh infections crossing the 400,000 mark on May 1. More than 3,000 COVID-related deaths have been recorded daily for three consecutive days. Still, the worst, experts say, is yet to come.

          If one compares India’s cumulative figures with the U.S.’s, however, the numbers don’t seem to make sense. India’s 18.8 million confirmed cases, with 208,330 deaths, don’t seem anywhere near U.S. figures of 31.9 million and 568,836 respectively. India appears to record 1,360 cases and 15 deaths per 100,000 people, versus 9,684 cases and 172 deaths per 100,000 people in the U.S. Even accounting for the fact that India’s population (1.4 billion) is more than four times that of the U.S. (330 million), the scale of the devastation seen on the ground—patients three to a bed or being treated on the streets, people dying outside hospitals waiting for treatment, entire families being wiped out, and mass cremations taking place on pavements and car parks—appears disproportionate.

          The reasons are complicated and intersecting. For one, the official figures are highly likely to be vastly underestimated in India. Moreover, the country’s health infrastructure has always been fragile. There are only 5.3 beds per 10,000 population (versus 28.7 for the U.S.), and given the sheer numbers of COVID-19 infections, it’s simply a case of just-not-enough. Other reasons for the low numbers in India could, quite simply, be a lack of testing—only 1.74 daily tests per 1,000 people—as well as a purposeful obfuscation of actual figures.

          Experts say that COVID-19 deaths have been undercounted across the world for various reasons; testing methodologies and the recording of confirmed cases has not been uniform. “Every country reports those figures a little differently and, inevitably, misses undiagnosed infections and deaths,” Reuters’ COVID-19 Global Tracker states.

          It’s like looking at an iceberg, says one of India’s top epidemiologists, Dr. Jayaprakash Muliyil, chairperson of the Scientific Advisory Committee of the National Institute of Epidemiology, in a phone conversation. “The number of cases the system picks up is a fraction [of the actual number of infections],” he says. “A large number of cases are subclinical [not severe enough to present definite or readily observable symptoms].” This fraction depends on several factors—it is lower in smaller states with better infrastructure, like Pudducherry, and higher in others with greater population density, like Bihar.

          A recent study found a “severe under-ascertainment of COVID-19 cases” across U.S. states and countries worldwide. “In 25 out of the 50 countries, actual cumulative cases were estimated to be 5–20 times greater than the confirmed cases,” report authors Jungsik Noh and Gaudenz Danuser, adding that, “The estimation of the actual fraction of currently infected people is crucial for any definition of public health policies, which up to this point may have been misguided by the reliance on confirmed cases.”

          Serological surveys (using antibody tests) indicate that the actual number of infected people could be 30 times higher in India than what official figures show. COVID-related deaths could be anything between 2 to 5 times and 10 to 15 times than what is being reported.

          Modeling methods may be a headache, but pandemic curves always come down, and this one will too, says Dr. Muliyil. He is not a fan of lockdowns for a country like India—having said back in September that it had flattened the wrong curve, that of the economy. With newer mutations of the virus appearing to be more easily transmissible, he says that an infection rate of 70 to 75 percent might be required for herd immunity. Meanwhile, “natural protection to the virus is excellent.” He prescribes strategic vaccination—focusing on the 45-plus age group rather than younger people, and those who haven’t been infected— and “bring back the urge to mask up and avoid crowds.”


          Payal Dhar is a freelance journalist from India who writes on science, technology and society.

          Editor’s note: If you would like to contribute to help the situation in India, here are three recommendations from Payal:

          The COVID-19 Data Dispatch was able to compensate Payal for this piece thanks to the support of the COVID-19 Data Dispatch’s members. We hope to be able to feature more guest writers in the future—if you’d like to support this work, please consider a contribution.

        • Global.health has gone public—what’s actually in the database?

          Global.health has gone public—what’s actually in the database?

          Last week, we included Global.health in our featured sources section. The initiative aims to document 10 million plus cases in one source. Instead of just listing numbers of positive cases and deaths, they collect individual cases and gather information about said case. What was their age range? Gender? When did symptoms develop? The dataset has room for more than 40 variables aside from just “tested positive.” While there are lots of dashboards and tracking sources, none collect detailed data about (anonymized!) individual cases.

          Collecting data like this is critical for understanding how epidemics spread, and an open repository could help researchers determine what the actual infection rate is or divine more information about lasting immunity. The set has been available to researchers for a while, but now it’s been released to the public. It might seem strange to release it now as it looks like cases are finally sustainably declining, but we’re still going to have to track COVID-19 even as everyone gets vaccinated. As one of the founders, Samuel Scarpino says, “COVID-19 is gonna become rare. It will fall back into the milieu of things that cause respiratory illness. As a result, we’re going to need higher-fidelity systems that are capturing lots of information and informing rapid public health response, identifying new variants and capturing information on their spread.”

          Since the data are now public,let’s take a look at what’s possible with this source.

          The first thing I discovered is that, predictably, the full dataset is just too big for Excel to open. I recently switched computers and I’m pretty sure this file was the death knell for my old one. You’re gonna need to either stick with their website or use something like Python or R to really sink your teeth in. Even just the website slowed down my new computer a lot, so beware. Elderly computers should probably be spared.

          Still, the website is very well designed and easy to navigate. You can have your data two ways: as a table with, at time of writing, more than 200,000 pages, or as a map where you can click on the country or region you want to look at, which will then direct you to a much smaller table. (All roads lead to tables, but the map function does make it a lot easier to navigate.)

          The country map is fairly self-explanatory—a deeper shade of blue means more cases— but the regional map also just looks very cool:

          Regional map.

          You can of course zoom in to your region of choice. My one quibble with the display is that I wish you could rotate your field of view, as sometimes the region behind a particularly tall spike can literally be overshadowed and thus be a little harder to access.

          Going through every part of this giant resource would take days, so I’m going to be focusing on the United States data. Here’s what I got when I clicked on it on the map:

          U.S. map.

          It should be understood that this is a sample of the U.S. data (same presumably goes for data in other countries.) Because this is line-list data, it’s supposed to be very granular—recent travel history, when a case became symptomatic, and so on. Data at this level of detail just aren’t available or possible to get for every case in the country (and even less so for the rest of the world.) So that should be remembered when working with this dataset. It’s extremely comprehensive, but not all-encompassing. (That being said, it is strange that there are P.1 cases recorded, but no B.1.1.7, which is much more common here.)

          So how granular are the data? When you’re directed to the table for that country, the table on the website has columns for:

          • Case Identification Number
          • Confirmation date (I assume this is confirmation that yes, this person is infected)
          • “Admin 1, Admin 2, and Admin 3” (short for “administrative areas” – for example, for a U.S. patient, 1 would be country, 2 would be state, and 3 would be county)
          • Country
          • Latitude and longitude (I assume of the hospital or of the lab where the case was identified)
          • Age
          • Gender
          • Outcome
          • Hospitalization date/period
          • Symptom onset
          • URL for the source

          Which is indeed pretty granular! It should be noted, however, that there are a lot of blank spots in the database. It has the capacity to be extremely comprehensive, but don’t go in expecting every single line item to have every detail. I’m not sure if this is going to improve as records are updated, but I suppose we’ll see.

          What can you do with these data? I loaded the full dataset into R to mess around with the data a bit. The disclaimer here is that I am by no means an R wizard. Another fair warning is that R will take a hot second to load everything up, but when you load up the full dataset there are a ton more columns for more data categories, like preexisting conditions. (That one seems important, why is it not on the more accessible website?)

           I found that making some frequency tables was a good way to assess just how complete the data was for certain variables. Here’s a frequency table I made with the outcome values:

          Frequency table.

          The first thing I notice is just how many lines have a blank value for the outcome. (65% of them.) Again, a lot of these data are incomplete. The second thing is that there are a ton of synonyms for the same thing. A capitalization change will shunt a number to a completely different category, making it a little annoying to compile results, so you’ll have to tinker with it a little bit to make a clear graphic/graph/etc. The bar graph R spit out for this was unreadable because of all the categories.

          I tried another one for the gender demographics and the bar graph was actually readable this time. As expected, the percentage of lines with no data available was lower this time (19%) but still sizable.

          Bar graph showing gender availability.

          As I should have expected, I got a gigantic table when I tried it for ethnicity. But 75.49% of the lines were blank. 99.6568% were blank for occupation, which I was inspired to look at because occupational data are similarly barren for vaccination data as well. Somewhat predictably, and just as a check, cases by country had much fewer blank cells.Overall this is a really interesting resource, but there are a lot of blank spots that keep it from being the god of all datasets. I think asking any source to be 100% complete is a tall order given the circumstances, and this is still the only source out there of its kind and of its scale. I look forward to checking in again and seeing if those blank cells drop in number.

        • Featured sources, Jan. 31

          • COVID-19 Neuro Databank: The National Institutes of Health has started a new database to keep track of neurological symptoms associated with COVID-19. The database will be fully anonymized, and it’ll be accessible for scientists who want to better understand neurological complications with the disease. For more information, see this press release from the NIH.
          • Covid Performance Index: How do different countries rank in their management of the pandemic? This index, from think tank the Lowy Institute, attempts to answer that question by comparing infection rates, death rates, and testing for 98 countries with available data. New Zealand, Vietnam, and Taiwan are at the top of the list; the U.S. ranks #94.
          • COVAX Global Supply Forecast: Another global data source is this report from COVAX, an initiative from the World Health Organization and Gavi, the Coalition for Epidemic Preparedness. The report provides summaries of the global vaccine supply, including both existing contracts and those under negotiation.
          • OpenSky COVID-19 Flight Dataset: Martin Strohmeier, a computer scientist at Oxford University, and other collaborators have compiled a dataset of flight data related to the COVID-19 pandemic. According to a blog post published in late December, Strohmeier plans to update the dataset once a month.

        • Trust is key for a successful COVID-19 response

          Trust is key for a successful COVID-19 response

          The COVID-19 Data Dispatch largely focuses on U.S. news. This country’s response to the pandemic has been so chaotic and confusing that it is a full-time job just to keep up with major developments. But sometimes, to truly understand COVID-19 in America, we need a global perspective. More specifically: seeing how other nations have succeeded in mounting a robust public health response—with actual support from the public—can show us how we have failed.  

          I got the opportunity to gain that perspective this week, by attending the (virtual) Futures Forum on Preparedness, hosted by tech nonprofit Schmidt Futures. At the forum, a diverse group of health, science, and policy leaders presented research on the global COVID-19 response and discussed how to better prepare for future public health crises.

          One cornerstone of the forum was a comprehensive comparison of how 23 countries responded to COVID-19. Researchers at the Harvard Kennedy School, Cornell University, and other partners—including teams in each of the 23 countries—analyzed politics, policies, and social conditions in order to figure out what actually constitutes success in protecting a nation’s citizens from a public health threat.

          The researchers classified countries into three major categories: control, consensus, and chaos. A nation in control exhibits public health authority—uncontested by political leaders or the general public—to actually contain the coronavirus (with border controls, contact tracing, etc.) without needing to disrupt daily life. A nation in consensus exhibits cooperation between the political system and the public health system, with citizens agreeing to some disruptions in their lives in order to more broadly keep people safe and keep the economy working. A nation in chaos fails to heed public health advice, fails to find agreement between political parties, and fails to preserve overall public safety at the expense of individual freedoms.

          Speakers at the Forum provided examples for each category: Taiwan is a nation in control, Germany is a nation in consensus, and as for chaos… of course it’s the U.S. (Brazil, India, Italy, and the U.K. also fall into the chaos category.)

          Now, some particularly nerdy readers might remember an index touted last winter, when we were just beginning to recognize the gravity of the threat posed by COVID-19. The 2019 Global Health Security Index bills itself as “the first comprehensive assessment of global health security capabilities in 195 countries.” It rates nations based on their ability to prevent public health threats, set up epidemiological surveillance, communicate risk, give citizens access to healthcare, and other similar metrics.

          The U.S. is ranked number one. It seems laughable now, right? All the measures that were supposed to help us deal with these crises—our monitoring systems, our highly trained scientific workforce, our massive national GDP—have completely failed in the face of partisan fighting and a broad lack of trust in public health measures.  

          I remember hearing about this index at the American Association for the Advancement of Science last February, what seems like a million years ago. I pitched a story on the index to my colleagues at Stacker—we could rank countries on how prepared they are for this new coronavirus, I thought. My boss questioned the pitch, saying that the index was entirely prospective and couldn’t predict how countries would actually respond. Plus, the U.S. had already started to fuck up, via the complete lack of testing and the Trump administration downplaying how severe a threat COVID-19 might pose. We did not produce the story. (Sam, if you’re reading this: thank you.)

          America was supposed to be great at this, but we failed. That’s not really news. I like the Comparative Covid Response report, though, because it highlights this failure in stark, neon lighting—and tells us exactly what we need to improve on, systematically, before the next crisis hits. At their Futures Forum on Preparedness talk, the researchers behind this report showed that a nation’s score on the Global Health Security index doesn’t correlate at all to the nation’s COVID-19 death rate. But then, they showed one property that does correlate: trust in the government.

          Figure from presentation at the Futures Forum on Preparedness.

          Countries where people actually trusted their governments to provide public health guidance, such as Thailand, New Zealand, and Germany, were able to institute those control or consensus measures I mentioned earlier and prevent widespread tragedy while keeping the basic functions of the country going. The U.S. needs to get to this point if we are to actually take advantage of all our money and resources in response to future public health crises.

          One last note: I have to give credit to the Global Health Security index where credit is due. They did get one ranking right—the U.S. scored only 25 (of 100) points for healthcare access, ranking at 175 of 195 nations.