- Deaths in U.S. prisons: Throughout the pandemic, the UCLA COVID Behind Bars Data Project has been a leading source for data on COVID-19 cases and deaths in carceral settings. As COVID-specific data on prisons and jails have become more sporadic, the project recently turned its attention to overall mortality data in these settings. Last week, the UCLA team released a new dataset sharing all-cause deaths in prisons through 2020, which combines data from public reports and records requests. The full dataset is available on GitHub, and a summary of this project’s findings on all-cause mortality was published in the New York Times last weekend.
- BIOFIRE syndromic trends data: BIOFIRE Diagnostics is a biotech company focused on diagnostic testing, offering tests for a variety of viruses, bacteria, and other pathogens. The company publishes anonymized test results from its labs on its Syndromic Trends dashboard; this dashboard is a helpful way to get an overview of test positivity for COVID-19 compared to other common diseases. (H/t Force of Infection.)
- R&D roadmap for COVID-19 vaccines: The University of Minnesota’s Center for Infectious Disease Research and Policy has published a new report outlining the research and development steps needed for the world to produce coronavirus vaccines that are “broadly protective,” not tied to a specific variant. It includes recommendations for research on virology, immunology, and vaccine technologies, along with information on using animal models and guidance on vaccine policy. Related: the CDC’s Advisory Community on Immunization Practices met this week to discuss COVID-19 and other vaccines.
- CDC reports on travel surveillance: Two new studies about COVID-19 among international travelers to the U.S. were published in this week’s CDC Morbidity and Mortality Weekly Report. Both studies describe results from the agency’s Travel Surveillance program, which is a collaboration with biotech company Ginkgo Bioworks and testing company XpresCheck. One report compares traveler test results from before and after the U.S. ended its pre-departure testing requirement for international flights, finding that travelers were much more likely to have COVID-19 after the requirement was lifted. The second report provides results from a pilot program testing airplane wastewater at JFK Airport; this report found that the vast majority of plane samples tested were positive for SARS-CoV-2, and researchers identified a variety of Omicron variants. More work is needed to really get airplane wastewater testing going in the U.S., but it’s good to see early results showing this program’s feasibility.
- Early data from XBB.1.5 in NYC: Another notable study in CDC MMWR this week provided analysis from New York City’s health department on Omicron XBB.1.5. The subvariant was first identified in the city in October 2022 (though it may have evolved somewhere else), and quickly spread through the region; it accounted for 81% of sequenced COVID-19 test samples by early January. The NYC health department linked sequencing data with patient outcomes data, finding that people infected with XBB.1.5 were not significantly more likely to be hospitalized or to die from COVID-19 compared to those infected with other variants. In other words, XBB.1.5 appears to not cause more severe disease, based on this report.
- Predicting COVID-19 cases based on wastewater results: One more newsworthy study to share this week: researchers at Hokkaido University developed a mathematical model to predict COVID-19 cases based on coronavirus concentration levels in Sapporo, Japan. I’m always on the lookout for studies like this, as wastewater data become increasingly important to track true infection numbers. (Here’s a prior example, from the University of Florida.) Of course, it’s worth noting that the Hokkaido researchers had consistent wastewater and case data from spring 2020 through 2022 to use for their model; for wastewater researchers working in the U.S. now, that consistency is often harder to achieve.
Tag: COVID-19 in prisons
-
Sources and updates, February 26
-
Featured sources, January 30
- KFF updates COVID-19 vaccine monitor: The Kaiser Family Foundation released a new report in its COVID-19 vaccine polling project this week, marking over a year since the U.S.’s vaccine rollout began. Notable updates from this report include: people are worried about Omicron’s impact on the economy and healthcare system, less worried about its impact on them personally; vaccine uptake “inched up in January” with more people getting their first doses; and gaps in booster shot uptake echo early gaps in vaccine uptake, with white Americans getting boosted at higher rates than Black and Hispanic Americans.
- New version of the COVID-19 circuit breaker dashboard: A few weeks ago, I shared a dashboard from emergency physician Dr. Jeremy Faust and colleagues that estimates which U.S. states and counties are facing hospitals operating at unsustainable levels. The dashboard has now been updated, with help from Kristen Panthagani, Benjy Renton, Bill Hanage, and others; this new version includes hospital capacity and related metrics over time for states and counties, estimates of open beds, ICU-specific data, and more.
- Biobot’s Nationwide Wastewater Monitoring Network: If you’re looking to monitor COVID-19 levels in U.S. wastewater, Biobot’s dashboard is a great source. The wastewater epidemiology company collects samples from water treatment facilities across the country; their dashboard includes both estimates of coronavirus levels in the U.S. overall and estimates for specific counties in which data are collected. The data are available for download on Github. (H/t Data Is Plural.)
- Prisoners released in 2020, DOJ: A new report from the U.S. Department of Justice includes data on state and federal prisons during the COVID-19 pandemic. The number of inmates in these facilities declined about 15% from the end of 2019 to the end of 2020, according to this report. A large cause for this decline was overall disruption in the court system, not compassionate releases due to the pandemic: there was a 40% decrease in prison admissions from 2019 to 2020.
- Companies requiring COVID-19 vaccinations: ChannelE2E, a news site covering the IT industry, has compiled this comprehensive list of major companies requiring their employees to get vaccinated. The list includes about 50 companies, and is regularly updated with links to news sources discussing policy changes. (H/t Al Tompkins’ COVID-19 newsletter.)
-
COVID source callout: Underreported cases in prisons
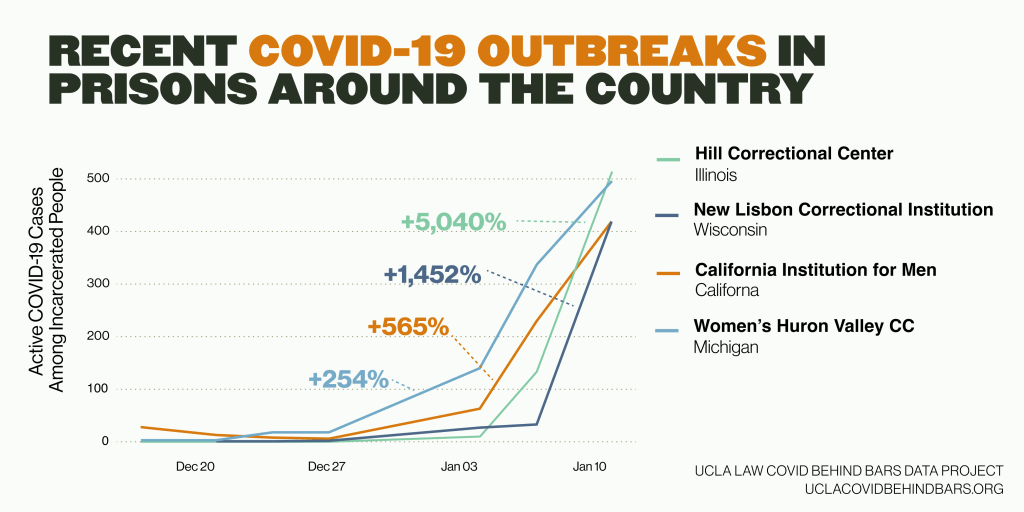
In a recent story for FiveThirtyEight, I highlighted prisons and jails as one setting highly vulnerable to COVID-19 outbreaks during the Omicron surge. Similarly to nursing homes and other long-term care facilities, these places house high numbers of people in close quarters; and many inmates are older adults or have medical conditions that increase their risk of severe symptoms.
Data collected by the UCLA Law COVID Behind Bars Data Project show that Omicron is, indeed, spreading incredibly fast in U.S. prisons. Some facilities have seen case increases over 1,000% in recent weeks.
Despite these skyrocketing case numbers, the vast majority of state incarceration systems are not doing a good job of reporting COVID-19 cases right now. The UCLA project rates every state in a scorecard from A to F, based on the metrics its department of corrections makes available and a few key aspects of data quality.
As of the most recent scorecard update in October 2021, the majority of states were rated F or D for their reporting on COVID-19 in the incarceration system—the lowest possible grades. It seems unlikely that the situation has improved, even as Omicron heightens the urgency of collecting and reporting data on cases in these highly vulnerable settings. Plus, many of these facilities are not offering vaccines to inmates or are failing to report vaccination data, according to The Marshall Project.
-
COVID source callout: States go dark on prison case numbers

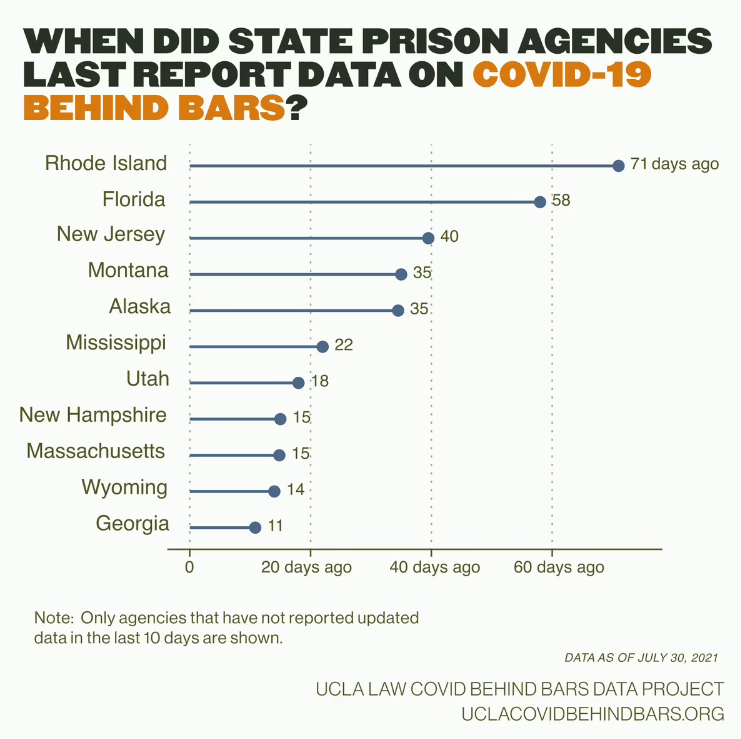
State agencies have scaled down reporting on COVID-19 cases in prisons. Figure from UCLA COVID Behind Bars. We’ve noted in recent months that several states have scaled down their COVID-19 reporting: states are providing fewer metrics, updating their dashboards less frequently, or both. For example, Florida switched from a dashboard and daily PDF reports to weekly reports with much less information.
According to the UCLA COVID Behind Bars data project, these changes are also hitting state carceral agencies—responsible for reporting COVID-19 cases in prisons and jails—right as Delta causes new outbreaks in these facilities.
Four agencies have stopped reporting these data altogether: state agencies in Florida, Georgia, and Massachusetts along with the Texas Commission on Jail Standards. Several other states haven’t updated their public data in over a month, including Rhode Island, New Jersey, Montana, and Alaska.
“Carceral agencies are responsible for the care of those in their custody, and, at a bare minimum, these agencies must track and report on COVID-19 cases and deaths in their facilities, regardless of the number of cases,” researchers from the UCLA project wrote in a recent blog post. “The fact that many are no longer doing so, or are doing so less frequently, is especially concerning given that the Delta variant is circulating rapidly around the country.”
The UCLA researchers say that these data reductions come as new outbreaks hit prisons in Delta hotspots: “Prisons in Texas and Missouri, for example, have seen a 500% increase in the number of active cases over the month of July.” Many prison residents and staffers are not vaccinated, leaving them vulnerable to the variant.
Right now, we need more information on COVID-19 in these facilities, not less.
-
Featured sources, April 25
- NYT Prisons and Jails COVID-19 counts: This week, the New York Times published data from the newsroom’s effort tracking COVID-19 cases and deaths in U.S. prisons and jails. The data include both inmates and correctional officers, covering over 2,800 facilities. You can read more about the dataset in this Twitter thread.
- RTI COVID-19 Data Insights Tool: This new data tool from RTI International provides county-level COVID-19 insights. The tool uses publicly available case data from Johns Hopkins and other sources to estimate infection risk, share of the population with some degree of immunity, and other metrics. You need to provide a name and email in order to access the tool.
-
COVID Source callout: Federal Bureau of Prisons
For the past year, nonprofit news organization The Marshall Project has tracked COVID-19 cases in prisons, in collaboration with The Associated Press. The tracking effort has primarily focused on compiling numbers from state and federal prison bureaus, through a weekly tally that compares total cases reported by these agencies to their previous totals.
This week, though, the Federal Bureau of Prisons started excluding a lot of prisoners from their count. The bureau is removing cases of any prisoner who gets released from their overall COVID-19 case total—and they aren’t reporting any data on those formerly incarcerated individuals who tested positive while in prison.
For more detail, see this thread from The Marshall Project’s Twitter account:
“We continue to pursue this information about the number of prisoners who have been sickened in federal prisons,” The Marshall Project writes. “But until the Bureau of Prisons provides it, we are unable to record their total.”
The Federal Bureau of Prisons has reported more COVID-19 cases than any other prison system in the country (at least 49,000 to date), so this new data practice may become a major data gap. I know journalists at The Marshall Project will continue extensive coverage of the BOP, though, as they have for the past year. (For more on their tracker of COVID-19 in the prison system, see the recording and recap of our second Diving into COVID-19 Data workshop.)
-
Featured sources, March 21
- Data Reporting & Quality Scorecard from the UCLA Law COVID-19 Behind Bars Data Project: The researchers and volunteers at UCLA have been tracking COVID-19 in prisons, jails, and other detention facilities since March 2020. This new scorecard, described on the project’s blog, reflects the quality of data available from state correctional agencies, the Federal Bureau of Prisons, Immigrations and Customs Enforcement, and other government sources. No state or federal institution on the list scores an A; the vast majority score Fs.
- Yelp Data Reveals Pandemic’s Impact on Local Economies: The public review site Yelp recently published results of an analysis tying listings on the site to trends in business openings and closings. It’s actually pretty interesting—almost 500,000 small businesses have actually opened in the past year, including about 76,000 restaurant and food businesses. (On a lighter note, here’s one of my favorite posts I ghost-wrote during my tenure at the Columbia news site Bwog. It’s a collection of very good Yelp reviews people have left about the university.)
-
Diving into COVID-19 data #2: Workshop recap
Our second workshop happened this week!
Liz Essley Whyte, an investigative reporter at the Center for Public Integrity, discussed her work bringing White House COVID-19 reports to the public before they were officially released. Erica Hensley, an independent health and data journalist based in Jackson, Mississippi, provided advice for navigating relationships with local public health officials based on her work reporting on COVID-19 in Mississippi. And Tom Meagher, a senior editor at The Marshall Project, described the communication and coordination work behind his newsroom’s yearlong tracker of COVID-19 in the U.S. prison system. Thank you to everyone who attended!
For those who couldn’t make it live, you can watch the recording of the session below. You can also check out the slides here. I’m also sharing a brief recap of the workshop in today’s issue.
The final workshop in our series, Communicating COVID-19 data, is coming up this coming Wednesday, March 3, from 4:30 to 6 PM ET. This session will feature freelance reporter Christie Aschwanden, The Washington Post’s Júlia Ledur, and THE CITY’s Ann Choi, and Will Welch discussing strategies for both written reporting and data visualization. If you aren’t registered for the series yet, you can sign up here.
Finding and navigating government data
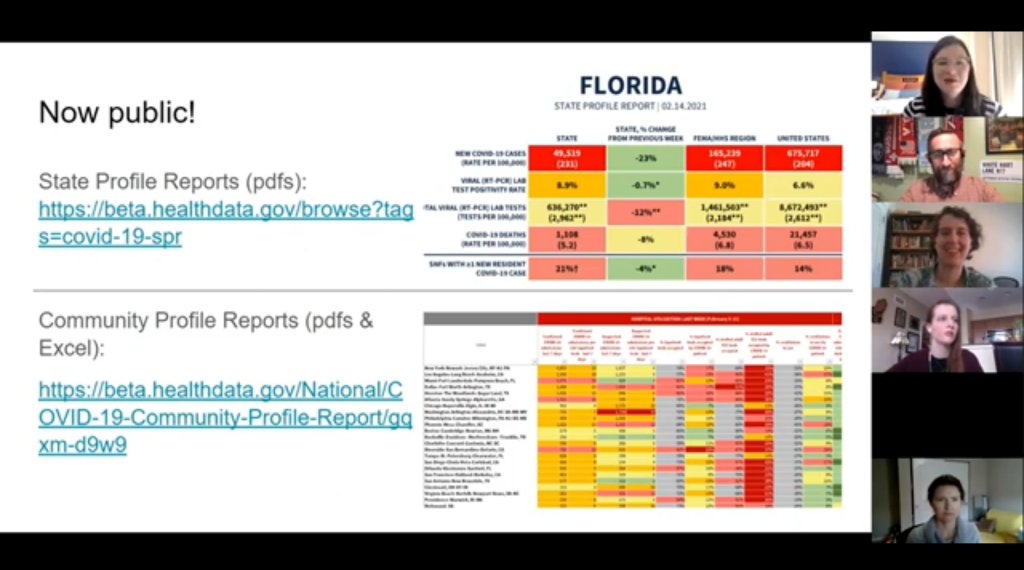
Liz Essley Whyte started her talk by providing backstory on the White House COVID-19 reports.
In the middle of the summer, she said, a source gave her access to documents that the White House Coronavirus Task Force was sending out to governors—but wasn’t publishing publicly. The documents included detailed data on states, counties, and metro areas, along with recommendations for governors on how to mitigate the spread. Whyte published the documents to which she’d obtained access, marking the start of a months-long campaign from her and other journalists to get the reports posted on a government portal.
“Despite weeks of me asking the White House, why aren’t these public, they were never made public for a while,” Whyte said. She continued collecting the reports and publishing them; the historical reports are all available in DocumentCloud.
If you need to find some government data—such as private White House reports—there are a few basic questions that Whyte recommended you start with:
- Who collects the data?
- Who uses it?
- Who has access to it?
- Has anyone else found it or published it before?
- What do you really want to find out? If you can’t get the data you really need, are there other datasets that could illuminate the situation?
While journalists often like to find fully original scoops, Whyte said, sometimes your best source for data could be another reporter. “There’s some really great datasets out there, especially in the health space, that people have maybe written one or two stories, but they have hundreds of stories in them.” So get creative and look for collaborators when there’s a source you really want to find.
She provided a few other ideas for obtaining government data: besides getting a leak from a source (which can be hard to do), you can scour government websites, ask public information officers what data are available behind their public website, contact other officials (such as those mentioned in a one-off legislative report), or file a FOIA. Third-party sources such as the COVID Tracking Project or The Accountability Project also may have useful repositories of public information, or could help you navigate to what you need. Even for-profit data collecting companies might let journalists use their work for free.
Once you have the data, talk to your contact person for the dataset and “make sure you fully understand it,” Whyte said. Ask: Who collected the data and how? How is it being used? What’s the update schedule? How complete is it? And other similar questions, until you’re sure you know how to best use the dataset. If a data dictionary is available, make sure to comb through it and ask all your term and methodology questions.
In some cases this year, Whyte has looked at document information and contacted people who are listed as a document’s author or modifier. These are often great sources, she said, who can provide context on data even if they aren’t able to speak on the record.
The White House COVID-19 reports that Whyte spent so much time chasing down this past summer are now public. The Trump’s administration started publishing the data behind these reports in December, and Biden’s administration has now started publishing the PDF reports themselves—albeit minus the recommendations to governors that previous iterations contained. Whyte provided a run-down of the reports on Twitter, which should be required reading for any local journalist who wants to get more in-depth with their pandemic coverage.
“I think they’re really great for local reporting because they break down all kinds of different metrics by state, county, and metro area,” she said. The reports notably make it easy for us to compare across jurisdictions, since the federal government has standardized all the data. And you can find story ideas in the data notes, such as seeing where a state or region had a data error. The CDD also wrote about these reports when they were first published.
Working with local gatekeepers to find data
Erica Hensley discussed a few lessons she learned from covering COVID-19 in Mississippi, where data availability has lagged some other states.
Local reporting, she said, provides journalists with a unique situation in which they’re directly relying on one local agency for news and data. She stressed the importance of building a relationship with agency representatives, helping them understand exactly what you’re looking for and why you need it.
“They’re [Mississippi’s public health agency] an under-resourced agency that was strapped for time to even address my request,” she said. Understanding on her part and a lot of back-and-forth helped her to eventually get those requests met.
Hensley also described how she worked to fill data gaps by doing her own analysis at Mississippi Today, a local nonprofit newsroom, then showed her work to the public health agency. For example, she used the total case numbers published by the state to calculate daily and weekly figures, and presented the data in a percent change map. This project helped Mississippi residents see where COVID-19 spread was progressing most intensely—but it also showed the state that this information was needed. She similarly calculated a test positivity rate; to this day, she said, state public health officials go to Mississippi Today’s website to see positivity rates, as these rates are not included on the state’s COVID-19 site.
When you can do some calculations yourself, Hensley said, do those—and focus your FOIA time on those data that are less readily available, such as names of schools and long-term care facilities that have faced outbreaks. Long-term care has been a big focus for her, as residents in these facilities tend to be more vulnerable.
Since Mississippi wasn’t releasing state long-term care data, she used federal data from the Centers for Medicare and Medicaid Services (CMS) and ProPublica to investigate the facilities. Matching up sites with high COVID-19 case counts and sites that had completed infection control training, Hensley found that the majority of long-term care facilities in the state had failed to adequately prepare for outbreaks. Her reporting revealed serious issues in the state.
Hensley advocates for local reporters to dig into long-term care stories; the CMS dataset has a lot of rich data, down to the individual facility level, that can be a springboard to stories about how facilities are (or aren’t) keeping their residents safe.
While Hensley stressed the importance of earning a local health department’s trust, she also said that health reporters need to be trusted by their colleagues. “A big part of my job early on, on top of collecting the data, was helping the newsroom understand how this applies to other local beats,” she explained. Reporters who serve as resources to each other will produce more interdisciplinary stores, and reporters who team up to request data will get the information out faster.
Building a massive system to track COVID-19 in prisons
Reporters at The Marshall Project have spent the past year tracking COVID-19 cases in U.S. prisons. Tom Meagher discussed how they did it, including a lot of external and internal communication.
After the newsroom went on lockdown, Meagher said, “Once of the first things we thought of was, prisons—being congregate living facilities—were going to be seriously affected by this pandemic.” But at first, the data they wanted simply didn’t exist.
To compile those data on COVID-19 in prisons, The Marshall Project’s team had to manage relationships with agencies in every state and D.C. They divided up all the states among their newsroom, and later worked with The Associated Press as well. At first, the reporters called every state and simply asked for numbers with no intention to publish them, in order to see if a compilation would be possible. This was easier said than done: “Prisons are not always the most transparent agencies to deal with,” Meagher said.
TMP reporters asked each agency three carefully-worded questions: How many people have been tested for the coronavirus? How many have tested positive? And how many have died? They wanted to get those numbers for both prison inmates and staff. Meagher and his colleague Katie Park had to do a lot of work to clean and standardize the numbers, which are often inconsistent across states.
The team made it clear to prison agencies that this wasn’t just a one-off ask—they came back with the same questions every week. Within a month, a lot of state agencies started setting up websites, which made data collection easier; but reporters still call and email every week in order to clarify data issues and fill in gaps. Meagher uses Google Sheets and Mail Merge to coordinate much of the data collection, cleaning, and outreach back to states with lingering questions.
The newsroom also uses a tool called Klaxon to monitor prison websites for changes and record screenshots, often useful for historical analysis. In one instance, TMP’s screenshots revealed that Texas’ justice system removed seven names from its list of prison deaths; they were able to use this evidence to advocate for names to be returned.
TMP’s data collection system is manual—or, primarily done by humans, not web scrapers. They opted for this route because prison data, like a lot of COVID-19 data, are messy and inconsistent. You might find that an agency switches its test units from people to specimens without warning, Meagher said, or fixes a historical error by removing a few cases from its total count. In these instances, a human reporter can quickly notice the problem and send a question out to the state agency.
“If we’ve learned anything from all of this, it’s that there’s a lot of different ways data can go wrong,” Meagher said. Even when public health officials are well-intentioned and questions are clearly asked, misunderstandings can still happen that lead to data errors down the line.
The goal of this dataset is really to give people insight into what’s happening—for prison inmates, for their families, and for advocates. Even agencies themselves, he said, are “eager to see how they’re doing compared to other states.” Since a similar dataset doesn’t exist on a federal level, states are using TMP’s to track their own progress, creating an incentive for them to report more accurately to begin with.
These data are freely available online, including case and death numbers for every week since March. If you have questions, Meagher and his colleagues may serve as a resource for other reporters hoping to report on COVID-19 in the prison system.Related resources
A few links shared during this session:
