Tag: booster shots

  • Public health data in the US is “incredibly fragmented”: Zoe McLaren on booster shots and more

    Public health data in the US is “incredibly fragmented”: Zoe McLaren on booster shots and more

    This week, I had a new story published at the data journalism site FiveThirtyEight. The story explores the U.S.’s failure to comprehensively track breakthrough cases, and how that failure has led officials to look towards data from other countries with better tracking systems (eg. Israel and the U.K.) as they make decisions about booster shots.

    In the piece, I argue that a lack of data on which Americans are most at risk of breakthrough cases—and therefore most in need of booster shots—has contributed to the confusion surrounding these additional doses. Frequent COVID-19 Data Dispatch readers might recognize that argument from this CDD post, published at the end of September.

    Of course, an article for FiveThirtyEight is able to go further than a blog post. For this article, I expanded upon my own understanding of the U.S.’s public health data disadvantages by talking to experts from different parts of the COVID-19 data ecosystem.

    At the CDD today, I’d like to share one of those interviews. I spoke to Zoe McLaren, a health economist at the University of Maryland Baltimore County, about how the U.S. public health data system compares to other countries, as well as how data (or the lack of data) contribute to health policies. If you have been confused about your booster shot eligibility, I highly recommend giving the whole interview a read. The interview has been lightly edited and condensed for clarity.


    Betsy Ladyzhets: I’m writing about this question of vaccine effectiveness data and breakthrough case data in the U.S., and how our data systems and sort-of by extension public health systems compare to other countries. So, I wanted to start by asking you, what is your view of the state of this data topic in the U.S.? Do you think we can answer key questions? Or what information might we be missing?

    Zoe McLaren: It’s the age-old problem of data sources. A lot of cases are not going to be reported at all. And then even the ones that are reported may not be connected to demographic data, for example, or even whether the people are vaccinated or not. Whereas other countries like Israel, and the U.K., your positive COVID test goes into your electronic health record that also has all the other information. 

    And Medicare patients, they have that whole [records] system. There will be information [in the system] about whether they got vaccinated, as well as whether they have a positive test. So that data will be in there. But for other people, it may or may not be in an electronic health record. And then of course, there’s multiple different electronic health record systems that can’t be integrated easily. So you don’t get the full picture.

    But it’s all about sample selection. Not everyone [who actually has COVID] is ending up in the data, which messes up both your numerator and denominator when you’re looking at rates.

    BL: Could you say more about how our system in the U.S. is different from places like Israel and the U.K., where they have that kind of national health record system?

    ZM: When the government is providing health insurance, then all of your records and the [medical] payments that happen, there’s a record of them… And then, because it’s a national system, it’s already harmonized, and everyone’s in the same system. So it’s really easy to pull a dataset out of that and analyze it.

    Whereas in the US, everything is incredibly fragmented. The data, and the systems and everything is very fragmented. The electronic health systems don’t merge together easily at all. And so you get a very fragmented view of what’s going on in the country.

    BL: Right, that makes sense. Yesterday, I was talking to a researcher at the New York State Health Department who did a study where they matched up the New York State vaccination records with testing records and hospitalization records, and were able to do an analysis of vaccine effectiveness. And he said, basically, the more specific, you tried to go with an analysis, the harder it is to match up the records correctly, and that kind of thing.

    ZM: Exactly. It’s easy to match on things like age, sex, race, since everybody has them. But then, the different data fields are gonna have different formats and be much harder to merge together.

    BL: So what can we do to improve this? I know Medicare for All is one option— 

    ZM: Medicare for All, end of story, end of article. It would solve so many problems.

    It’s tricky, though, because there isn’t a simple fix. All of these health systems have their own electronic health records, and integrating them is really costly and hard to do, and who is going to pay for that? There’s also additional privacy concerns about integrating things, in terms of protecting privacy and confidentiality. So, that’s really tricky.

    The way that we get around that, in general, is to have reporting requirements. Like with COVID tests, [providers are] required to report to the CDC or the HHS… Still, that’s also costly and time consuming. But that is kind-of the best thing that we can do right now, is have the different [public health] entities produce reports on a regular basis and send that to a centralized location. And the reports are supposed to be produced in a way that they are harmonized, they’re easy to put together from all the different systems.

    The problem with the different systems not integrating is, it requires everyone to basically fill out the equivalent of a form and send it in—listing individual patient information, or at the state level, individual county information. An example of that is the COVID data. All of the COVID data gets reported up to the national level [by state and county health departments]… 

    But the reporting often gives you the numerators, when you need to figure out the denominators. Because you would want to know, for example, we want to know what proportion of breakthrough cases end up hospitalized. But if only the hospitalized people end up in the data, and a lot of breakthrough cases go either undetected or never tested, or they do an at-home test and there’s no record of that positive case in the system, then your denominator is—there’s a problem with your denominator. That’s a problem with sample selection, you get people that are self-selecting into the numerator [by testing positive], but also self-selecting into the denominator [by getting a test to begin with].

    BL: Yeah, that makes sense. I know you said it would be pretty complicated to basically force different public health departments—to standardize them so that they’re all reporting in the same way. Is there more that researchers in the US could be doing in the short-term to either improve data collection or use what we have to answer questions like, what occupations might confer higher risk of a breakthrough case? 

    ZM: This is a coordination problem. Because in general, we all have an incentive to contribute to having a better understanding of breakthrough cases. But the trick is that, unless the national government or the CDC takes the role of saying what the [data] format’s gonna look like…

    Part of the problem is that there’s an effort involved [in collecting these data] and people don’t want to put in the effort. But if they do want to put in the effort, then you still have a coordination problem, because who gonna to be deciding what format we’re using?

    BL: Or like, what the data definitions are.

    ZM: Exactly. Like, do you report the month and the day of the vaccination dose, or just the month of the dose? Things like that where it doesn’t seem like a big deal, but it does matter for research purposes. If you look, for example, at the Census, or any of the national surveys, like the Current Population Survey or the National Labor Force Survey where we get unemployment numbers, there are big committees that figure out which questions we’re asking and how we ask them. So, if the CDC just says, like, “This is the dataset we’re building,” then everyone [local agencies] will be like, “Okay, we’re gonna send our reports in that way.” 

    Part of [the challenge] is that it takes effort to produce the data, and part of it is somebody needs to coordinate. And usually that would be something the CDC would do, saying, “This is the data that needs to be reported to us,” and everybody reports to them. But they could be doing more, they could be asking for more detailed information—for example, data based on vaccination status, because that information will be important for understanding the progression of the pandemic.

    BL: Yeah. I volunteered for the COVID Tracking Project for a while, and one of the most tedious things that we had to do there was figuring out different definitions for like, what states were considering a case or a test, or whatever else. So that definitely makes sense to me.

    ZM: Exactly. And the COVID Tracking Project filled a gap. Nobody was doing that [collecting data from the states], so the COVID Tracking Project did that… But it’s tricky, because a lot of the stuff that seems like splitting hairs [on definitions] really does make a difference when you’re doing your analysis.

    BL: I also wanted to ask you about what the implications are of this lack of standardized data in the U.S., and the lack of information that we have—largely around vaccinations, but I think there are other areas as well where we’re missing information. So I’m trying to figure out, for this story, how data gaps might contribute to the confusion that people feel when they watch health agencies make decisions. Like watching all the back and forth on booster shots, or thinking about Long COVID, other things like that.

    ZM: Well, we talk about evidence-based medicine, and we also care about evidence-based policy. And so it means that when the quality of data is poor, the quality of our policy is going to be worse. So it really is in everybody’s best interest to have high-quality data, because that is the bedrock of producing high quality policy.

    BL: Right. So if we don’t know, for example, if people who live and work in certain situations are more likely to have a breakthrough case, then we can’t necessarily tell them—we can’t necessarily say, “These specific occupations should go get booster shots.” And then we just say, “Everyone can go get a booster shot.”

    ZM: It means that we’re flying blind. And the problem of flying blind is twofold. One is that you can end up making poor decisions, the wrong decisions, because you don’t have the data. And then the other problem is that you end up making decisions that, in economics, we call it “inefficient.” I think about [these decisions] as, you end up with “one size fits all.” 

    If we have really high quality data, then we’re able to create different policies for different types of people, and that helps minimize any of the downsides. But the less data we have, the more we have to rely on “one size fits all.” And of course, if “one size fits all,” it’s going to be too much for some people and too little for others. Data would help improve that.

    BL: How do you think that this kind of “one size fits all” contributes to how individual people might be confused or might not be sure how to kind of interpret the policies for their own situations?

    ZM: I think in a “one size fits all,” people get very frustrated because they see in their own lives, both the uncertainty and how that can be stressful—and also the waste. The situations where they fall under one policy, but they have enough information to know that that policy doesn’t necessarily apply to them. It does undermine confidence in policymaking. People get frustrated with “one size fits all,” because it seems wasteful.

    Though sometimes the “one size fits all” is still optimal, it’s better than the alternative. For example, the recommendation of “one size fits all” wearing masks tends to trump the “one size fits all” of not wearing masks. But there’s waste. There are situations where we end up wearing masks where they wouldn’t necessarily be needed. And vice versa.

    BL: Yeah. That makes me think of friends I have who are eligible to get booster shots because of medical conditions, but they’re sort-of thinking, “I wish the shots could go to another country where they need vaccinations more.” And that’s not something individuals have any control over, but it’s frustrating.

    ZM: Part of it is, with the booster shots, is the guidelines that say people who have higher occupational exposure to risk [are eligible] without specifying exactly who that is. That is one way that we allow some leeway. So it’s not a “one size fits all” where nobody gets it, because there’s actually people who qualify under higher occupational exposure. But we also don’t want to have a “one size fits all” where we tell everyone they need it, because we do want to be sending doses abroad as well.

    So that’s a situation where we know that a “one size fits all” is not perfect. And so we create a, like, “use your judgement, talk to your doctor” kind-of thing that tries to help people self-select into the right groups… There are likely a lot of people who do have higher exposure and should be getting it, but don’t think the benefit applies to them.

    Editor’s note: According to one analysis, about 89% of U.S. adults will qualify for a booster shot after enough time has passed from their primary vaccine series. And, according to the October COVID-19 Vaccine Monitor report, four in ten vaccinated adults were unsure whether they qualified.

    BL: I also wanted to ask, you mentioned rapid tests—those don’t necessarily get reported. Are there other other things that you think pose data gaps in the U.S. public health system?

    ZM: With rapid tests, the actual tests are not getting reported. But the important thing is, people are getting tested. I mean, the reason we want good data quality is to reduce cases, and we wouldn’t want to limit access to rapid tests in order to collect data, because it’s much easier to prevent the cases by allowing people to get tested in their homes.

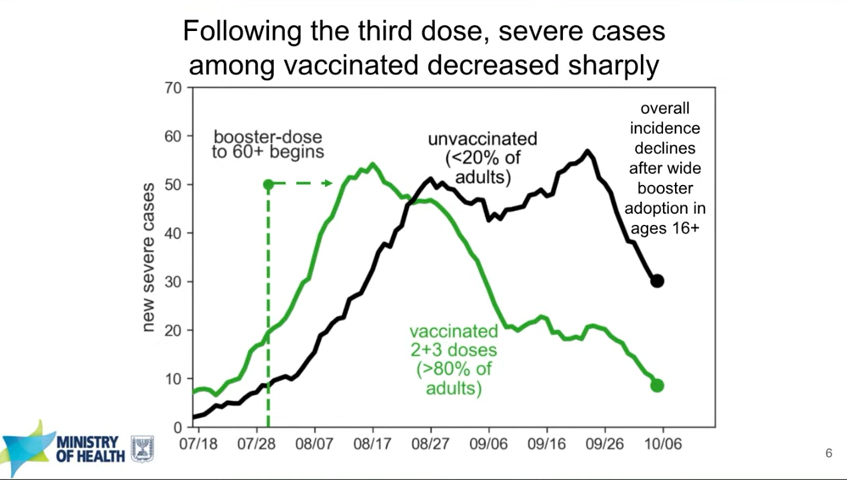
    But yeah, just the fact that there’s no centralized database for analysis [is a gap]. I mean, if you look at the U.K., and Israel, they have these great studies, because they’re able to just download, like, the entire population into a dataset. And it has all the information they need, like demographic factors. The fact that the U.S. has made so much of its national policy based on Israeli data, this shows how far behind we are with having our own data to answer these questions.

    BL: Yeah. I know, it’s something like half or a third of cases in the U.S., the CDC doesn’t have race and ethnicity information for [editor’s note: it’s 35%], and other stuff like that. It’s wild.

    ZM: Yeah… And one of the things about reporting is that every additional piece of data you want is very costly. And so you have to be very judicious about [collecting new values].

    BL: Well, those were all my questions. Is there anything I didn’t ask you that you think would be important for me to know for this story?

    ZM: Just that data is helpful for planning now, and helpful for the future. If we can improve our data systems now—it’s part of being prepared for the next pandemic.

    More vaccine reporting

  • Booster shot data slowly makes it onto state dashboards, but demographic information is lacking

    Booster shot data slowly makes it onto state dashboards, but demographic information is lacking

    Ohio is one of just eight states reporting demographic data for booster shots administered in the state. Screenshot taken on November 7.

    It’s now been over a month since the FDA and the CDC authorized third doses of Pfizer’s COVID-19 vaccine for a large swath of the U.S. population, and a couple of weeks since the agencies did the same thing for additional doses of Moderna and Johnson & Johnson’s vaccines. In that time, over 20 million Americans have received their boosters.

    This weekend, I set out to see what data are now available on these booster shots. I updated my vaccination data in the U.S. resource page, which includes detailed annotations on every state’s vaccine reporting along with several national and international sources.

    The majority of states (and national dashboards) are now including booster shots in their vaccine reporting, I found. But in most cases, the reporting stops at just one statistic: the total number of residents who have received an additional dose. A few states are reporting time series information—i.e. booster shots administered by day—and a few are reporting demographics—i.e. booster shot recipients by age, gender, race, and ethnicity—but these metrics are lacking across most dashboards.

    Demographic information, particularly race and ethnicity, should be a priority for booster shot data, as it should be for numerous other COVID-19 metrics. At the beginning of the U.S.’s vaccine rollout, Black and Hispanic/Latino Americans lagged behind white Americans in getting their shots, but limited data hindered the public health system’s ability to respond to this trend. (Now, the trends have evened out somewhat, though Black vaccination rates still lag white rates in some states.)

    Will we see the same pattern with booster shots? Considering the immense confusion that has surrounded America’s booster shot rollout in the last couple of months, it would not be surprising if disadvantaged communities are less likely to know about their potential need for a booster, or where and how to get those shots.

    But so far, we don’t have enough data to tell us whether this pattern is playing out. The CDC has yet to report booster shot data by race or ethnicity, though the agency is now reporting some figures by age and by state. Note: the CDC still has yet to report detailed vaccination data by race and ethnicity, period; the agency just reports national figures, nothing by state or other smaller geographies.

    At the state level, just eight states are reporting booster shots by race and ethnicity. 13 states are reporting some kind of time series (boosters administered by day or week), and three are reporting doses administered by vaccine manufacturer.

    Here are all the states that I found reporting booster shot data, with links to their dashboards:

    • Arkansas: Reporting total boosters only.
    • California: Total boosters only.
    • Colorado: Reporting demographics; age, race/ethnicity, and sex.
    • DC: Total boosters for DC and non-DC residents.
    • Delaware: Reporting demographics; age, race/ethnicity, and sex.
    • Florida: Total boosters only.
    • Indiana: Total boosters and doses administered by day.
    • Kansas: Total boosters and doses administered by day.
    • Louisiana: Total boosters only.
    • Massachusetts: Total boosters and doses administered by day.
    • Maryland: Reporting demographics; age, race/ethnicity, and sex.
    • Michigan: Reporting demographics (age, race/ethnicity, and sex) as well as doses administered by week and by manufacturer.
    • Minnesota: Total boosters only.
    • Missouri: Total boosters and doses administered by day.
    • Mississippi: Reporting demographics (age and race/ethnicity) as well as doses administered by facility type (total and for the prior week).
    • North Dakota: Total boosters and doses administered by day.
    • New Jersey: Reporting demographics (age, race/ethnicity, and sex) as well as doses administered by day and by manufacturer.
    • New Mexico: Total boosters only.
    • Ohio: Reporting demographics (age, race/ethnicity, and sex) as well as doses administered by day and by county.
    • Oklahoma: Total boosters only.
    • Oregon: Total boosters, doses administered by day and by county.
    • Pennsylvania: Total boosters and doses administered by day.
    • Rhode Island: Boosters administered by day only.
    • South Carolina: Boosters administered by day only.
    • South Dakota: Total boosters, doses administered by week and by county.
    • Texas: Total boosters only.
    • Virginia: Reporting demographics; age, race/ethnicity, and sex.
    • Vermont: Total boosters only.
    • Wyoming: Total boosters and doses administered by manufacturer.

    Local reporters: If your state is reporting demographic data, I recommend taking a look at those numbers. How does the population receiving booster shots compare to the overall population of your state, or to the population that’s received one or two doses? And if your state is not reporting demographic data (or any booster data at all), ask your public health department for these numbers!

    You can see my vaccine annotations page for more information on all of these state dashboards. And if there are any states or metrics I missed, please let me know! Comment here or email me at betsy@coviddatadispatch.com.

    More vaccine reporting

  • Sources and updates, October 31

    A lot of COVID-19 data sources caught my eye this week!

    • More booster data from the CDC: This week, the CDC added both booster shot trends by day and booster shots by primary series type to its COVID Data Tracker. For booster shot trends, click “People Receiving a Booster Dose” on the Trends page, and for primary series data, scroll down to “Covid-19 Booster Dose Type by Primary Series Type” on the Vaccination Totals page. So far, it looks like a lot of Johnson & Johnson recipients are opting for mRNA boosters.
    • KFF’s latest Vaccine Monitor update: The Kaiser Family Foundation has released the latest edition of its monthly vaccine poll, the COVID-19 Vaccine Monitor. This month’s edition focuses on vaccinations for children ages 5 to 11, in line with the recent discussions around shots for this age group, but it also includes other polling on general vaccination demographics, boosters, mandates, and more.
    • Under-testing in U.S. prisons and jails: A new report from the UCLA Law COVID Behind Bars Data Project explores how insufficient COVID-19 testing of incarcerated people in the U.S. contributes to skewed case rates. Even in the states that have tested their incarcerated populations the most, this report shows, that testing is still far less frequent than testing for other congregate living facilities, like nursing homes.
    • Impact of School Opening on SARS-CoV-2 Transmission: A group of scientists (including school data expert Emily Oster) recently published a new paper in Nature examining how school reopening models—remote, hybrid, or in-person—contribute to community transmission. In most parts of the country, reopening model did not have a significant impact on transmission, they found; the South was an exception. The authors shared the data underlying their paper, with some information from Burbio and the CDC removed due to requirements from those organizations.
    • Reporting recipe for breakthrough case data: Dillon Bergin, my colleague at the Documenting COVID-19 project, wrote this reporting recipe, which guides local newsrooms through acquiring data on and covering breakthrough cases in their areas. The recipe accompanies a recent story that Dillon wrote, in collaboration with the Las Vegas Review-Journal, on breakthrough cases by occupation in Las Vegas. (Unsurprisingly, healthcare workers and casino workers were likely to have breakthrough cases, the Las Vegas data show.)
    • Polling on small businesses and vaccine mandates: Here’s another vaccine survey released this week, this one from the U.S. Chamber of Commerce. The agency asked small businesses about their positions on vaccine mandates, as well as hiring challenges and other issues. 64% of small business owners support “businesses in their area requiring vaccines for their employees,” the survey found.

  • National numbers, October 31

    National numbers, October 31

    Nationwide COVID-19 hospitalizations have fallen below 50,000 for the first time since July. Chart via Conor Kelly, posted on Twitter on October 30.

    In the past week (October 23 through 29), the U.S. reported about 480,000 new cases, according to the CDC.* This amounts to:

    • An average of 69,000 new cases each day
    • 147 total new cases for every 100,000 Americans
    • 7% fewer new cases than last week (October 16-22)

    Last week, America also saw:

    • 38,000 new COVID-19 patients admitted to hospitals (12 for every 100,000 people)
    • 8,000 new COVID-19 deaths (2.4 for every 100,000 people)
    • 100% of new cases are Delta-caused (as of October 23)
    • An average of 900,000 vaccinations per day (including booster shots; per Bloomberg)

    *Note: we are back to our usual schedule (utilizing data as of Friday) after last week’s hiccup.

    Nationally, new COVID-19 cases continue to drop—though the decrease is slowing a bit from previous weeks. The number of new cases fell by about 7% this week, after falling by about 12% for the two weeks prior.

    Still, a downward trend is a positive trend. The U.S. now has fewer than 50,000 COVID-19 patients in hospitals nationwide, for the first time since July—before the Delta surge started. The number of new deaths is also slowly falling, though the country is still seeing over 1,000 people die from COVID-19 each day.

    The country’s current hotspots continue to be the same group of colder-weather states I called out last week: Alaska, Montana, Wyoming, North Dakota, and Idaho. All five have recorded over 400 new cases for every 100,000 people in the last week, per the latest Community Profile Report, with Alaska at the top (657 cases per 100,000).

    It’s hard to say whether these high numbers are a product of cold weather driving people inside, low vaccination rates—all five states have about half or less of their populations fully vaccinated—or both. Continuing trends in these states may provide an indicator of how other parts of the country may fare this winter.

    Meanwhile, more states are seeing their COVID-19 numbers drop below “high transmission” levels, including Louisiana, D.C., Georgia, Maryland, Texas, and New Jersey. In New Orleans, a Delta epicenter in the summer, case numbers are low enough that the mayor has loosened the city’s mask mandate and other COVID-19 restrictions.

    Vaccinations are up nationally, but booster shots—not previously unvaccinated Americans getting their first doses—are comprising the bulk of the trend. Yesterday, out of 1.6 million doses reported by the CDC, a record one million were booster shots. Just 361,000 were new first doses.

  • Featured sources, October 24

    • More booster shot data from the CDC: The CDC has added more data on additional vaccine doses to its COVID-19 dashboard. Specifically, we can now analyze booster shots by state: raw numbers, share of the fully vaccinated population with a booster, and limited age data (18+, 50+, 65+). If anyone from the CDC is reading this: I would love to see some race/ethnicity data next!
    • Racial and ethnic disparities in COVID-19 hospitalization: A new CDC study published this week in JAMA Open Network presents analysis of data from COVID-NET, the national agency’s surveillance system for COVID-19 hospitalizations. The study, like other research on this topic, found that non-white Americans were far more likely to be hospitalized with COVID-19 or die from the disease in the first year of the pandemic than their white neighbors. Supplemental tables for the study include breakdowns of COVID-19 hospitalizations by different demographic groups, by underlying medical conditions, and over time.
    • The COVID States Project: In this polling project, researchers surveyed people in all 50 U.S. states to ask whether they approve of the president and of their governors. The survey is jointly run by researchers at Harvard, Northeastern, Northwestern, and Rutgers Universities. This latest report, released in October, includes executive approval data stratified by political party and vaccination status.
    • COVID-19, compared to other leading causes of death: COVID-19 was the number two cause of death in the U.S. in September 2021—after heart disease—according to this report from the Peterson Center on Healthcare and the Kaiser Family Foundation. The report compares COVID-19 to other top causes of death in the country, including data over time and by age group.

  • Booster shots exacerbate global vaccine inequity

    At the end of last week’s post on booster shots, I wrote that these additional doses take up airtime in expert discussions and in the media, distracting from discussions of what it will take to vaccinate the world.

    But these shots do more harm than just taking over the media cycle. When the U.S. and other wealthy nations decide to give many residents third doses, they jump the vaccine supply line again—leaving low-income nations to wait even longer for first doses.

    I explained how this process works in a new article for Popular Science. Essentially, the big vaccine manufacturers (Pfizer, Moderna, Johnson & Johnson, etc.) have created artificial scarcity of vaccine doses, by insisting on controlling every single dose of their products—rather than sharing the vaccine technology with other manufacturers around the world.

    Then, out of this limited supply of doses, the big companies sell to wealthy nations first. The wealthy nations are “easier markets to service,” WHO spokesperson Margaret Harris told me, since they can pay more money and have logistical systems in place already to deliver the vaccine doses.

    If a wealthy nation wants boosters, it’s in the vaccine companies’ best interests to sell them boosters—before sending primary series doses to other parts of the world. Or, as South Africa-based vaccine advocate Fatima Hassan put it: “Supplies that are currently available are diverted” for boosters. “Just to serve preferred customers in the richer North.”

    The FDA and CDC authorized booster shots for Moderna, Johnson & Johnson, and mix-and-match regimens this week. Advisory committee discussions did not mention that, worldwide, three in five healthcare workers are not fully vaccinated.

    More international data

    • National numbers, October 24

      National numbers, October 24

      As of October 22, the CDC is reporting booster doses administered by state. Darker blue corresponds to a higher share of the fully vaccinated population in the state that has received a booster; lighter blue/green corresponds to a lower share of the population.

      In the past week (October 15 through 21), the U.S. reported about 510,000 new cases, according to the CDC.* This amounts to:

      • An average of 73,000 new cases each day
      • 156 total new cases for every 100,000 Americans
      • 14% fewer new cases than last week (October 9-15)

      Last week, America also saw:

      • 42,000 new COVID-19 patients admitted to hospitals (13 for every 100,000 people)
      • 9,000 new COVID-19 deaths (2.7 for every 100,000 people)
      • 100% of new cases are Delta-caused (as of October 16)
      • An average of 800,000 vaccinations per day (including booster shots; per Bloomberg)

      *Note: This week’s update relies on data as of Thursday, October 21. I usually use Friday data (via the COVID Data Tracker Weekly Review), but was unable to do so this week because I headed offline for a hiking trip before the Friday data were posted. We’ll be back to the usual sourcing next week!

      Nationwide, COVID-19 cases continue to go down—slowly but surely. We’re now seeing roughly 70,000 new cases a day, comparable to case counts when the Delta surge started to really pick up at the end of July. It’s worth noting, though, that this is still higher than the peaks of both the spring and summer 2020 surges.

      At the state level, more parts of the country are approaching lower coronavirus transmission levels. As of Thursday, eight jurisdictions have dropped below 100 new cases per 100,000 people in the past week. From lowest case counts to highest, these are: California, Hawaii, Florida, Louisiana, Washington D.C., New Jersey, Maryland, and Mississippi.

      Alaska, Montana, and Wyoming remain the states with the highest COVID-19 rates, followed by Idaho and North Dakota. These states are all in northern parts of the U.S.—and their recent case increases have coincided with cold weather—the Washington Post and other outlets have noted. Other states may see similar COVID-19 upticks as it becomes too cold to socialize outdoors.

      Booster shots continue to inflate vaccination numbers, as these third doses comprise between one-third and one-half of doses administered in the U.S. each day. Over 11 million people have already received a booster dose—more than the total doses administered in a number of low-income countries.

    • Booster shots: What we’ve learned—and what we still don’t know

      Booster shots: What we’ve learned—and what we still don’t know

      This week, the FDA’s vaccine advisory committee had a two-day meeting to discuss booster shots for Moderna’s and Johnson & Johnson’s COVID-19 vaccines. From the outside, these meetings may have appeared fairly straightforward: the committee voted unanimously to recommend booster shots for both vaccines.

      But in fact, the discussions on both days were wide-reaching and full of questions, touching on the many continued gaps in our knowledge about the need for additional vaccine doses. The FDA committee continues to make decisions based on rather limited data, as do other top U.S. officials. Case in point: on Thursday, the committee was asked to consider data from Israel’s booster shot campaign—which is utilizing Pfizer vaccines—as evidence for Moderna boosters in the U.S.

      In the Moderna vote on Thursday afternoon, committee member Dr. Patrick Moore, a virologist at the University of Pittsburgh, said that he voted “on gut feeling rather than really truly serious data.” The comment exemplified how much we still don’t know regarding the need for boosters, thanks in large part to the CDC’s failure to comprehensively track breakthrough cases in the U.S.

      Still, there are a few major facts that we have learned since the FDA and CDC discussions on Pfizer boosters that took place a couple of weeks ago. Here’s my summary of what we’ve learned—and what we still don’t know.

      What we’ve learned since the Pfizer discussion:

      Israel’s booster rollout continues to align with falling case numbers. On Thursday, representatives from the Israeli national health agency presented data on their booster shot rollout—which, again, is using Pfizer vaccines. The vast majority of seniors in Israel have now received a third dose, and over 50% of other age groups have as well. According to the Israeli scientists, this booster rollout both decreased the risk of severe COVID-19 disease for older adults and helped to curb the country’s Delta-induced case wave, causing even unvaccinated adults to have a decreased risk of COVID-19.

      In Israel, severe cases among both vaccinated and unvaccinated adults decreased after the country provided third Pfizer doses to its residents. Screenshot taken from Thursday’s VRBPAC meeting.

      You can read more about Israel’s booster campaign in this paper, published in the New England Journal of Medicine in early October. It’s worth noting, however, that Delta is known to spur both case increases and decreases in cycles that can be somewhat unpredictable—and may not be exactly linked to vaccination. So, I personally take the Israeli claims that boosters stopped their case wave with a grain of salt.

      Decreased vaccine effectiveness against infection may be tied more to Delta and behavioral factors than “waning antibodies.” This week, the New York State Department of Health (DOH) announced results from a large study of vaccine effectiveness which is, from what I’ve seen, the first of its kind in the U.S. The New York DOH used state databases on COVID-19 vaccinations, tests, and hospitalizations to examine vaccine effectiveness against both infection and hospitalization in summer 2021, when Delta spread rapidly through the state.

      They found that vaccine effectiveness against infection did decline over the summer. But the declines occurred similarly for all age groups, vaccine types, and vaccine timing (i.e. which month the New Yorkers in the study received their vaccines)—suggesting that the decline in effectiveness was not tied to waning immune system protection. Rather, the effectiveness decline correlated well with Delta’s rise in the state. It also correlated with reduced safety behaviors, like the lifting of New York’s indoor mask mandate and the reopening of various businesses.

      Vaccine effectiveness against hospitalization declined for older adults, but remained at very high levels for New Yorkers under age 65, the study found. Here’s what lead author Dr. Eli Rosenberg said in a statement:

      The findings of our study support the need for boosters in older people in particular, and we encourage them to seek out a booster shot from their health care provider, pharmacy or mass vaccination site. We saw limited evidence of decline in effectiveness against severe disease for people ages 18 to 64 years old. While we did observe early declines in effectiveness against infections for this age group, this appears to have leveled off when the Delta variant became the predominant strain in New York. Together, this suggests that ongoing waning protection may be less of a current concern for adults younger than 65 years.

      I was surprised that this study didn’t come up in the FDA advisory committee meetings this week, and will be curious to see if it’s cited in future booster shot discussions. The study does align, however, with the committee’s decision against recommending booster shots for all adults over age 18 who received Moderna vaccines.

      Johnson & Johnson vaccine recipients appear to need boosters more than mRNA vaccine recipients. On Friday, presentations from both J&J representatives and FDA scientists made a clear case for giving J&J vaccine recipients a second dose of this adenovirus vaccine. In one 30,000-patient study, patients who received a second J&J shot two months after their first shot saw their vaccine efficacy (against symptomatic infection) rise from 74% to 94%.

      Interestingly, unlike the Pfizer and Moderna vaccines, a J&J shot’s ability to protect against coronavirus infection appears relatively stable over time. However, a booster shot can make this vaccine more effective—especially against variants. Despite arguments from J&J representatives that their vaccine’s second dose should come six months after the first dose, the FDA advisory committee voted to recommend second J&J shots just two months after the first dose, for all adults over age 18.

      It’s worth noting that this vaccine regimen might effectively change J&J’s product from a one-shot vaccine to a two-shot vaccine. STAT’s Helen Branswell and Matthew Herper go into the situation more in their liveblog.

      Mixing and matching vaccines is a strong strategy for boosting immunity, especially if one of the vaccines involved uses mRNA technology. This week, the National Institutes of Health (NIH) released a highly anticipated study (posted as a preprint) on mix-and-match vaccine regimens. The NIH researchers essentially tested every possible booster combination among the three vaccines that have been authorized in the U.S. Before and after vaccination, the researchers took blood samples and tested for antibodies that would protect against the coronavirus.

      In short, the NIH study found that all three vaccines—Pfizer, Moderna, and J&J—will provide a clear antibody boost to people who have received any other vaccine. But the mRNA vaccines (Pfizer and Moderna) provide bigger benefits, both in the form of higher baseline antibody levels (after two shots) and a higher boost. The best combination was a J&J vaccine initially, followed by a Moderna booster, Dr. Katelyn Jetelina notes in a Your Local Epidemiologist summary of the study.

      Every vaccine provided a “boost” of protective antibodies to recipients of every other vaccine. Figure from the NIH preprint. mrna-1273 refers to the Moderna vaccine, Ad26.COV2.S refers to the J&J vaccine, and BNT162b2 refers to the Pfizer vaccine.

      The booster regimens also appeared to be safe, with limited side effects. But this was a relatively small study, including about 450 people. In their discussion on Friday afternoon, the FDA advisory committee members said that they would be very likely to authorize mix-and-match vaccine regimens after seeing more safety data.

      Moderna and J&J boosters appear to be safe, with similar side effects to second shots. Safety data from Moderna’s and J&J’s clinical trials of their booster shots, along with data from the NIH mix-and-match study, indicate that the additional doses cause similar side effects to first and second doses. After a booster, most recipients had a sore arm, fatigue, and other relatively minor side effects.

      And here’s what we still don’t know:

      Which medical conditions, occupations, and other settings confer higher breakthrough case risk? I wrote about this issue in detail in September. The U.S. continues to have little-to-no data on breakthrough case risk by specific population group, whether that’s groups of people with a specific medical condition or occupation. This data gap persists, even though U.S. researchers have some avenues for breakthrough risk analysis at their disposal (see: this post from last week).

      This lack of data came up in FDA advisory committee discussions on Thursday. An FDA representative was unable to cite any evidence that people in specific occupational settings are at a higher risk for breakthrough cases.

      Are there any rare vaccine side effects that may occur after breakthrough doses? When I covered the FDA advisory committee meeting on Pfizer boosters, I noted that Pfizer’s clinical trial of these shots included just 306 participants—providing the committee members with very limited data on rare adverse events, like myocarditis. Well, Moderna’s clinical trial of its booster shots was even smaller: just 171 people. J&J had a larger clinical trial, including over 9,000 people.

      These trials and the NIH mix-and-match study indicated that booster shots cause similar side effects to first and second shots, as I noted above. But few clinical trials are large enough to catch very rare (yet more serious) side effects like myocarditis and blood clots. (In J&J’s case, blood clots occur roughly twice for every million doses administered.) Federal officials will carefully watch for any side effects that show up when the U.S.’s booster rollout begins for Moderna and J&J.

      How do antibody levels correlate to protection against COVID-19, and what other aspects of the immune system are involved? The NIH mix-and-match study focused on measuring antibody levels in vaccine recipients’ blood, as did other booster shot trials. While it may sound impressive to say, for example, “J&J recipients had a 76-fold increase in neutralizing antibodies after receiving a Moderna booster,” we don’t actually know how this corresponds to protection against COVID-19 infection, severe disease, and death.

      Some experts—including a couple of those on the FDA advisory committee—have said that discussions focusing on antibodies distract from other types of immunity, like the memory cells that retain information about a virus long after antibody levels have fallen. More research is needed to tie various immune system measurements to real-world protection against the coronavirus.

      What needs to happen at the FDA for mix-and-match vaccination to be authorized? One challenge now facing the FDA is, the federal agency has clear evidence that mix-and-match vaccine regimens are effective—but it does not have a traditional regulatory pathway to follow in authorizing these regimens. Typically, a company applies for FDA authorization of its specific product. And right now, no vaccine company wants to apply for authorization of a regimen that would involve people getting a different product from the one that brings this company profit.

      So, how will the FDA move forward? There are a couple of options, like the CDC approving mix-and-match boosters directly. See this article for more info.

      Finally: I can’t end this post without acknowledging that, as we discuss booster shots in the U.S., millions of people in low-income countries have yet to even receive their first doses. Many countries in Africa have under 1% of their populations vaccinated, according to the Bloomberg tracker. While the Biden administration has pledged to donate doses abroad, boosters take up airtime in expert discussions and in the media—including in this publication. Boosters distract from discussions of what it will take to vaccinate the world, which is our true way out of the pandemic.


      More vaccine reporting

    • National numbers, October 17

      National numbers, October 17

      Cases are going down for all age groups, but children continue to have high COVID-19 rates. Chart from the CDC.

      In the past week (October 9 through 15), the U.S. reported about 600,000 new cases, according to the CDC. This amounts to:

      • An average of 85,000 new cases each day
      • 180 total new cases for every 100,000 Americans
      • 13% fewer new cases than last week (October 2-8)

      Last week, America also saw:

      • 47,000 new COVID-19 patients admitted to hospitals (14 for every 100,000 people)
      • 9,000 new COVID-19 deaths (2.7 for every 100,000 people)
      • 100% of new cases are Delta-caused (as of October 9)
      • An average of 700,000 vaccinations per day (including booster shots; per Bloomberg)

      COVID-19 cases continue to drop across the U.S., slowly but surely. We’re now reporting about 85,000 new cases a day, down from 97,000 new cases a day last week, down from 108,000 new cases a day the week before last.

      Hospitalizations and deaths are falling nationwide as well. About 57,000 Americans are currently hospitalized with COVID-19, down 12% from last week. And about 1,200 people are dying from the disease each day, the vast majority of them unvaccinated.

      Still, most states continue to experience “high transmission,” per the CDC’s categories. Hawaii, Florida, and Alabama, three states that saw intense Delta surges in recent months, have now joined California and Connecticut in crossing the threshold to “substantial transmission”—with under 100 new cases for every 100,000 people in the past week, according to the latest Community Profile Report.

      Alaska, Montana, and Wyoming remain the most intense hotspots, with over 500 new cases for every 100,000 people in the past week. In Alaska, hospitals are still in crisis mode, with doctors forced to choose which patients they must prioritize for care. All three states are seeing case rates decrease, though, indicating that they may be past the peak of their surges.

      While cases among children are trending slightly downward as well, the number remains much higher than at other points in the pandemic. In the week ending October 7, cases among children represented about one in four COVID-19 cases reported in the U.S., according to the American Academy of Pediatrics.

      Vaccinations continue to be dominated by booster shots, with boosters making up between one-third and half of the doses administered each day this week. Already, 14% of U.S. seniors have received a booster dose, according to the CDC. 5% of the US population overall has received a booster dose. These numbers will only increase as Moderna and J&J boosters are authorized, following FDA advisory committee recommendations. (More on that later in today’s issue.)

    • COVID source callout: Booster shot trends

      COVID source callout: Booster shot trends

      It’s now been almost two months since the CDC approved third vaccine doses for patients with weakened immune systems—and over two weeks since the agency approved third Pfizer doses for patients with increased breakthrough case risk. Since August 13, the CDC’s dashboard says, about 7.3 million Americans have received a third dose.

      As I mentioned in today’s National Numbers post, these booster shots are obfuscating the country’s vaccination trends. Over one million people have been vaccinated every day for the past week, but roughly half of those people were getting their booster shots.

      One might think I am sourcing that daily booster shot number from the CDC dashboard, but no: it comes, as many key COVID-19 data updates do these days, from the Twitter account of White House COVID-19 Data Director Cyrus Shahpar. The CDC has yet to add any booster shot data to its dashboard beyond a total count of doses administered.

      Shahpar’s daily updates. Screenshot taken on October 9.

      Much as I appreciate Shahpar’s daily updates, I would like to see the agency add those daily booster shot counts to its dashboard. And why stop there? The CDC should also provide information on the demographics of those getting booster shots, such as age and race/ethnicity, as well as geographic trends.

      Notably, the New York Times has added a booster shot trendline to its vaccination dashboard; see the chart titled “New reported people vaccinated.” As I noted last week, 15 states have added booster shots to their vaccine dashboards and reports as well, including three states that are reporting demographic breakdowns. The CDC is behind the data reporting curve, as usual.