Editor’s note, November 27: Check out my new publication: The Sick Times, a new nonprofit news site chronicling the Long Covid crisis.
After more than three years, 165 weekly newsletters, and a lot of number-crunching, this is the last issue of the COVID-19 Data Dispatch. I am bidding farewell to this publication, with immense gratitude to everyone who has supported it. But this isn’t the last newsletter you’ll get from me about COVID-19 research and data; more on that below.
I’m ending the COVID-19 Data Dispatch for three reasons. First, there is simply less day-to-day COVID-19 data news these days than there was early in the pandemic. When I started writing this publication in summer 2020, there was a constant stream of data issues to explain, new resources coming online, confusing trends, and more. The stream has slowed a lot in the last year, especially after the federal public health emergency ended in May.
The COVID-19 pandemic certainly isn’t over, and COVID-19 is certainly still a significant health threat in the U.S. and all over the world. Millions of people continue to get this disease every week, of whom thousands go to the hospital, hundreds die, and many more are left with Long COVID. However, the specific focus area that I chose for this publication—data and surveillance—is no longer an active topic requiring dedicated coverage. Post-health emergency, U.S. data systems have settled into tracking COVID-19 with a similar lack of urgency to their tracking of other seasonal diseases, leaving me with less to write about on a weekly basis.
Second, writing a publication solo is a lot of work, and I’ve felt myself inching closer to burnout in recent months. I’ve primarily written the CDD on weekends, in my spare time from freelance projects. When I started this newsletter, the process worked well because CDD topics often lent themselves to later freelance articles and vice versa. These days, there’s less overlap, as media publications are less interested in COVID-19 news. While I’ve appreciated having this space to keep covering the topic, it has taken more time and energy to figure out what I’m writing from week to week. The weekly newsletter has felt less like a “passion project,” and more like a chore, which is always a red flag for me.
And the third reason is the most important: I’m getting ready to transition into a new publication. In the new publication, I will continue covering COVID-19—but with a new focus area. I’m also transitioning from a solo project to one with a team, which we hope will grow as the project receives donations and grant funding. I’m not sharing too many details here because this publication hasn’t been announced publicly yet, but you can expect to learn more about it soon.
Specifically: if you’re a COVID-19 Data Dispatch newsletter subscriber, expect an email from me in the coming days introducing my new publication. You’ll be welcome to unsubscribe from my emails if you aren’t interested in the new project; though I hope you’ll find that it will serve to help you navigate the continued pandemic just as the CDD has.
In the meantime, feel free to email me with any questions or concerns you have. And thank you for all the support over the last three years—for the comments, the questions, the donations, and the building of a small community that refuses to simply move on from the ongoing COVID-19 crisis. Thank you.
For the journalists and communicators reading this: have you ever been interested in using a dataset to tell a story, but weren’t sure which tools to use or how to get started with the project? Or are you curious about how data journalists find datasets for their reporting, and turn those numbers into accessible, visual stories? Or are you an editor who sometimes works with data journalists and would like to better understand their tools and methods to improve your collaboration?
If any of this sounds familiar, you might be interested in a workshop that I will be running with The Open Notebook on October 31 that will cover reporting and producing data stories about science topics. For those unfamiliar with The Open Notebook, it’s a nonprofit site that provides excellent training and educational materials for science journalists, including articles, mentoring programs, a book, and workshops like this one. The workshop will build on an article I wrote for TONa couple of years ago.
The full description of the workshop is below. It will take place on October 31 from 3:30 to 5 PM Eastern time. Tickets are $125, though discounted tickets are also available for those who need them. Feel free to email me if you have any questions about the event!
Science writers are used to encountering data, whether we’re reading through dense scientific papers or trying to figure out what a statistic means for our readers. But sometimes, datasets themselves can be sources for stories—and they have led to some of the most widely read science stories of the last few years, from El Pais’ visualization of coronavirus spread to ProPublica’s investigation of burning sugar cane. Datasets can help us make complex topics accessible, visualize patterns from research, or even investigate instances of wrongdoing.
A science writer interested in pursuing stories like these could find a wide variety of resources to help them get started on a data project. But the growing data journalism field can be overwhelming: you might not be sure how to pick an initial project, which online course to try, which tools to use, or whether you need to learn how to code first. (Spoiler alert: you don’t!)
This 90-minute hands-on workshop from The Open Notebook, building on the instructor’s TON article about this topic, will provide a crash course in data reporting basics. It’s designed for science writers who are interested in pursuing data stories but aren’t quite sure how to get started, and for editors who are interested in working with writers on these stories.
You’ll get an introduction to all of the steps of reporting and producing a data story, from finding story ideas to editing and fact-checking. The workshop will include an interactive tutorial showcasing two common tools that you can start using immediately.
You will learn how to:
Recognize potential data stories on your beat Search for public datasets that you can use Use free tools for data analysis and visualization Work with a data team or independently as a freelancer Make your data stories accessible
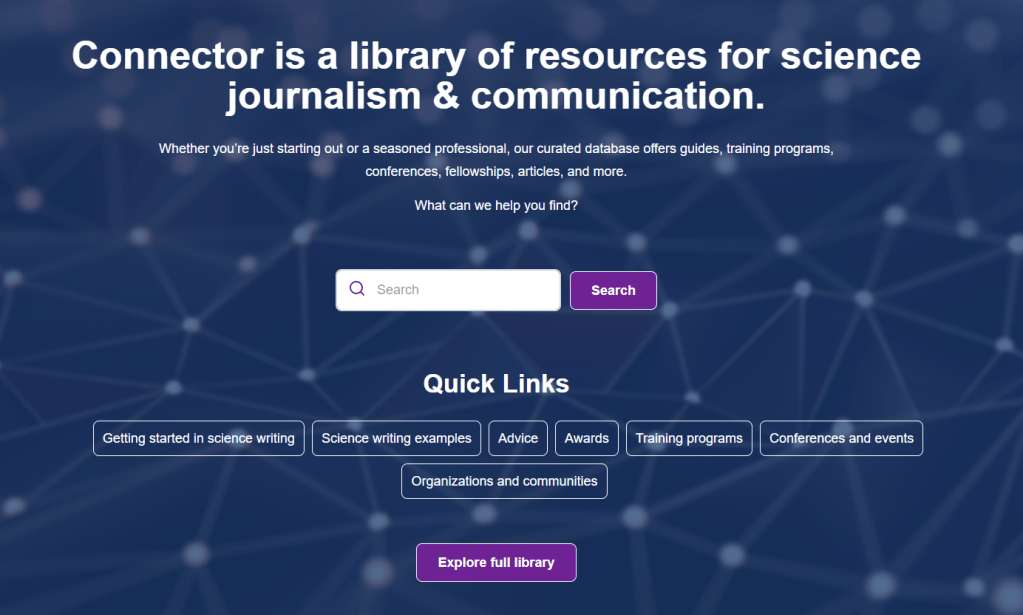
For the last few months, I’ve been working with the Council for the Advancement of Science Writing (CASW) on a new resource website for science journalists and communicators. The site launched this past week, and I’m sharing it here because I think it might be useful for a lot of COVID-19 Data Dispatch readers.
Here’s a bit of info about the new website:
CASW Connector is a curated library of resources on science journalism and communication, including articles, guides, training programs, conferences, fellowships, career advice, and more.
The site aims to bring together resources from organizations, centers, and disciplines from around the internet that all serve the same goal: promoting excellence in communication about science to the public.
CASW Connector is for journalists, scientists, communicators, educators, students, and anyone interested in sharing science with the public. You can search or browse resources handpicked by our team and suggested by our readers, and you can keep tabs on upcoming events and deadlines. You can even submit your own suggestions of events and resources you would like us to include.
Later this summer, CASW Connector will launch a newsletter featuring short articles, announcements and updates; subscribe now to receive the first issues. And later this year we’ll launch a webinar series that is, like Connector itself, devoted to excellence in science writing and communication.
We hope you’ll check Connector out, and share it with friends and colleagues! We welcome any feedback or suggestions you may have; drop us a line at connector@casw.org to tell us what you think!
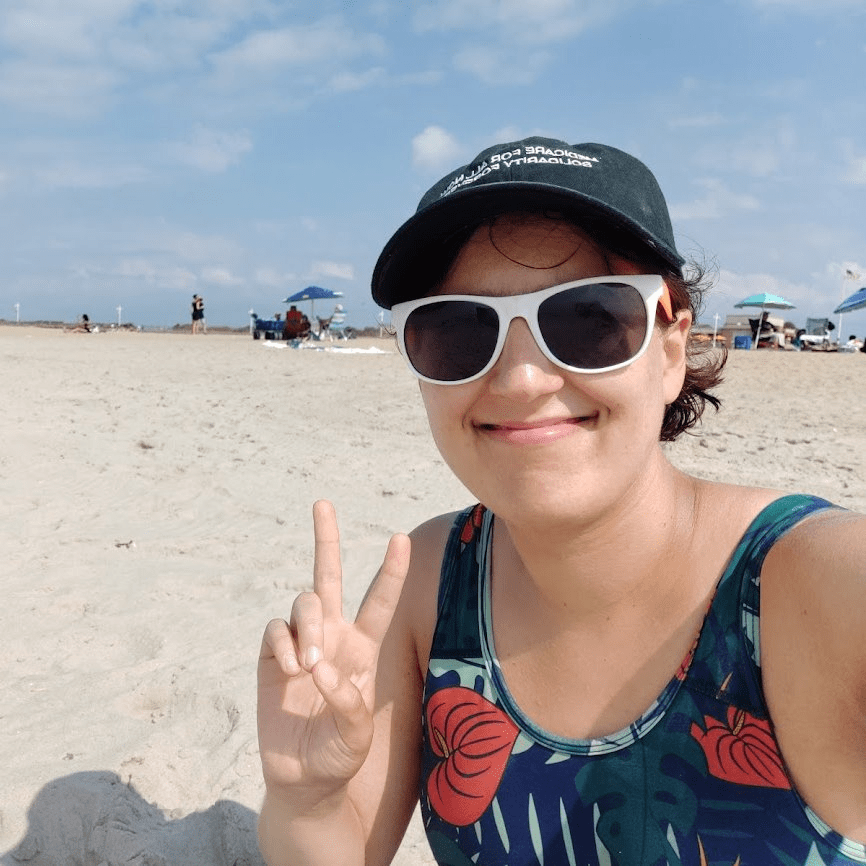
Betsy and her partner’s portable HEPA filter, pictured on the train from Berlin to Brussels. Her partner (in an N95 mask) is visible in the background.
A few days ago, my partner and I returned home from a two-week vacation to several cities in Europe. It was our first time traveling internationally since before the COVID-19 pandemic, and the trip required a lot of time on planes, on public transportation, and in crowded spaces.
I’m sharing what we did to reduce our risk of COVID-19 (and other common pathogens!) during the trip, in the hope that this will be helpful for readers traveling this summer. While taking these sorts of precautions may be increasingly unpopular in many places, these measures still reduce the risk of illness for individual travelers and the people around them.
Here’s what we did:
Reduced potential exposure and tested before we traveled: It’s pretty typical for me to avoid crowds and indoor events prior to traveling. In this case, my partner and I did attend Pride marches in New York City the weekend before our trip, but we only attended outdoor events and wore masks in the crowds to reduce our risk. We also both got PCR tests the day before leaving (we’re lucky to live near one of the few public testing sites in the city that are still open).
Masked indoors, with high-quality masks: I consistently wore N95 masks on the trip, including my reusable respirator on planes. (I wrote more about my respirator in this post last summer.) My partner also wore an N95 or KN95 throughout the trip. We have different preferences for which masks fit us well, so we had a few masks of different brands packed to accommodate that.
Avoided indoor dining (as much as possible): All of our meals were outdoors. My partner is vegan, so any restaurant where we ate had to fit into a Venn diagram of “vegan options” plus “outdoor seating”; this might sound challenging to find, but with a bit of planning—and with thanks to the Happy Cow app—it was actually quite doable. We had to eat briefly on planes at a couple of points, but we minimized that time as much as possible (eg. masking in between bites) and did so only when plane air filtration systems were going.
Took advantage of smoking sections: European cities tend to have a more prominent smoking culture than the U.S., so many restaurants and bars have outdoor smoking sections. This can be a tricky situation for COVID-cautious travelers; yes, you’re outside, but you’re also breathing in a lot of second-hand smoke. Still, my partner and I found these sections to be a helpful option. We even had lunch in an outdoor smoking zone at the Keflavik Airport (in Iceland) during a layover on our way home to NYC.
Used a CO2 monitor to gauge ventilation in some spaces: I am a proud owner of an Aranet CO2 monitor, which I mostly use to track ventilation at my apartment and public spaces in NYC. I brought the monitor on the trip, and used it to identify which public buildings had better air quality. For example, train platforms at Berlin Hauptbahnhof (the city’s central train station) are open to outdoor air and have frequent airflow, as evidenced by a CO2 reading I took of 611 ppm—well within the Aranet monitor’s “green zone.” So, I felt comfortable taking off my mask there for a few minutes to drink coffee.
Used a HEPA filter on trains, hotel rooms: My partner and I have a personal, portable HEPA filter that runs on a battery and fits easily in my duffel bag. I brought it along on the trip and used it a few times, mostly on crowded trains and in hotel rooms that did not have great airflow. It also doubled as an extra fan in our Airbnb in Amsterdam (which was not air-conditioned).
Rapid-tested every two days: Over the two weeks of traveling, my partner and I took a rapid test every two days to check for any developing illness. We also requested testing from friends and family members with whom we spent time indoors, such as a friend whom we stayed with in Berlin.
Testing and symptom monitoring after getting home: Since arriving home in NYC on Wednesday evening, my partner and I have each gotten PCR tests. I also rapid-tested once, as an extra check before attending an event on Thursday. We’re planning to do another round of PCR testing next week and monitor for any symptoms; so far, we haven’t seen any signs of illness.
I acknowledge that these safety measures may sound like a lot of effort. Certainly, tools like rapid tests and a personal HEPA filter cost money, and may not be accessible to many people. And in an ideal world, everyone would be able to travel in a world where these tools are free and commonplace, rather than a reason for extra advanced planning.
There are also increasing social pressures to not take precautions, especially in some of the places that we visited. I had a few conversations with strangers who insisted I was strange for wearing an N95, that COVID-19 was “over”; I was even patted down and pulled into a security screening at the Amsterdam airport by guards who decided my respirator was suspicious.
I am the kind of person who doesn’t back down to this pressure, especially when I have the research and reporting to back up my convictions. But I don’t want to be an isolated person taking precautions in a sea of others who aren’t acting to protect public health.
Broader change is really needed; in the meantime, though, I hope my experience is informative for others. If you are also traveling this summer and you have other tips you’d like to share with the COVID-19 Data Dispatch community, please send them to me! You can email me or comment on this post.
This is my first COVID-19 Data Dispatch issue after my August hiatus! Here are a few updates on how that went and changes I’m thinking about for the publication going forward.
First off, I owe a big thank you to everyone who reached out with well wishes on this break. After two years without missing a single week of publication, I was (perhaps irrationally) nervous that some readers would be upset that I was taking off for a bit. But that didn’t happen! I appreciate everyone’s understanding and patience.
Besides a few hours at my part-time job (MuckRock’s Documenting COVID-19 project) and one day of poll working for New York City’s August primary, I didn’t work at all between August 4 and August 29. Here are a few fun things I did instead:
Spent a lot of time outside (mostly at various beaches and NYC parks);
Biked in every NYC borough (longest trip: to Van Cortlandt Park and Woodlawn Cemetery in the Bronx);
Read three books (highly recommend “An Immense World” by Ed Yong!);
Drafted most of a long fanfiction project;
Watched a lot of Star Trek: The Original Series.
If you’re curious about the logistics of taking a longer vacation as a freelancer, you can check out this Twitter thread I wrote last week:
today was my first day back at work after a break of over three weeks — my longest vacation in a while! I wanted to share a bit about why & how I did this. freelance transparency thread incoming: 🧵(1/12) pic.twitter.com/BAIDkim4GU
The break was really all that I had hoped it would be: a refreshing step away from constant COVID-19 coverage that allowed me to reflect on why I do this job. With the COVID-19 Data Dispatch and my other work, I aim to give readers the information they need to make individual health decisions, while also thinking about how they fit into broader communities. While my work has evolved a lot over the last two years, that basic tenet hasn’t changed.
At the same time, though, my hiatus made me think more about how I can balance the newsletter and blog with other activities that are important for maintaining my mental health: getting off my computer, spending time outside, non-journalism writing, investing in new skills, and so on. I’m probably not unlike other independent creators when I say there are weeks when writing this newsletter/blog feels more like a chore than a useful service; I want to keep it feeling like the latter.
With that in mind, here are a few shifts I’m thinking about for the coming months:
The “National numbers” and “Sources and updates” sections will stay consistent. In considering this project’s format, I knew that these two sections are particularly valuable for readers (and they tend to be fairly straightforward for me to write). So, don’t expect any big changes here.
Shorter posts. As any editor who’s worked with me could tell you, I am a writer who constantly goes over my assigned word count. And when I have no set word count, as is the case for these issues… They often get quite long, even though I know that shorter summaries tend to be more helpful for readers. In the future, I’m aiming to keep posts shorter, and only write a longer explainer or commentary when it seems actually necessary.
More reader engagement. We continue to be in a confusing phase of the pandemic, with less reliable data or reliable guidance. I want to prioritize answering your questions. To that end, I’ve made an anonymous Google form for submitting COVID-19 queries. It’ll be linked in every issue going forward and on the website’s homepage. While you can still reply to emails too, I hope this will be an easier way to send me ideas for topics I should cover.
Potential events and multimedia: As older readers may remember, in spring 2021, the COVID-19 Data Dispatch ran a series of virtual data workshops— which I really enjoyed putting together! I’m thinking about more possible virtual events for the future, as well as ideas for new content formats (maybe a podcast miniseries? should I do explainers on TikTok?). I’d love to hear from you, readers, if there’s anything in particular you want to see here.
Expanding beyond COVID-19: Between the continued monkeypox outbreak, the resurgence of polio in New York, and plenty of climate disasters this summer, it’s clear that COVID-19 is far from our only public health concern right now. While my projects in the immediate future are still mostly COVID-focused, you might see some other public health and data information creep into newsletters/blogs going forward. (For example, this week’s “Sources and updates” section includes a couple of non-COVID items.)
Occasional breaks. While I have no intention of making like the CDC and pausing my newsletter for any federal holiday, you can expect that the COVID-19 Data Dispatch will not run every single weekend going forward. Like, I’ll take Christmas off. Reasonable stuff.
None of these are particularly major changes, but in the spirit of transparency, I wanted to share what I’m thinking about with all of you. As always, comments or questions are very welcome: just shoot me an email or fill out the new anonymous question form.
On July 26, 2020, I sent out the first COVID-19 Data Dispatch newsletter. In the two years since that day, I have sent newsletters (and published blog posts) every Sunday, with no breaks. I’ve posted from vacations, over holidays, and on days when I was exhausted or approaching burnout.
While this schedule has felt punishing at times, I’m proud of it. The coronavirus doesn’t care about holiday schedules, after all, and I enjoy maintaining regular updates for the readers relying on this publication as a key source of COVID-19 news. (Also, not many writers can say they’re more consistent than the CDC.)
But even I have to admit that two years without breaks is a long time. When I’m scrambling to send out an issue every Sunday, it’s difficult to reflect on key questions, like, “Is my current posting format meeting readers’ needs?” and, “What does helpful COVID-19 coverage look like right now?” I wouldn’t call myself burned out, but at a few points in the last few months, I have felt like I’m operating on autopilot: writing around 3,000 words every weekend because it’s my routine, without evaluating how I might improve that routine.
This is a rather longwinded way of announcing that I’m about to take a break from the COVID-19 Data Dispatch. August 2022 will be a brief hiatus: over the next four weeks, I won’t write any newsletters or blog posts. I’m also taking this month off of freelancing and working fewer hours at my part-time job, making it basically the longest vacation I’ve had since graduating college.
I plan to use this time to reflect on this project’s future, including potential format and content changes that might make it easier for me to maintain long-term. I’m also going to reflect on some potential CDD side projects—more resources, events, even a podcast idea?—that I haven’t had the bandwidth to pursue while producing weekly issues.
Readers: if you have any feedback for me, please reach out! I would love to hear from you about the topics and formats you’d find helpful at this point in the pandemic.
I also wanted to share some tips for keeping track of COVID-19 data while this publication is on a break, as I’m very aware that we are still in an active surge across the country. (This post is also responding to a reader question that I received from a fellow data reporter last week, after I announced this upcoming break in the newsletter.)
Look at multiple data sources or metrics.
COVID-19 case data, once our best window into the virus’ spread, are becoming much less reliable thanks to a decline in PCR testing. Other singular metrics have their own flaws: hospitalization numbers often lump together patients admitted for severe COVID-19 symptoms with those who tested positive while admitted for other reasons; wastewater data are unevenly reported across the country and can be hard to interpret; death data lag significantly behind transmission trends, and so on.
As a result, it’s important to check a few different metrics rather than relying on just one. For example, you might notice that my “National numbers” posts these days typically cite cases, hospital admissions, and wastewater together to identify national trends.
Similarly, if I were trying to identify what’s going on in New York City, where I live, I would likely look at: case and test positivity data from the city health department, cases in public schools (which include positive at-home test results) compiled by the department of education, and wastewater data from Biobot, focusing on the northeast region and counties in the greater NYC area.
Case rates are still useful, if we acknowledge that they are undercounts.
Hospitalization rates are useful, particularly new hospital admissions.
The CDC’s old transmission level guidance is still actually pretty helpful for guiding health policies, especially for vulnerable populations.
Look at wastewater surveillance, if it’s available in your area.
The COVID Cast dashboard, from Carnegie Mellon University’s Delphi Group, is another helpful source.
Look at multi-week trends.
Just as you don’t want to rely on a single metric, you shouldn’t look at only one week of data. (Looking at just one or two days at a time is an even worse idea.) This has always been a good rule for interpreting COVID-19 numbers, but it’s even more true now, as many public health departments have fewer resources devoted to tracking COVID-19—and may take more time to compile data for a given day or week.
For example, the New York City health department’s daily updates to its COVID-19 dashboard frequently include changes to case numbers for prior days, in addition to new data for the past day. Experts call this “backdating”: in a data update on a Friday, new cases might be dated back to other days earlier in the week, changing broader trends.
Keep in mind data reporting schedules.
You especially need to be wary of backdating when there’s a holiday or some other interruption in reporting. For this reason, it’s important to keep track of reporting schedules: know when a health department is and is not updating their data, and interpret the data accordingly.
The biggest example of this is that most state and local health departments—and the CDC itself—are no longer updating COVID-19 data on weekends. In most places, every Saturday and Sunday is now essentially a mini-holiday, with numbers from those days incorporated into backdated updates on Mondays. (And then edited in further backdated updates on later weekdays.)
When I volunteered at the COVID Tracking Project, we regularly observed lower COVID-19 numbers on weekends, followed by increases towards the middle of the week when states “caught up” on cases that they didn’t report over the weekend. You can read more about this trend here; I suspect it has only become more pronounced as more places take weekends off.
Acknowledge uncertainty in the data.
This is the most important recommendation I can give you. Every COVID-19 number you see comes with a margin of error. Sometimes, we can approximate that margin of error: for example, we can estimate how far official COVID-19 death statistics might be off by looking at excess deaths. Sometimes, we really can’t: estimates of how far official case numbers might be off range from a factor of three to a factor of thirty.
As a result, it’s often helpful to look at trends in the data, rather than trying to approximate exactly how many people in your town or county have COVID-19 right now. Is transmission trending up or down? Are you at high risk of encountering the coronavirus if you go to a large gathering? These questions can still be answered, but the answers will never be as precise as we’d like.
Follow leaders from your local healthcare system.
To augment official data sources, I often find it helpful to see what people in healthcare settings are saying about COVID-19 trends. Experts like Dr. Craig Spencer (who works in an ER in NYC) and Dr. Bob Wachter (who leads the University of California San Francisco’s department of medicine) frequently share updates about what they’re seeing in their practices. This kind of anecdotal evidence can help back up trends in case or hospitalization data.
In a similar vein, you can look to essential workers in your community, like teachers and food service workers, as early indicators for transmission trends. If NYC teachers and parents are talking about more cases in their schools, for example, I know COVID-19 spread is increasing—because schools are often sources for transmission in the broader community.
Keep your goals in mind.
As you monitor COVID-19 numbers, it’s important to remember why this information is valuable. What are you using the numbers for? Are you making choices about when to put a mask on, or when to rapid test before a gathering? Are there high-risk people in your family or your broader social network whom you’re trying to protect? Or, if you’re a journalist, what questions are you trying to help your readers answer?
Keeping track of COVID-19 data and news can feel like a large burden, especially when it seems like so many people have entirely forgotten about the pandemic. I always find it helpful to remember why I do this: to stay informed about this ongoing health crisis, and to keep others in my community safe.
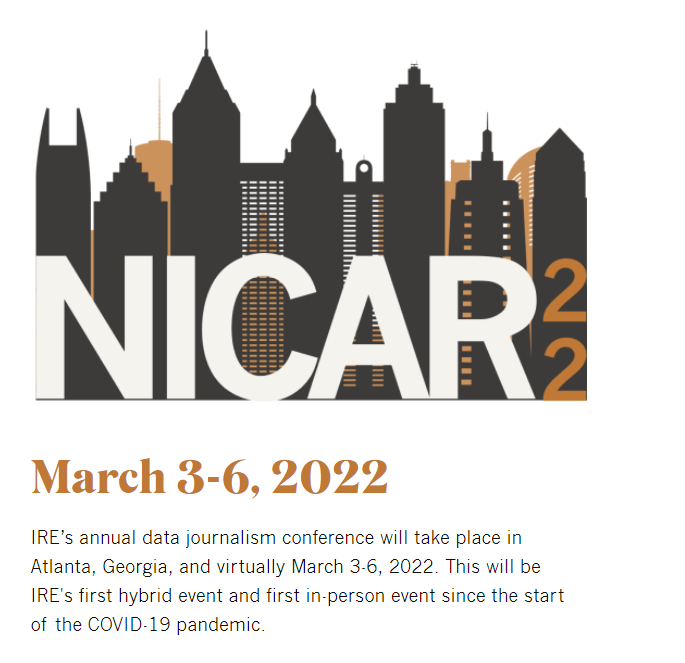
This time next week, I’ll be at NICAR 2022—the Investigative Reporters and Editors’ annual data journalism conference. And I do mean “at”: though the conference this year will be held in a hybrid format with both in-person and virtual options, I’ve chosen to travel for the in-person sessions in Atlanta, Georgia.
It will be my first in-person conference and my second time traveling via airplane since February 2020. While I’m nervous about the travel and the gathering, I feel confident in the conference’s COVID-19 protocols (requiring full vaccination and boosters, plus indoor masking), in low transmission levels at both my origin and destination, and in my own ability to wear high-quality masks and utilize rapid tests as I go. (I wrote about precautions that I took on my first pandemic-era airplane trip in a post last summer.)
I chose to attend NICAR in-person to better take advantage of data journalism skills sessions—and, of course, in-person networking! If you’re planning to attend and would like to meet up, please reach out: email me, hit me up on Twitter, etc.
Also, for folks attending in-person or tuning in virtually, I’m excited to share that I’ll be a panelist at a conference session discussing the use of data for solutions journalism. The session’s moderator is Matt Kauffman, who leads data reporting at the Solutions Journalism Network. Dedicated readers might remember that the Solutions Journalism Network supported my Opening project last summer; I’ll be discussing my work on that project (which provided lessons from public schools that safely reopened during the 2020-2021 school year) and other solutions-related reporting at this session.
The session is scheduled for next Saturday, March 5, from 3:45 to 5 PM Eastern time, and will be livestreamed for virtual attendees. Here’s the full description:
Solutions journalism is rigorous, evidence-based reporting on responses to social problems. And data make for a great partner in solutions reporting, because when the impact of a response can be measured in numbers, it’s easy to discover the places that stand out and are worth a deeper look.
This session will explore the use of “positive deviants” – outliers in data that might point to a place or a program that has found a better way: the school district that cut the achievement gap by implementing specific policies; the state that applied new protocols in hospitals that significantly reduced the number of women who die in childbirth; the neighborhoods that have reversed environmental injustices and greatly improved urban tree canopy. Stories like these attract readers and viewers, who are increasingly turned off by news coverage focused exclusively on failure.
Adding a solutions lens to traditional investigative reporting leads to better accountability journalism, and data can play a key role in that. This session will present an overview of solutions journalism and positive deviance, followed by tips from a reporter explaining how they used data in pursuit of a timely and critical solutions story: identifying school districts around the country that found ways to safely reopen schools during the pandemic.
Starting this week, I’m joining the team at Documenting COVID-19 on a part-time basis. Documenting COVID-19, for those unfamiliar, is an open-records project that makes pandemic data and records from all levels of the U.S. government available to journalists and researchers.
Project researchers also help journalists craft stories around these government records, contributing to investigative articles on topics ranging from death certificates to contact tracing challenges.
Documenting COVID-19 is run out of the Brown Institute for Media Innovation, a research institute run by Columbia and Stanford Universities; it’s been funded by the public records site MuckRock and other supporters.
The project is currently expanding to collect even more COVID-related documents and data, and I’m excited to be part of that expansion! I look forward to unearthing stories, collaborating with local newsrooms, developing my investigative skills, and generally working to hold U.S. institutions accountable for their pandemic failures.
And, for any local reporters reading this, if you have a story idea or project where you could use some assistance from Documenting COVID-19, let me know! (Email me, hit me up on Twitter, etc.)
Two Abbott BinaxNOW antigen tests used by Betsy and her sister during their trip, demonstrating single-line negative results.
As I mentioned in last week’s newsletter, I went on vacation during the last week of August. I traveled to California to visit my younger sister, who was living there over the summer for an internship. We spent a couple of days in the Bay Area, then drove to Southern California, hit a few different destinations, and finally flew out of Los Angeles International Airport (LAX).
Both my sister and I are fully vaccinated, of course, but we still took a number of precautions to make our trip as safe as possible in light of the current COVID-19 surge. I wanted to share what we did in case it’s useful for others thinking about travel right now.
Key precautions included:
Limited exposure and tests before traveling: For ten days before my flight out to California, I avoided all unmasked indoor activities, including small gatherings with fully vaccinated friends. Closer to my flight, I also avoided other activities outside my home (grocery shopping, taking the subway, and the like). I got a PCR test at a NYC Health site two days before my flight, and didn’t leave my apartment between that test and heading out to the airport.
Rapid testing every two days during the trip: I carried three packs’ worth of Abbott BinaxNOW rapid antigen tests in my suitcase, and bought a couple more packs in California. Starting two days after I arrived, my sister and I tested ourselves every other day. While antigen tests like these are more likely to give you a false negative than PCR tests, testing frequently increases your chances of catching a case—and catching it early in your disease progression, when you’re most likely to infect others. The tests were easy to incorporate into our routines, especially once we got used to the swabbing process.
Sticking to outdoor activities: Our trip included a lot of outside time: hiking in a redwood forest, hitting up Southern California beaches, camping for a night at Joshua Tree National Park, and lots of outdoor dining. The riskiest two activities of the week, we agreed, were an afternoon at Monterey Bay Aquarium and a day at Universal Studios in LA. But both of those establishments did a great job of reminding all patrons (including the vaccinated) to keep their masks on inside—following current mask regulations in the Bay Area and LA County.
Double-masking indoors: On both my flights and whenever I needed to be inside for a longer period of time, I wore two masks: a surgical mask and a fitted, multi-layer cloth mask. Studies suggest that cloth masks on their own are not the best option for protecting against Delta, but layering a cloth and surgical mask can increase protection. I especially like to layer masks because surgical masks typically don’t fit well on my face; when I add a cloth mask on top, the fit becomes much more snug.
Precautions when visiting relatives: My sister and I visited a few relatives over the course of our trip. For these visits, we basically followed the precautions that health experts recommended last Thanksgiving: eat outside whenever possible, mask up in common areas inside, open windows for extra ventilation, etc. We also organized the trip so that no visits occurred after Universal Studios, which we had deemed the riskiest activity of the week.
Extra testing after traveling: Flying out of LAX proved to be incredibly stressful, as neither the airport nor our airline put in effort to enforce mask guidance. My sister and I even gave extra masks to two fellow travelers at the check-in desk, because the airline apparently did not have any extras available. Because of this extra COVID-19 exposure risk, I did some extra testing upon my return to the East coast: daily rapid tests for two days in a row, followed by a PCR test.
hi @JetBlue! your mask availability and enforcement is apparently so bad that my sister and I had to literally GIVE TWO OF OUR OWN EXTRA MASKS to fellow travelers at the (very crowded) LAX check-in desk. this is extremely irresponsible in the face of the current covid surge.
Personally, this will probably be my last major trip for a while. Conferences that I’d planned to attend in the fall have been moved to all-virtual formats, and I’m lucky to live close enough to my parents that I don’t need a flight to see them for the holidays. If I were to travel again, though, I’d likely follow these same precautions—with adjustments based on COVID-19 infection rates at my destination. Also, I would probably avoid LAX.
Shout-out to my friend Raquel for both taking this picture and giving me a pre-photo haircut.
This will be my final week at my day job, the data journalism publication Stacker. I do not have another staff job lined up. Instead, I’ll be freelancing and working on the COVID-19 Data Dispatch full-time.
Why this move
I’ve worked at Stacker for over three years now. I started as an intern in January 2018, then was hired on as a data journalist when I graduated college. The job taught me so much of what I now know about data reporting, from VLOOKUPs and pivot tables to the mindset I needed to really interrogate a dataset and figure out what stories may be told.
I’m incredibly grateful to my colleagues at Stacker—especially Sam Gross, who has been my supervisor and mentor since I started. He supported me as I got up to speed on data reporting, built a science and health vertical, and managed our COVID-19 coverage. I’m also grateful to have had the flexibility to pursue freelance projects and start the CDD while working full-time there.
But I’m committed to the COVID-19 beat—and beyond that, the wider public health beat—and it’s become clear to me that, to continue on this path, I need the time and bandwidth to pursue more stories outside of Stacker’s capacity.
Also, I have to be honest here: I’ve come really close to burnout in the last few months. Stacker, running the CDD, volunteering at the COVID Tracking Project, additional freelance projects on top of that… It’s a lot. I’ve been working 40 hours a week at my day job, then spending all my nights and weekends working more. Reading, writing, analyzing, visualizing. Immersing myself in COVID-19 data. I’ve had little time for other creative writing, movie nights with my girlfriend, or basically anything else that would be a real break—and when I did take a night off, I’d feel guilty for not working. I haven’t had a break longer than, like, four days since February 2020.
This shit isn’t sustainable! I spent a few weeks earlier in 2021 looking for another staff job; but after a few interviews, I realized that even with a full-time gig that aligned more closely with my desired beat, I’d still take time out of my “non-working hours” to work more. Another staff job would just drive me deeper into burnout.
My choice to go independent will, I hope, enable me to spend my time more intentionally. I want to actually work 40-hour weeks, instead of 60+ hour weeks. In addition to seeking out new projects and opportunities for the CDD, I’m aiming to spend time learning Python and other coding languages, developing my data viz skills, and reporting on new topics in the public health realm. (Also, NYC friends, you may see me out on the streets more.)
All this said, in the interest of transparency, I want to acknowledge the privilege I have that allows me to make this move. My parents paid for a large part of my college tuition; while I did take out a student loan, I paid my debt within a year of graduating. I am 24, young enough to stay on my mom’s health insurance for two more years. And I’ve been able to save up from Stacker and past freelance projects—nothing major, but enough to provide me with a sufficient cushion during this transition. Many young journalists would not be able to do what I am doing this spring.
I hope to give back to my early-career community in the coming months by offering a (paid) platform to other journalists whose voices may add to the CDD. Readers, you can support that goal by becoming a member… more on that option below.
What’s next
My last day at Stacker is this Thursday, April 22. Starting in May, I’ll be officially open for freelance work.
For the potential future clients reading this: Hi! Here’s some of the work I can do for you:
Data journalism stories on science and health topics, both short-form/news and long-form/features
Data analysis and visualizations (Tableau, Flourish, Datawrapper, etc.)
Content writing for science/health nonprofits
Webinar planning/virtual event management
If you’d like to work with me, hit me up at betsy@coviddatadispatch.com, or schedule a meeting on my Calendly page. This also goes for anyone who would like to collaborate with the COVID-19 Data Dispatch on anything pandemic data-related.
Meanwhile! My new independence will allow me to spend time implementing a lot of the CDD ideas I’ve failed to act on (or half-assed) in recent months. Current members, expect some Slack revamping and one-on-one reach-outs. Everyone, expect more reader surveys, data resources, events, and more.
If you have any ideas for CDD projects or other ways you think I should be spending my time, please reply to this email!
And, if you’d like to support me during this exciting and terrifying career move, here are three things you can do:
Share the CDD with a friend whom you think might find it useful. Help me grow the community of data nerds (and data novices) around this publication! It’s as simple as forwarding this issue—or any issue you’ve loved in the past few weeks.
Become a member. Your regular contribution (suggested $10/month, or pay-what-you-will starting at $2/month) will help me devote more time and resources to the CDD by making this project more financially sustainable. You can find the publication’s current costs here, but in the coming months I hope to hire a regular editor, solicit pitches from outside writers, produce further events, and more.
Buy me a coffee. If you’d like to contribute to the CDD but can’t commit to membership right now, I get it! These are, by all definitions, unprecedented times. But every dollar helps, and I’m deeply appreciative of those who have donated through my Ko-fi page.
As vaccinations increase in the U.S. but outbreaks surge elsewhere in the world, it will be a challenging time to remain on the COVID-19 beat—and I intend to. I’ll be relying on you, loyal readers, to ask me questions and shape my coverage in the months to come.
Also, you may expect to see more posts here that supplement my freelance work: behind-the-scenes reporting notes, interviews with sources, data visualizations, commentary, and more. If there’s anything that particularly interests you about a COVID-19 story I do, don’t hesitate to reach out!
Starting a sustainable media business has been a goal of mine since college. The CDD might be that business, or it might lead me into something bigger. But with this move, I’m done pursuing that goal halfway during my nights and weekends. I’m diving in headfirst. And I’m grateful to have all of you along for the ride.
And a P.S.
Stacker is hiring right now! If you’re a budding data journalist with an eye for research and an immense curiosity for new topics, my soon-to-be old job might be a good fit for you. Here’s the job posting, reach out if you have questions.