A study published in the CDC’s own journal indicated that about half of people infected with Omicron are still contagious 5-10 days after their isolation period starts. Chart via CDC MMWR.
Maybe it’s because I’m a twenty-something living in the Northeast, but: quite a few of my friends have gotten COVID-19 in the last couple of weeks. The number of messages and social media posts I’m seeing about positive rapid tests isn’t at the level it was during the Omicron surge, but it’s notable enough to inspire today’s review of the CDC’s isolation guidance.
Remember how, in December, the CDC changed its recommendations for people who’d tested positive for COVID-19 to isolating for only five days instead of ten? And a bunch of experts were like, “Wait a second, I’m not sure if that’s sound science?” Well, studies since this guidance was changed have shown that, actually, a lot of people with COVID-19 are still contagious after five days. Yet the CDC has not revised its guidance at all.
(Also, to make sure we’re clear on the terms: isolation means avoiding all other human beings because you know that you have a contagious disease and don’t want to infect others. Quarantine means avoiding other humans because you might have the disease, due to close contact with someone who does or another reason for suspicion.)
The current CDC guidance still says that, if you test positive: “Stay home for 5 days and isolate from others in your home.” Yet, in recent weeks, I’ve had a couple of friends ask me: “Hey, so it’s been five days, but… I’m not sure I’m ready to rejoin society. Should I take a rapid test or something?”
Yes. The answer is yes. Let’s unpack this.
Studies indicating contagiousness after five days
As this NPR article on isolating with Omicron points out, the CDC guidance was “largely based on data from prior variants.” At the time of this five-day recommendation, in late December, scientists were still learning about how Omicron compared to Delta, Alpha, and so on, particularly examining the mechanisms for its faster spread and lower severity.
But now, almost four months later, we know more about Omicron. This version of the coronavirus, research suggests, is more capable of multiplying in the upper respiratory tract than other variants. People infected with Omicron are able to spread the virus within a shorter time compared to past strains, and they are able to spread it for a higher number of days—even if their symptoms are mild.
One study that demonstrates this pattern is a preprint describing Omicron infections among National Basketball Association (NBA) players, compared to cases earlier in 2021. Researchers at Harvard’s and Yale’s public health schools, along with other collaborators, compared 97 Omicron cases to 107 Delta cases. NBA players are a great study subject for this type of research, because their association mandates frequent testing (including multiple tests over the course of a player’s infection).
The big finding: five days after their Omicron infections started, about half of the basketball players were still testing positive with a PCR test—and showing significant viral load, indicating contagiousness. 25% were still contagious on day six, and 13% were still contagious on day seven. These patients also saw less of a consistent pattern in the time it took to reach their peak contagiousness than the players infected with Delta.
From the NPR article:
“For some people with omicron, it happens very, very fast. They turn positive and then they hit their peak very quickly. For others, it takes many days” – up to eight or even 10 days after turning positive, says the study’s senior author, Dr. Yonatan Grad, an associate professor of immunology and infectious diseases at the Harvard T.H. Chan School of Public Health.
While this NBA study is a preprint, other research has backed up its findings. One study from Japan, shared as a “preliminary report” in January, found that people infected with Omicron had the highest levels of viral RNA—indicating their highest levels of contagiousness—between three and six days after their symptoms started. The researchers saw a “marked decrease” in viral RNA only after ten days.
Another preprint, from researchers at the University of Chicago (and antigen test proponent Michael Mina), examined Omicron infections among healthcare workers at the university medical center. Out of 309 rapid antigen tests performed on 260 healthcare workers, 134 (or about 43%) were positive results received five to ten days after these workers started experiencing symptoms.
The highest test positivity rate for these workers, according to the study, was “among HCW returning for their first test on day 6 (58%).” In other words, more than half of the workers were still infectious six days after their infection began, even though the CDC guidance would’ve allowed them to return to work.
Later in February, a study in the CDC’s Morbidity and Mortality Weekly Report (MMWR)—or, the CDC’s own journal—shared similar results. The report, authored by CDC researchers and practitioners at a healthcare system in rural Alaska, looked at antigen test results from hundreds of infections reported to this health system during the Omicron wave.
The main finding: between five and nine days after patients were diagnosed with COVID-19, 54% (396 out of 729 patients) tested positive on rapid antigen tests. “Antigen tests might be a useful tool to guide recommendations for isolation after SARS-CoV-2 infection,” the authors wrote.
News@CDCgov publishing its own results showing how POOR their own guidance is surrounding leaving isolation at 5 days w/out a negative rapid test
When starting isolation bc of symptoms:
65%-80% Rapid Ag test Pos at days 5-7 40% Pos through day 9!
Like past research, this study found that over half of patients (with both Omicron and Delta) were still contagious five days into their infections. About one-fourth were still contagious at day eight.
Guidance for people testing positive
All of the above studies suggest similar conclusions: about half of people infected with Omicron will still be contagious five days after their positive test results or the start of their symptoms, despite what the CDC’s guidance says. If you get infected with BA.2 in the coming surge, the best way to figure out whether you’re contagious after day five is by taking a rapid antigen test.
In fact, for the highest accuracy (and peace of mind), I’d recommend taking two antigen tests, two days in a row. If both are negative, then you’re probably good to return to society—but maybe don’t travel to visit an elderly relative just yet.
Seeing a lot of “rapid tests don’t work against BA.2” takes and it’s hard to see that as anything but one more capitulation.
Rapid tests are not perfect. However, they still do work & are arguably more important at this stage of the pandemic than they’ve ever been.
— Dr. Angela Rasmussen (@angie_rasmussen) April 12, 2022
This two-rapid-test guidance comes from the U.K. Health Security Agency, which recommended in December that Brits could isolate for seven days instead of ten if they tested negative on days six and seven of their isolation. (The U.K.’s guidance has since become more lenient, but this is still a good rule for reference—more based in science than the CDC’s guidance.)
What else should you do if you test positive? Here are a few recommendations that I’ve been giving friends and family:
Be prepared to isolate for a week or two, even if you may be able to leave isolation after a shorter period (with rapid tests).
After leaving isolation, wear a good mask (i.e. an N95 or KN95) in all public spaces.
There’s also the HHS Test to Treat program, which allows people to get tested for COVID-19 and receive treatment in one pharmacy visit. This program has faced a pretty uneven rollout so far, though.
As 2021 comes to a close, I want to dedicate this final issue of the year to all of the other science, health, and data journalists who have continued following COVID-19 in the last twelve months. It hasn’t been easy, as burnout dovetails with declining public interest in pandemic news; still, so many people have stuck with this beat and brought important issues to light.
Here’s my list of the 21 best COVID-19 data stories of 2021. Disclaimer: this list is not comprehensive or objective—I selected these stories from my own readings of national and local outlets, combined with a couple of reader submissions. Still, I tried to include a variety of publications and story types, ranging from short news pieces to large investigative projects.
The “Good” Metric Is Pretty Bad: Why It’s Hard to Count the People Who Have Recovered from COVID-19 (COVID Tracking Project, Jan. 13): This analysis post illuminates the issues behind tracking “recovered” COVID-19 patients, a metric that used to appear on many state dashboards. Amanda French and Quang Nguyen explore the inconsistent definitions that states use to track this metric—most COVID-19 metrics are inconsistent from one source to another, but “recovery” is particularly inconsistent—as well as how the metric excludes Long COVID patients. The post also explains why CTP removed many “recovered” values from its website.
As Covid vaccine rollout expands, Black Americans still left behind(KHN/NBC, Jan. 29): While vaccines became more widely available throughout the early months of 2021, the CDC’s data on which Americans were getting vaccinated remained extremely limited. In fact, the agency has never released demographic vaccination data at the state-by-state level. KHN reporters Hannah Recht and Lauren Weber filled that gap by compiling data from state dashboards, while also reporting on the vaccine gap between Black and white Americans.
As governor cherry-picked data, the pandemic took a toll on Florida Sunshine laws (Miami Herald, March 2): Throughout the pandemic, Florida has attracted attention—from Governor Ron DeSantis railing against mandates to the Florida Department of Health (FDOH) replacing its comprehensive COVID-19 dashboard with stripped-down weekly reports in June. This important Miami Herald article sheds light on FDOH’s reluctance to “release new data related to COVID-19 that contradicts the governor’s upbeat narrative,” hurting journalists’ and academics’ ability to hold the DeSantis administration accountable.
The uncounted: People who are homeless are invisible victims of Covid-19(STAT News, March 11):Usha Lee McFarling, national science correspondent at STAT News, has spent the year reporting on equity issues connected to COVID-19 and other areas of medicine. In this story, she investigates the lack of COVID-19 deaths reported among homeless populations. According to McFarling, one attempt to track these deaths resulted in a count of under 400, even though homeless shelters are prime locations for outbreaks.
Why the Pandemic Experts Failed (The Atlantic, March 15): On March 7, the COVID Tracking Project updated its datasets for the last time. Shortly afterwards, founders Alexis Madrigal and Robinson Meyer wrote this story sharing lessons learned from a year of data collection, including the challenges of reporting COVID-19 data, the impact of America’s fractured public health systems, and what data can and can’t tell us. For more: check out the project’s analysis posts with further lessons and resources for using federal COVID-19 data.
3.9 million years (Vox, March 17): Typically, when we think about the losses of COVID-19, we think of the number of deaths. But there’s another metric we can use, beautifully explored in this Vox article: years of potential life lost. As of January 31, 2021, the U.S. has recorded about 420,000 deaths, amounting to 3.9 million years lost. The article includes an illustration of this toll, as well as personal stories from the family members of those who died.
We Ran Tests on Every State’s COVID-19 Vaccine Website (The Markup, March 24): The Markup, a nonprofit newsroom that investigates big tech, is famous for its Blacklight tool, which scans websites for user-tracking technologies. In this story, The Markup ran that Blacklight tool on state websites built for users to make their vaccination appointments. The tool found that many sites had below-average privacy ratings and poor accessibility, likely contributing to the stress that many Americans felt in trying to book their vaccinations.
A Tiny Number of People Will Be Hospitalized Despite Being Vaccinated. We Have to Learn Why. (ProPublica, April 14): ProPublica’s Caroline Chen was writing about breakthrough infections before it was cool—or, before Delta hit the U.S. and these infections became common. This article clearly explains what breakthrough infections are, why they’re so rare (at the time), and why they need to be investigated anyway, as scientists hope to find patterns in the breakthrough cases that lead to severe disease. At the time, many states were doing a poor job of data collection; this is still true, many months later.
The First Billion Doses (Bloomberg, April 24): Since late 2020, a group of Bloomberg health and data journalists have run the most comprehensive dashboard on global COVID-19 vaccinations, including data from 184 countries and all U.S. states. It’s an immense undertaking, and has driven plenty of important reporting on vaccine rollouts nationally and globally—such as this story marking the first billion doses administered. The piece both celebrates this scientific achievement and highlights inequities: “Vaccine access so far has been determined by national wealth,” the story says.
COMIC: For my job, I check death tolls from COVID. Why am I numb to the numbers? (NPR, April 25): This comic, by one of the reporters behind NPR’s COVID-19 dashboard, resonated deeply with me. It explores why one death may feel like a tragedy, but 500,000 deaths may feel like a natural part of the world. The comic ends by emphasizing the importance of reading individual people’s stories and maintaining connection, to cope with all of the trauma and loss of the past two years.
Broken system can’t keep track of Native deaths (Indian Country Today, June 8): In this story, the Indigenous Investigative Collective explores how a “labyrinthian system of local, state, federal and tribal data-reporting systems” makes it difficult to accurately track how many Native Americans have died of COVID-19. As a result, the already-high official death toll is likely a significant undercount; and the problem goes beyond COVID-19 to other health issues.
New CDC dataset showing COVID vaccine-by-county numbers misses the entire state of Texas. Why? (Houston Chronicle, June 23): For a long time, there was a Texas-shaped hole in the CDC’s dataset of COVID-19 vaccinations bycounty. This article, by Houston Chronicle reporter Kirkland An, digs into the issue and explains: a unique state law in Texas restricts sharing of individual data, including the anonymized vaccination records that the CDC requested from states in order to calculate county-level vaccination rates. To me, this is a great example of a local reporter diving into an issue that their region is facing in a national dataset. (And the data issue has since been fixed!)
How Local Reporters in India Exposed the Pandemic’s True Death Toll (Global Investigative Journalism Network, June 28): This one is a bit meta: it’s an article about COVID-19 death investigations, carried out by journalists in India during the country’s severe spring 2021 surge. One reporter, Yogen Joshi, used counts of Hindu funeral rituals at a holy riverbed site to reveal that the true number of deaths in the state of Gujarat was much higher than the official record stated. Other journalists similarly investigated body counts and death certificates directly, showing how national data fell short.
Meet the people who warn the world about new covid variants (MIT Technology Review, July 26):MIT Technology Review’s Pandemic Technology Project has produced a number of important COVID-19 stories this year (including my own!), but this one is my personal favorite. Cat Ferguson profiled a group of scientists who created and contributed to the Pango system for tracking coronavirus variants, racing to name and classify new sequences as soon as they’re uploaded into the public domain. This article demonstrates the human toll of running such an important database, particularly when it’s led by PhD students and postdocs who never anticipated the scale their project would attain.
Inside America’s Covid-reporting breakdown (POLITICO, Aug. 15): At this point, most COVID-19 reporters are familiar with the challenges underlying our spotty pandemic numbers: public health agencies have long been underfunded, records are transmitted by fax and mail, data systems are inconsistent, workers are overwhelmed, etc. But few articles lay out the problems as clearly as this feature by POLITICO’s Erin Banco, who spoke to health officials in more than 20 states. The article also includes great data visualizations and graphics that illustrate the issues.
Ahead Of NYC School Reopening, 1,500 Classrooms Still Undergoing Ventilation Repairs (Gothamist/WNYC, Aug. 30): By mid-2020, there was a growing scientific consensus that the coronavirus spreads through the air, and ventilation is an important means of increasing COVID-19 safety. Yet businesses and news cycles alike failed to focus on ventilation well into 2021—so I was very excited to see Gothamist’s thorough investigation of air filtration in New York City schools. This article is part one in an extensive series, combining city records with expert insights on air quality standards.
How did a Kansas grandmother just become the first U.S. COVID death? Not even her family knew until this week (The Mercury News, Sept. 2): Sometimes, the best kind of data story is an investigation into one singular data point. This piece, published in Bay Area newspaper The Mercury News, tells the story of Lovell Brown, a senior in Leavenworth County, Kansas who is now the first recorded COVID-19 death in the U.S.—after her death certificate was amended in May 2021 to include the disease. While the exact reasons behind this death certificate update are unknown, the revision suggests that the coronavirus was spreading in the Kansas City area well before official data collection started.
The fight to manufacture COVID vaccines in lower-income countries (Nature, Sept. 15): As someone who has been writing about global health long before COVID-19 hit, Amy Maxmen is an expert on the global vaccination beat. This story lays out the immense gap between vaccine access in high-income countries and low-income countries, while also explaining a potential solution: many manufacturers in low- and middle-income countries are ready to produce COVID-19 vaccines, if only they could get ahold of the patents. I’ve come back to reread this piece several times in the past few months, as booster shot campaigns in the U.S. and elsewhere have further exacerbated vaccine inequity.
Opening Project conclusion: 11 lessons from the schools that safely reopened (COVID-19 Data Dispatch, Sept. 19): Yes, I snuck one of my own projects onto this list: the Opening Project, in which I identified and profiled five school communities that brought the majority of their students back to in-person learning by the end of the 2020-2021 school year while reporting fewer COVID-19 cases than the national average. For me, this project was a departure from past data journalism stories; instead of describing an overall trend with data, I focused on five outliers, investigating why they were successful. The project, which was funded with a grant from the Solutions Journalism Network, was republished at several education and science news outlets.
Covid response hampered by population data glitches (Financial Times, Oct. 11): Vaccination rates—which show the percentage of a population that’s received at least one vaccine dose or been fully vaccinated—have been a key metric driving government COVID-19 responses in the past year. But when the population data underlying these calculations are inaccurate, this article by Oliver Barnes and John Burn-Murdoch explains, the vaccination rates can be way off. For example, some Miami, Florida ZIP codes have vaccination rates of over 200% among seniors, because snowbirds who don’t formally reside in the city got vaccinated there. (If you hit the Financial Times’ paywall, you can read my summary of the piece here.)
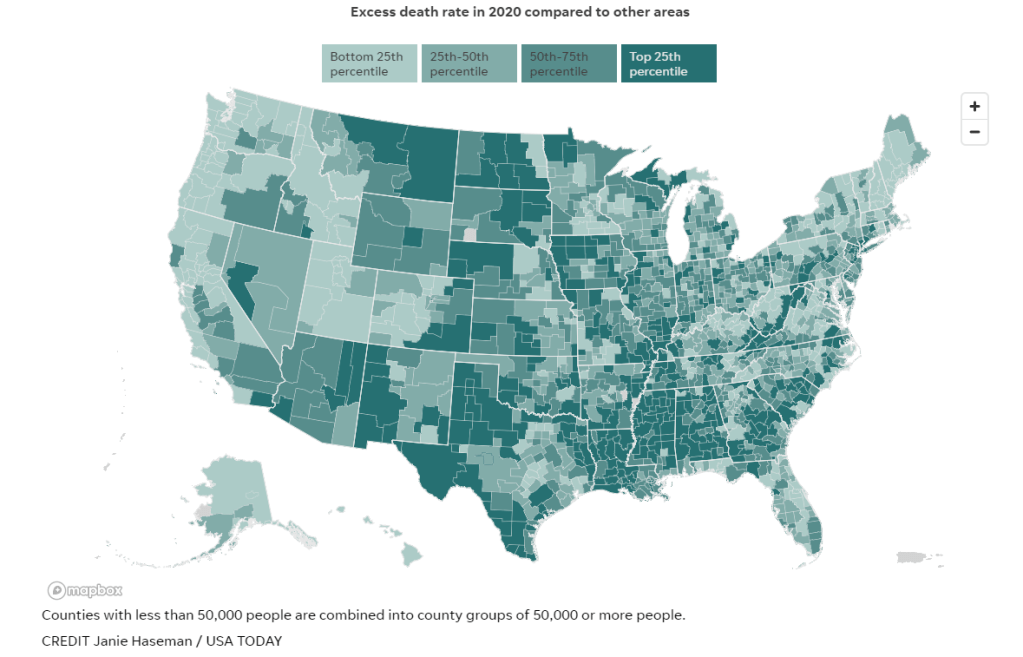
Uncounted: Inaccurate death certificates across the country hide the true toll of COVID-19 (Documenting COVID-19 & USA Today, Dec. 22): For months, the Documenting COVID-19 team has worked with several USA Today newsrooms to investigate unreported COVID-19 deaths. While the official COVID-19 death toll in the U.S. is about 800,000, experts suspect that up to 200,000 additional deaths from the disease have gone uncounted, due to a combination of undertrained coroners and medical examiners, a lack of standardization for identifying these deaths, under-testing, and other issues with death certificates. I was part of the team behind this investigation, which will continue with further stories in 2022; you can read more about the CDC data that drove much of our analysis here.
I enjoyed compiling the list because it gave me a way to look back on COVID-19 news coverage throughout 2020, with a focus on those stories that dug into the numbers—whether that was visualizing pandemic trends or explaining an issue with data collection and reporting. (Also, it was a fairly straightforward issue to compile and send out two days after Christmas!)
This year, I’m planning to compile a similar list: the 21 best COVID-19 data stories of 2021.
And I need your help to pick these stories! Last year’s list was very U.S.-heavy, as I primarily read coverage from national and New York city-specific publications, and I would love to make this year’s list more geographically diverse. Please send me COVID-19 data stories you loved from your local news outlet, your favorite science journalist, or any other publication.
To submit ideas, you can comment below, email me at betsy@coviddatadispatch.com, or reach out on Twitter or Facebook. My full list will go out in next week’s issue, on December 26, and I’ll accept submissions until the 25th.
I recently received a question from a COVID-19 Data Dispatch reader that followed a similar theme to many questions that readers, friends, and family members have asked me in the past few months. The question essentially outlined an event in the reader’s personal life that they’d been invited to attend, and asked for my advice: should they go? How risky was this event?
I have a hard time answering these types of questions directly, because I am no medical expert—I’m far from qualified to give direct advice. Instead, I like to outline my own attitudes towards risk at the pandemic’s current moment, and try to explain what I might do in that situation.
Right now, this type of decision-making feels harder than ever before. The majority of Americans are fully vaccinated, and we know how well the vaccines work. A growing number of Americans are getting booster shots, which we know are highly protective for seniors (and at least seem to reduce infection risk for others). So many of us are tired of the pandemic, and want to have a normal holiday season this year.
But at the same time, I feel an impetus to stay cautious—to protect the people around me as much as I can—as COVID-19 cases start to rise again in New York City, where I live, and in many other places around the country.
It’s also important to note here that everyone has a different risk comfort zone right now, partially as a product of a dearth of local and federal safety regulations at this point in the pandemic. If you’re fully vaccinated, and you’re comfortable hanging out inside with a large group of fully vaccinated people, there is evidence to suggest that is a largely safe situation for you. But if you’re not comfortable at such an event, there is also evidence to suggest that you may be able to pick up the coronavirus (even from a fully vaccinated crowd) and bring it back to someone who is more vulnerable than you are. Every choice comes with a calculation—what risk are you willing to bring to yourself and to those around you?
With all of that in mind, there are a few things I consider when I try to decide how “risky” an event might be. First of all, I still consider outdoor events to be very safe; the benefits of open air, wind, and sun far outweigh Delta’s high capacity for transmission. Then, for indoor events, I think about a few different layers of safety measures:
Will everyone be fully vaccinated?
Will negative COVID-19 tests be required before the event?
Will masks be required?
Will windows be open, or will ventilation in the space otherwise be high-quality?
What are the COVID-19 case numbers in the surrounding county; are they above or below the CDC’s “substantial transmission” threshold (50 total new cases for every 100,000 people in the past week)?
When at least three of these five conditions are met, I personally would consider an event safe for attendance. When fewer than three conditions are met, I tend to add additional layers of protection for myself and others in my immediate community by wearing a high-quality mask and getting tested before and after. (I might use an at-home rapid test or a PCR test, depending on how much security I want in that test result.
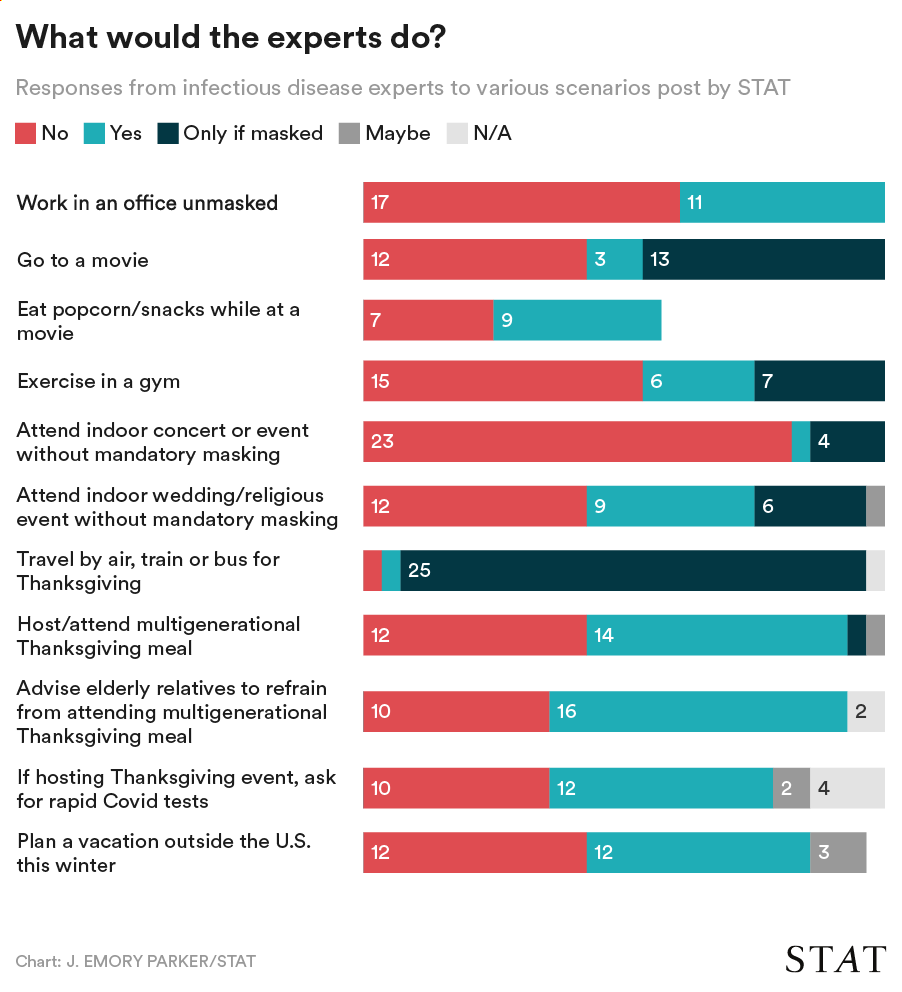
STAT News surveyed 28 infectious disease experts on activities they would currently feel comfortable doing. Chart via STAT.
Finally, if you’d rather listen to the insights of some high-profile COVID-19 experts than to me, I’ve got a source for you: STAT News recently surveyed 28 infectious disease experts on which activities they would feel comfortable doing right now. The responses to STAT’s survey reveal a diversity of risk comfort levels, even among people who are incredibly well-informed about the pandemic.
The vast majority of experts said they would travel by air, train, or bus for Thanksgiving (mostly with a mask on), and the majority said they would not attend an indoor concert or event without mandatory masks. Other than that, all the questions are fairly split. The article (which I recommend reading in full!) includes a number of insights from those experts explaining their survey responses.
The Delta surge is waning. Will this be the last big surge in the U.S., or will we see more? This question and more, answered below; chart from the CDC.
Last week, I asked readers to fill out a survey designed to help me reflect on the COVID-19 Data Dispatch’s future. Though the Delta surge—and the pandemic as a whole—is far from over, I’m considering how this publication may evolve in a “post-COVID” era. Specifically, I’m thinking about how to continue serving readers and other journalists as we prepare for future public health crises.
Thank you to everyone who’s filled out the survey so far! I really appreciate all of your feedback. If you haven’t filled it out yet, you can do so here.
Besides some broader questions about the CDD’s format and topics we may explore in the future, the survey asked readers to submit questions that they have about COVID-19 in the U.S. right now. In the absence of other major headlines this week, I’m devoting this week’s issue to answering a few of those questions.
Should I get a booster shot? If so, should it be a different one from the first vaccine I got? When will my kids (5-11) likely be eligible?
I am not a doctor, and I’m definitely not qualified to give medical advice. So, the main thing I will say here is: identify a doctor that you trust, and talk to them about booster shots. I understand that a lot of Americans don’t have a primary care provider or other ways to easily access medical advice, though, so I will offer some more thoughts here.
As I wrote last week, we do not have a lot of data on who’s most vulnerable to breakthrough COVID-19 cases. We do know that seniors are more vulnerable—this is one point where most experts agree. We know that adults with the same health conditions that make them more likely to have a severe COVID-19 case without a vaccine (autoimmune conditions, diabetes, kidney disease, etc.) are also more vulnerable to breakthrough cases, though we don’t have as much data here. And we know that vaccinated adults working in higher-risk locations like hospitals, nursing homes, and prisons are more likely to encounter the coronavirus, even if they may not necessarily be more likely to have a severe breakthrough case.
The FDA and CDC’s booster shot guidance is intentionally broad, allowing many Americans to receive a booster even if it is not necessarily needed. So, consider: what benefits would a booster shot bring you? Are you a senior or someone with a health condition that makes you more likely to have a severe COVID-19 case? Do you want to protect the people you work or live with from potentially encountering the coronavirus?
If you answered “yes” to one of those questions, a booster shot may make sense for you. And, while you may be angry about global vaccine inequity, one individual refusal of a booster shot would not have a significant impact on the situation. Rather, many vaccine doses in the U.S. may go to waste if not used for boosters. But again: talk to your doctor, if you’re able to, about this decision.
Currently, Pfizer booster shots are available for people who previously got vaccinated with Pfizer. The FDA’s vaccine advisory committee is meeting soon to discuss Moderna and Johnson & Johnson boosters: they’ll discuss Moderna on October 14 and J&J on October 15. Vaccine approval in the U.S. depends upon data submission from vaccine manufacturers—and vaccine manufacturers have not been studying mix-and-match booster regimens—so coming approvals will likely require Americans to get a booster of the same vaccine that they received initially. We will likely see more discussion of mix-and-match vaccinations in the future, though, as more outside studies are completed.
As for when your kids will likely be eligible: FDA’s advisory committee is meeting to discuss Pfizer shots for kids ages 5 through 11 on October 26. If that meeting—and a subsequent CDC meeting—goes well, kids may be able to get vaccinated within a week of that meeting. (Potentially even on Halloween!)
Why don’t people get vaccinated and how can we make them?
I got a couple of questions along these lines, asking about vaccination motivations. To answer, I’m turning to KFF’s COVID-19 Vaccine Monitor, a source of survey data on vaccination that I (and many other journalists) have relied on since early 2021.
KFF released the latest round of data from its vaccine monitor this week. Here are a few key takeaways:
The racial gap in vaccinations appears to be closing. KFF found that 71% of white adults have been vaccinated, compared to 70% of Black adults and 73% of Hispanic adults. Data from the CDC and Bloomberg (compiling data from states) similarly show this gap closing, though some parts of the country are more equitably vaccinated than others.
A massive partisan gap in vaccinations remains. According to KFF, 90% of Democrats are vaccinated compared to just 58% of Republicans. This demonstrates the pervasiveness of anti-vaccine misinformation and political rhetoric among conservatives.
Rural and younger uninsured Americans also have low vaccination rates (62% and 54%, respectively). Both rural and uninsured people have been neglected by the U.S. healthcare system and face access barriers; for more on this topic, I recommend this Undark article by Timothy Delizza.
Delta was a big vaccination motivator. KFF specifically asked people who had gotten their shots after June 1 why they chose to get vaccinated. The most popular reasons were, in order: the increase in cases due to Delta (39%), concern about reports of local hospitals and ICUs filling with COVID-19 patients (38%), and knowing someone who got seriously ill or died from COVID-19 (36%).
Mandates and social pressures were also vaccination motivators. 35% of KFF’s recently vaccinated survey respondents said that a big reason for their choice was a desire to participate in activities that require vaccination, like going to the gym, a big event, or traveling. 19% cited an employer requirement and 19% cited social pressure from family and friends.
The second part of this question, “how can we make them?”, reflects a dangerous attitude that has permeated vaccine conversations in recent months. Yes, it’s understandable to be frustrated with the Americans who have refused vaccination. But we can’t “make” the unvaccinated do anything, and such a forceful attitude may put off people who still have questions about the vaccines or who have faced discrimination in the healthcare system. To increase vaccinations among people who are still hesitant, it’s important to remain open-minded, not condescending. For more: read Ed Yong’s interview with Dr. Rhea Boyd.
That said, we’re now getting a sense of which strategies can increase vaccination: employer mandates, vaccination requirements for public life, and personal experience with the coronavirus. As the Delta surge wanes, it will take more vaccination requirements and careful, open-minded conversations to continue motivating people to get their shots.
What are some things I might say to convince people of Delta’s severity and the need to not relax on masking, distancing, etc?
To answer this, I’ll refer you to the article I wrote about Delta on August 1, as the findings that I discuss there have been backed up by further research.
Personally, there are two statistics that I use to express Delta’s dangers to people:
Delta causes a viral load 1,000 times higher than the original coronavirus strain. This number comes from a study in Guangzhou, China, posted as a preprint in late July. While viral load does not correspond precisely to infectiousness (there are other viral and immune system factors at play), I find that this “1,000 times higher” statistic is a good way to convey just how contagious Delta is, compared to past variants.
An interaction of one second is enough time for Delta to spread from one person to another. Remember the 15-minute rule? In spring 2020, being indoors with someone, unmasked, for 15 minutes or more was considered “close contact.” Delta’s increased transmissibility means that an interaction of one second is now enough to be a “close contact.” The risk is lower if you’re vaccinated, but still—Delta is capable of spreading very quickly in enclosed spaces.
You may also find it helpful to discuss rising numbers of breakthrough cases in the U.S. While vaccinated people continue to be incredibly well protected against severe disease and death caused by Delta, the vaccines are not as protective against coronavirus infection and transmission. (They are protective to some degree, though! Notably, coronavirus infections in vaccinated people tend to be significantly shorter than they are in the unvaccinated, since immune systems can quickly respond to the threat.)
It’s true that rising breakthrough case numbers are, in a way, expected—as more people get vaccinated, breakthrough cases will naturally become more common, because the virus has fewer and fewer unvaccinated people to infect. But considering the risks of spreading the coronavirus to others, plus the risks of Long COVID from a breakthrough case… I personally don’t want a breakthrough case, and so I continue masking up and following other safety protocols.
What monitoring do we have in place for COVID “longhaulers” and their symptoms/health implications?
This is a great question, and one I wish I could answer in more detail. Unlike COVID-19 cases, hospitalizations, and other major metrics, we do not have a comprehensive national monitoring system to tell us how many people are facing long-term symptoms from a coronavirus infection, much less how they’re faring. I consider this one of the country’s biggest COVID-19 data gaps, leaving us relatively unprepared to help the thousands, if not millions, of people left newly disabled by the pandemic.
In February, the National Institutes of Health (NIH) announced a major research initiative to study Long COVID. Congress has provided over $1 billion in funding for the research. This initiative will likely be our best source for Long COVID information in the future, but it’s still in early stages right now. Just two weeks ago, the NIH awarded a large share of its funding to New York University’s Langone Medical Center; NYU is now setting up long-term studies and distributing funding to other research institutions.
As I wrote in the September 19 issue, the NIH’s RECOVER website currently reports that between 10% and 30% of people infected with the coronavirus will go on to develop Long COVID; hopefully research at NYU and elsewhere will lead to some more precise numbers.
While we wait for the NIH research to progress, I personally find the Patient-Led Research Collaborative (PLRC) to be a great source for Long COVID research and data. The PLRC consists of Long COVID patients who research their own condition; it was founded out of Body Politic’s Long COVID support group. This group produced one of the most comprehensive papers on Long COVID to date, based on an international survey including thousands of patients, and has more research currently ongoing.
If you have the means to support Long COVID patients—many of whom are unable to work and facing homelessness—please see the responses to this tweet by PLRC researcher Hannah Davis:
As others have mentioned, people with Long COVID are unable to work & are becoming homeless.
If you have #LongCovid & are struggling, drop your venmo/cashapp/paypal/etc in this thread & I'll retweet.
If you have $ to spare, please support patients in this thread.
Why is the CDC not doing comprehensive high volumes of sequencing on all breakthrough cases at the very least?
I wish I knew! As I wrote last week (and in several other past issues), the lack of comprehensive breakthrough case data in the U.S. has contributed to a lack of clarity on booster shots, as well as a lack of preparedness for the next variants that may become threats after Delta. The CDC’s inability to track and sequence all breakthrough cases—not just the severe ones—is dangerous.
That said, it is very difficult to track breakthrough cases in a country like the U.S. Consider: the U.S. does not have a comprehensive, national electronic records system for patients admitted to hospitals, much less those who receive COVID-19 tests and other care at outpatient clinics. This lack of comprehensive records makes it difficult to match people who’ve been vaccinated with those who have received a positive COVID-19 test. Thousands, if not millions of Americans are now relying on rapid tests for their personal COVID-19 information—and most rapid tests don’t get entered into the public health records system at all.
Plus, local public health departments are chronically underfunded, understaffed, and burned out after almost two years of working in a pandemic; they have little bandwidth to track breakthrough cases. Many Americans refuse to participate in contact tracing, which hinders the public health system’s ability to collect key information about their cases. And there are other logistical challenges around genomic sequencing; despite new investments in this area, many parts of the country don’t have sequencing capacity, or the information infrastructure needed to send sequencing results to the CDC.
So, if the CDC were tracking non-severe breakthrough cases, they’d likely miss a lot of the cases. But that doesn’t mean they shouldn’t be trying, in my opinion.
How safe is it to visit my family for the holidays?
This is another place where I don’t feel qualified to give advice, but I can offer some thoughts. If I were you, I would think about the different ways in which holiday travel might pose risk to me and to the people at the other end of my trip. I would consider:
Quarantining beforehand. Do your occupation and living circumstances allow you to quarantine for a week, or at least limit your exposure to settings where you might be at risk of catching the coronavirus, before you travel? Can you get a test before traveling?
Types of travel. Can you make the trip in a car or on public transportation, or do you need to fly? If you need to fly, can you select an airline that has stricter COVID-19 safety requirements? (United recently reported that over 96% of its employees are now vaccinated, for example.) Can you wear a high-quality mask for the flight?
Quarantining and/or testing upon arrival. Can you spend a couple of days in quarantine once you get to your destination? Would you have access to testing (with results in under 24 hours) upon your arrival, or would you be able to bring rapid tests with you?
Who you’re spending time with. Among the family you’d be visiting, is everyone vaccinated (besides young children)? If anyone is not vaccinated, could your potential travel be a motivator to help convince them to get vaccinated? Does the group include seniors or people with health conditions that put them at high risk for COVID-19, and if so, can they get booster shots?
Activities that you do at your destination. Would you be able to have large gatherings outside, or in a well-ventilated space? What else can you do to reduce the risk of these activities?
Like other activities, travel can be relatively safe or fairly dangerous depending on the precautions that you’re able to take, and depending on COVID-19 case rates where you live and at your destination. And, like other activities, your choice to travel or not travel depends a lot on your personal risk tolerance. Nothing is zero-risk right now; each person has a threshold that determines what level of COVID-19 risk they are and are not comfortable taking. Through some self-reflection, you can determine if travel is above or below your risk threshold.
Why are policies so different now than they were at this time last year?
Public health tends to go through cycles of “panic” and “neglect.” Ed Yong’s latest feature goes into the history of this phenomenon:
Almost 20 years ago, the historians of medicine Elizabeth Fee and Theodore Brown lamented that the U.S. had “failed to sustain progress in any coherent manner” in its capacity to handle infectious diseases. With every new pathogen—cholera in the 1830s, HIV in the 1980s—Americans rediscover the weaknesses in the country’s health system, briefly attempt to address the problem, and then “let our interest lapse when the immediate crisis seems to be over,” Fee and Brown wrote. The result is a Sisyphean cycle of panic and neglect that is now spinning in its third century. Progress is always undone; promise, always unfulfilled. Fee died in 2018, two years before SARS-CoV-2 arose. But in documenting America’s past, she foresaw its pandemic present—and its likely future.
During the COVID-19 pandemic, the U.S. took a nosedive into the “neglect” cycle before we were even finished with the “panic” cycle. Congress has already slashed its funding for future pandemic preparedness, while state and local governments across the country restrict the powers of public health officials. As a result, we’re seeing an “everyone for themselves” attitude at a time when we should be seeing new mask mandates, restrictions on public activities, and other safety measures.
Basically, America decided the pandemic was over and acted accordingly—and if you get COVID-19 now, it’s “your fault for not being vaccinated.” This phenomenon has been especially pronounced in rural areas, which struggled a lot (but saw few cases) during spring 2020 lockdowns and are extremely hesitant to do anything approaching a “lockdown” again.
We need an attitude shift—and more investment in public health—to actually end this pandemic and prepare for the next health crisis. Yong’s feature goes into this in more detail; definitely give that a read if you haven’t yet.
When is this going to be over?!?
Unfortunately, this is very hard to predict—even for the expert epidemiologists and computational biologists who make the models. Check out the CDC’s compilation of COVID-19 case models: most of them agree that cases will keep going down in the coming weeks, but they’re kind of all over the place.
Last week, I summarized two stories—from The Atlantic and STAT News—that discuss the coming winter, and kind of get at this question. It’s possible that cases keep declining from their present numbers, and that the Delta surge we just faced is the last major surge in the U.S. It’s also possible that a new variant arises out of Delta and sends us into yet another new surge. If that happens, more people will be protected by vaccination and prior infection, but healthcare systems could come under strain once again.
As long as the coronavirus continues spreading somewhere in the world, it will continue to pose risk to everyone—able to cause new outbreaks and mutate into new variants. This will continue until the vast majority of the world is vaccinated. And then, at some point, the coronavirus will probably become endemic, meaning it persists in the population at some kind of “acceptable” threshold. Just like the flu.
Dr. Ellie Murray, epidemiologist at Boston University’s School of Public Health, explained how a pandemic becomes endemic in a recent Twitter thread:
Everyone keeps talking about covid becoming endemic, but as I listen to the conversation, it’s becoming more & more clear to me that very few of you know what “endemic” means.
Dr. Murray points out that, even when a disease reaches endemic status, tons of scientists and public health workers will still continue to monitor it. This is the case for the flu—think about all of the effort that goes into a given year’s flu shot!—and it will likely be the case for COVID-19.
In short, public health leaders need to figure out what level of COVID-19 transmission is “acceptable” and how we will continue to monitor it. This needs to happen at both U.S. and global levels. And, thanks to our vaccine-rich status, it’ll likely happen in the U.S. long before it happens globally.
So, yes, our only viable choice left is covid becoming endemic. It didn’t have to be this way, but our leaders MADE a choice.
And now they need to make another choice: They need to choose an “acceptable” level of COVID death & disease.
Two Abbott BinaxNOW antigen tests used by Betsy and her sister during their trip, demonstrating single-line negative results.
As I mentioned in last week’s newsletter, I went on vacation during the last week of August. I traveled to California to visit my younger sister, who was living there over the summer for an internship. We spent a couple of days in the Bay Area, then drove to Southern California, hit a few different destinations, and finally flew out of Los Angeles International Airport (LAX).
Both my sister and I are fully vaccinated, of course, but we still took a number of precautions to make our trip as safe as possible in light of the current COVID-19 surge. I wanted to share what we did in case it’s useful for others thinking about travel right now.
Key precautions included:
Limited exposure and tests before traveling: For ten days before my flight out to California, I avoided all unmasked indoor activities, including small gatherings with fully vaccinated friends. Closer to my flight, I also avoided other activities outside my home (grocery shopping, taking the subway, and the like). I got a PCR test at a NYC Health site two days before my flight, and didn’t leave my apartment between that test and heading out to the airport.
Rapid testing every two days during the trip: I carried three packs’ worth of Abbott BinaxNOW rapid antigen tests in my suitcase, and bought a couple more packs in California. Starting two days after I arrived, my sister and I tested ourselves every other day. While antigen tests like these are more likely to give you a false negative than PCR tests, testing frequently increases your chances of catching a case—and catching it early in your disease progression, when you’re most likely to infect others. The tests were easy to incorporate into our routines, especially once we got used to the swabbing process.
Sticking to outdoor activities: Our trip included a lot of outside time: hiking in a redwood forest, hitting up Southern California beaches, camping for a night at Joshua Tree National Park, and lots of outdoor dining. The riskiest two activities of the week, we agreed, were an afternoon at Monterey Bay Aquarium and a day at Universal Studios in LA. But both of those establishments did a great job of reminding all patrons (including the vaccinated) to keep their masks on inside—following current mask regulations in the Bay Area and LA County.
Double-masking indoors: On both my flights and whenever I needed to be inside for a longer period of time, I wore two masks: a surgical mask and a fitted, multi-layer cloth mask. Studies suggest that cloth masks on their own are not the best option for protecting against Delta, but layering a cloth and surgical mask can increase protection. I especially like to layer masks because surgical masks typically don’t fit well on my face; when I add a cloth mask on top, the fit becomes much more snug.
Precautions when visiting relatives: My sister and I visited a few relatives over the course of our trip. For these visits, we basically followed the precautions that health experts recommended last Thanksgiving: eat outside whenever possible, mask up in common areas inside, open windows for extra ventilation, etc. We also organized the trip so that no visits occurred after Universal Studios, which we had deemed the riskiest activity of the week.
Extra testing after traveling: Flying out of LAX proved to be incredibly stressful, as neither the airport nor our airline put in effort to enforce mask guidance. My sister and I even gave extra masks to two fellow travelers at the check-in desk, because the airline apparently did not have any extras available. Because of this extra COVID-19 exposure risk, I did some extra testing upon my return to the East coast: daily rapid tests for two days in a row, followed by a PCR test.
hi @JetBlue! your mask availability and enforcement is apparently so bad that my sister and I had to literally GIVE TWO OF OUR OWN EXTRA MASKS to fellow travelers at the (very crowded) LAX check-in desk. this is extremely irresponsible in the face of the current covid surge.
Personally, this will probably be my last major trip for a while. Conferences that I’d planned to attend in the fall have been moved to all-virtual formats, and I’m lucky to live close enough to my parents that I don’t need a flight to see them for the holidays. If I were to travel again, though, I’d likely follow these same precautions—with adjustments based on COVID-19 infection rates at my destination. Also, I would probably avoid LAX.
Here are 20 stories that have uncovered significant patterns of the pandemic, demonstrated a mastery of craft, and inspired me to be a better data journalist.
(Disclaimer: I primarily read U.S. coverage from national and New York City-specific publications, so this list is not as diverse as I’d like; still, I did my best to include a variety of outlets and topics, featuring data viz-heavy stories as well as more traditional articles which explain COVID-19 numbers.)
Edward Holmes’ tweet announcing that the novel coronavirus genome has been posted (Jan. 10): Okay, so this isn’t technically a work of data journalism. But it seemed crucial to me that I include the most important tweet of the year. When Holmes publicly shared the genome of SARS-CoV-2—sequenced by Shanghai professor Yong-Zhen Zhang—scientists around the world immediately sprung into action, developing tests and therapeutics for the novel virus. “Please feel free to download, share, use, and analyze this data,” a note on the Virological.org posting reads. And scientists did: the first vaccines were designed within days.
Limited data may be skewing assumptions about severity of coronavirus outbreak, experts say(STAT News, Jan. 30): Helen Branswell’s diligent record on covering COVID-19 speaks for itself—I had to go eight pages back in her archive to find stories from January. (Her first story on the virus was published on January 4). This January 30 piece points out how a limited case definition hindered Chinese scientists attempting to determine how far the virus had spread through the country. Throughout the pandemic, Branswell has been an experienced voice who can clearly spell out the implications of medical data, as she does here: she explains why the severe COVID-19 cases that had been reported so far were the “tip of the iceberg.”
The Strongest Evidence Yet That America Is Botching Coronavirus Testing (The Atlantic, March 6): I wish I could include every single one of Alexis Madrigal and Rob Meyer’s COVID-19 data stories in this list; throughout the pandemic, these reporters have used data from the COVID Tracking Project (which they cofounded) to explain major COVID-19 trends and draw attention to issues in the U.S. Their work shows how journalists can benefit from truly getting inside of a dataset and spending months watching the same metrics. I chose these reporters’ first story, however, because it was the basis for the COVID Tracking Project itself. “How many people have actually been tested for the coronavirus?” Madrigal and Meyer ask. The answer, it turns out, took hundreds of volunteers, intensive infrastructure, and endless partnerships that spanned far beyond March.
Why It’s So Freaking Hard To Make A Good COVID-19 Model (538, March 31): At a time when it seemed like every other Twitter account suddenly belonged to an armchair epidemiologist, 538’s Maggie Koerth, Laura Bronner, and Jasmine Mithani swept in to expound upon the complexities of infectious disease modeling. The article uses simple graphics—flowcharts of color-coded boxes—to show all the factors that can go into calculations of how many people might get sick and die during the COVID-19 pandemic. Rereading it this week, I was struck by how relevant the story still is in articulating fundamental uncertainties about this virus.
Mapping Covid-19 outbreaks in the food system (Food & Environment Reporting Network, April 22/ongoing): Meatpacking plants and other food processing facilities have been some of the biggest outbreak sites in the U.S., but most government sources do not report specifically on these outbreaks. Reporter Leah Douglas has singlehandedly filled this gap by synthesizing reports from local news outlets, health agencies, and food production companies. She has updated the data visualizations in this story regularly since April. As of December 18, the most recent update, at least 1,257 meatpacking and food processing plants have seen COVID-19 cases. Tyson Foods has seen the most cases, at over 11,000.
How to Understand COVID-19 Numbers (ProPublica, July 21): Caroline Chen is a veteran infectious disease reporter who lived through Hong Kong’s SARS outbreak and reported on Ebola. With the help of designer Ash Ngu, she walks readers through a couple of key principles in understanding—and reporting—COVID-19 data. The story explains why to use seven-day averages over raw case numbers, how to understand test positivity rates, and more. I covered it in my first newsletter issue back in July and was inspired to write my own “how to understand COVID-19 numbers” story for Stacker in the fall.
To Navigate Risk In a Pandemic, You Need a Color-Coded Chart (WIRED, July 21): In this delightfully meta story, Maryn McKenna unpacks the design choices that go into those green-to-red risk charts that were widely shared across social media when states began reopening in the summer. She explains the challenge of taking risk—something that is inherently impossible to fully quantify—and putting it into one-size-fits-all guidance. True COVID-19 risk, the story explains, must incorporate one’s location, environment, behavior, and many more factors.
Which Cities Have The Biggest Racial Gaps In COVID-19 Testing Access? (538, July 22): A lot of journalists have tried to explain how systemic racism in America led to disproportionately high COVID-19 cases and deaths for the Black community. But this story, by a team of six 538 researchers and designers, is particularly effective. The graphics demonstrate a clear disparity: “testing sites in and near predominantly Black and Hispanic neighborhoods are likely to serve far more patients than those near predominantly white areas.” In South Texas, for example, a single testing site may have served 600,000 people—leading to extensive test wait times and other barriers to healthcare for COVID-19 patients.
Thousands of Texans are getting rapid-result COVID tests. The state isn’t counting them. (Houston Chronicle, Aug. 2): Fun story about this one: back in August, when I was working on my antigen testing issue, I needed to cite this piece on the disconnect between how antigen tests were being reported by Texas’ state public health agency and how they were being reported by several Texas counties. I paid for a subscription to the Houston Chronicle to get around the site’s paywall. And then, probably because I am a Millennial/Gen Z cusp who hates unnecessary phone calls… I never canceled my subscription. I have no regrets, though—the Houston Chronicle does good work. This particular story provided a clear explanation of antigen test reporting issues long before many other news outlets became aware of the test type.
Why the United States is having a coronavirus data crisis (Nature, Aug. 25): This story, by Nature’s Amy Maxmen, uses global context to explain why it is so damn hard for the U.S. to collect and share COVID-19 data. While South Korea has coordinated case reporting and contact tracing from 250 regional public health agencies, local agencies in the U.S. are overworked, underpaid, and relying on outdated technology. The article also discusses how a lack of federal leadership and data standards trickles down to make data collection, analysis, and transparency harder for epidemiologists.
A long time to wait (Spotlight PA, Sept. 24): There was a period in summer 2020 during which Sara Simon tweeted every day about delays in Pennsylvania’s COVID-19 reporting. The state often reported COVID-19 deaths months later than they had occurred, due to an antiquated data system that was not updated in time for Pennsylvania’s outbreaks—and caused additional confusion for public health workers and state data watchers alike. Simon and her colleagues’ story explores these reporting issues, while a data visualization of the death reporting lag in every state provides context.
Data Journalists’ Roundtable: Visualizing the Pandemic (The Open Notebook, Sept. 29): This roundtable interview brings together four data journalists to share the design choices behind COVID-19 graphics they produced. It includes both discussions of the journalists’ biggest challenges and behind-the-scenes notes on specific charts, ranging from a visualization of cell phone data to one of high-risk health conditions in minority communities. (One of the graphics featured is, in fact, a chart from the 538 article on COVID-19 modeling that I highlighted earlier in this list.)
This Overlooked Variable Is the Key to the Pandemic (The Atlantic, Sept. 30): Never has a science writer elaborated upon a single variable so expertly as Zeynep Tufekci does in this story. She uses k, a measure of how a virus disperses, to explain why some COVID-19 patients are able to infect many other people—in what epidemiologists call superspreading events—while other patients do not infect anyone else at all. The story walks readers through an immense amount of scientific evidence while clarifying basic principles with easy-to-grasp analogies.
Covid-19’s stunningly unequal death toll in America, in one chart (Vox, Oct. 2): This story lives up to its headline’s promise. The chart in question, by Vox’s Christina Animashaun, visualizes COVID-19 death rates with small human icons: each “person” represents one in 100,000 Americans who have died from the disease. As of early October, 98 of every 100,000 Black Americans had died from COVID-19, compared to 47 of every 100,000 white Americans. As of December 26, 126 out of every 100,000 Black Americans and 74 out of every 100,000 white Americans have now died of this disease.
Test Positivity in the US Is a Mess (The COVID Tracking Project, Oct. 8): Out of the many informative blog posts produced by the COVID Tracking Project since last spring, this is the one I’ve shared most widely. Project Lead Erin Kissane and Science Communication Lead Jessica Malaty Rivera clearly explain how COVID-19 test positivity—what should be a simple metric, the share of tests conducted in a given region that return a positive result—can be calculated in several different ways. Graphics by Júlia Ledur illustrate the different options, with the help of a cartoon COVID-19 patient called Bob. The post both highlights a major issue in COVID-19 data reporting and explains why the Project does not report test positivity on its own site.
We Don’t Really Know if COVID is Spreading in Lincoln Schools (Seeing Red Nebraska, Oct. 13): This local news story takes a deep dive into reporting issues in the Lincoln Public Schools district. Reporter Trish Wonch Hill explains why the school district’s data dashboard is “close to useless,” unpacks a flaw in the district’s contact tracing protocol that discounts in-school disease spread, and highlights a group of parents who have been tracking school cases on their own crowd-sourced dashboard. Data on COVID-19 in schools have been severely lacking throughout the pandemic—every local news outlet should be conducting this type of investigation.
A room, a bar and a classroom: how the coronavirus is spread through the air (El País, Oct. 28): This set of data visualizations by Madrid-based newsletter El País was shared far and wide after its publication in the fall—for good reason. As a reader scrolls through the charts, they clearly see how the novel coronavirus may travel through aerosols, or small air particles, in an indoor space. The charts effectively dispel widespread beliefs that sitting six feet apart or keeping masks on throughout a long conversation will protect everyone in the room from getting infected.
Pandemic Backlash Jeopardizes Public Health Powers, Leaders (KHN, Dec. 15/ongoing): Since the summer, reporters at KHN and The Associated Press have produced stories in the publications’ joint “Underfunded and Under Threat” series, highlighting how public health departments across the nation were ill-prepared for the pandemic. (The dataset behind this series was a featured source in one of my early issues back in August.) This story focuses on the leaders of local public health agencies who have faced pressure to leave their jobs during the pandemic, putting faces to the impacts of budget cuts and anti-mask threats.
1 in 5 Prisoners in the U.S. Has Had COVID-19 (The Marshall Project, Dec. 18/ongoing): Similarly to the KHN story above, this article by criminal justice-focused outlet The Marshall Project is part of a broader reporting project. Since March, the Project has been compiling data on COVID-19 cases and deaths in prisons around the country, in partnership with The Associated Press. (Dataset available here.) This December article visualizes the full brunt of the pandemic in each state’s prisons—in South Dakota, three out of five prisoners have been infected—while also telling several individual stories about the people who have gotten sick in prison and the advocates who are fighting for them.
Remembering the New Yorkers We’ve Lost to COVID‑19(THE CITY, ongoing): Nonprofit local newsroom THE CITY is building an online memorial of the New Yorkers who have died due to COVID-19. As of December 18, the memorial includes 1,946 names—remembering about 8% of the over 24,000 New Yorkers who have been lost. Earlier in December, THE CITY hosted a two-day event series to honor the dead, including readings of poetry and the obituaries written by the publication’s staff. I also participated in a protest last summer during which hundreds of these names were read aloud; it was a sobering reminder of the people behind the COVID-19 data I use in my work every day.