
In the past week (November 3 through 9), the U.S. reported about 290,000 new COVID-19 cases, according to the CDC. This amounts to:
- An average of 41,000 new cases each day
- 88 total new cases for every 100,000 Americans
- 6% more new cases than last week (October 27-November 2)
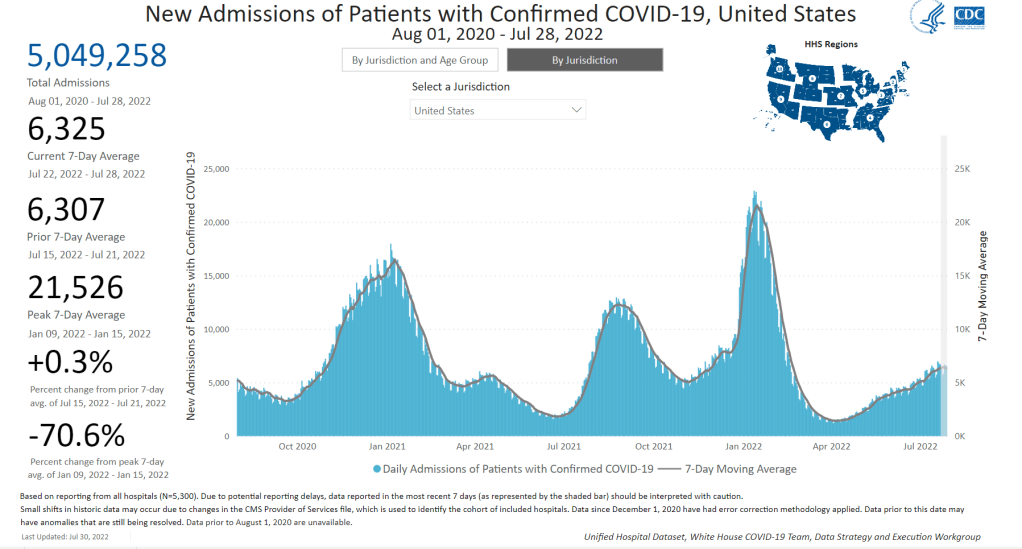
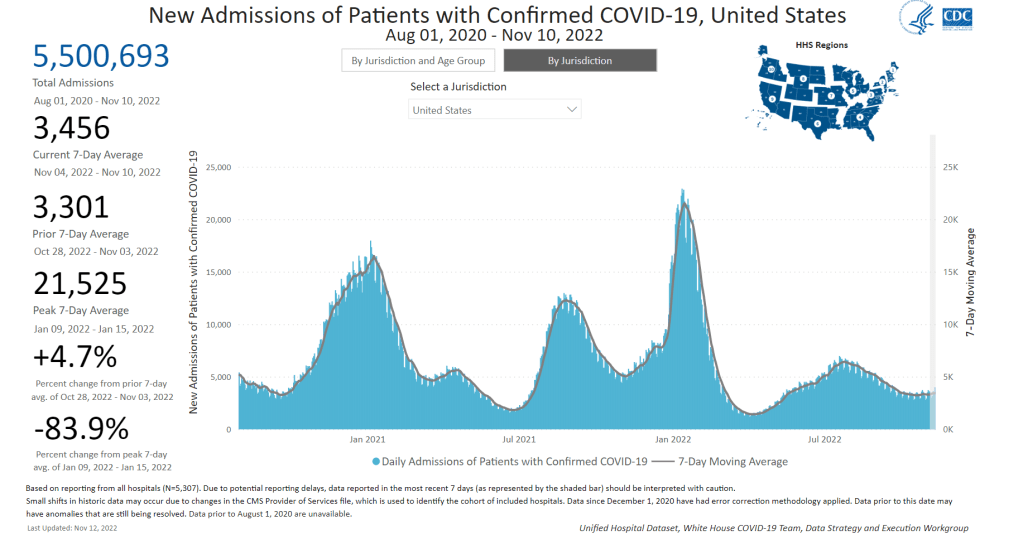
In the past week, the U.S. also reported about 24,000 new COVID-19 patients admitted to hospitals. This amounts to:
- An average of 3,500 new admissions each day
- 7.4 total admissions for every 100,000 Americans
- 5% more new admissions than last week
Additionally, the U.S. reported:
- 2,300 new COVID-19 deaths (340 per day)
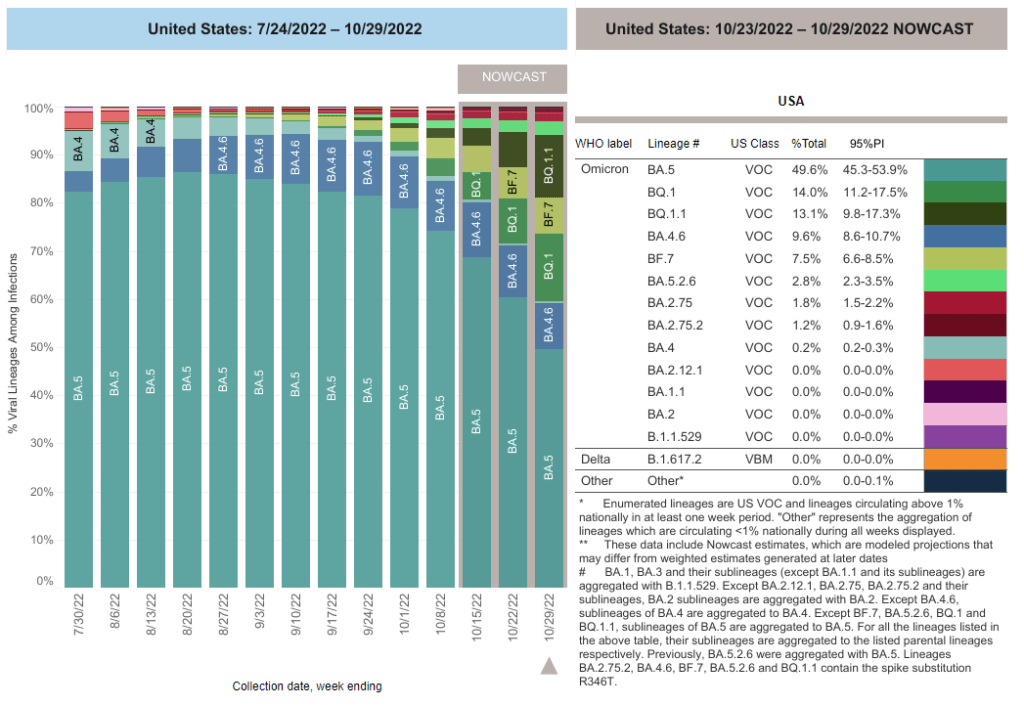
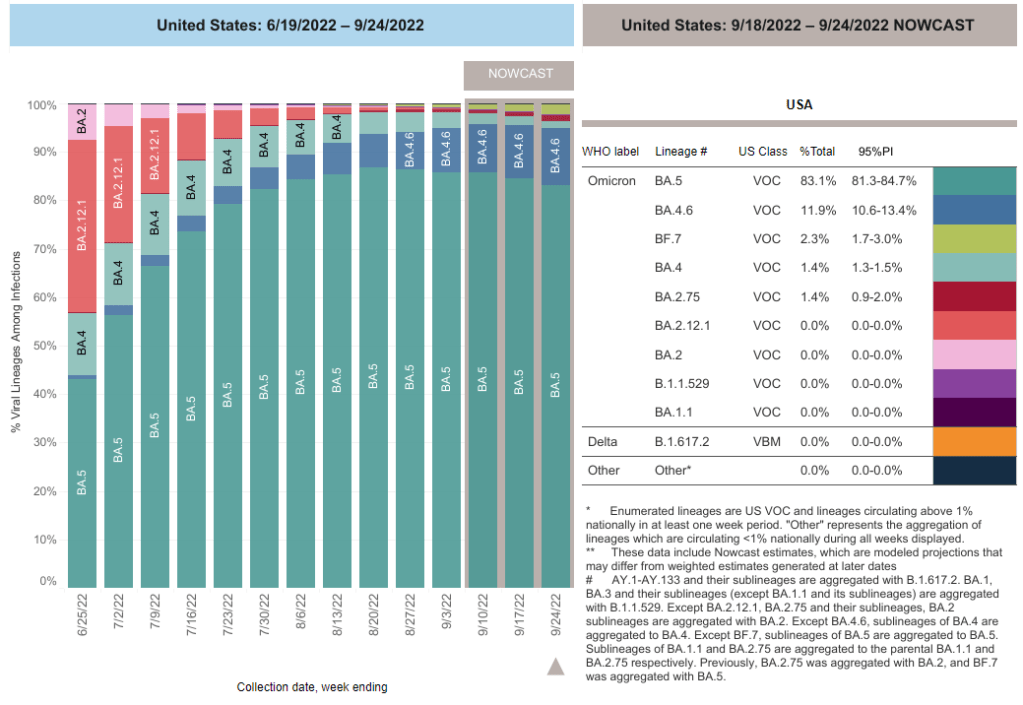
- 44% of new cases are caused by Omicron BQ.1 and BQ.1.1; 8% by BF.7; 2% by BA.2.75 and BA.2.75.2 (as of November 12)
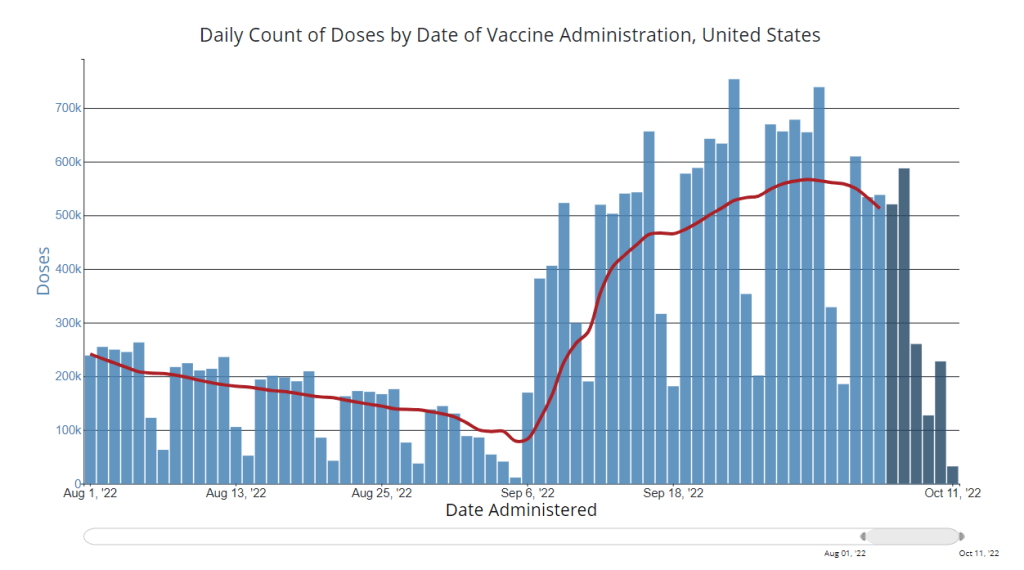
- An average of 400,000 vaccinations per day
We are beginning to see the impacts of colder weather and new variants this week, as both official COVID-19 cases and new hospital admissions went up slightly: increasing by 6% and 5% from the prior week, respectively.
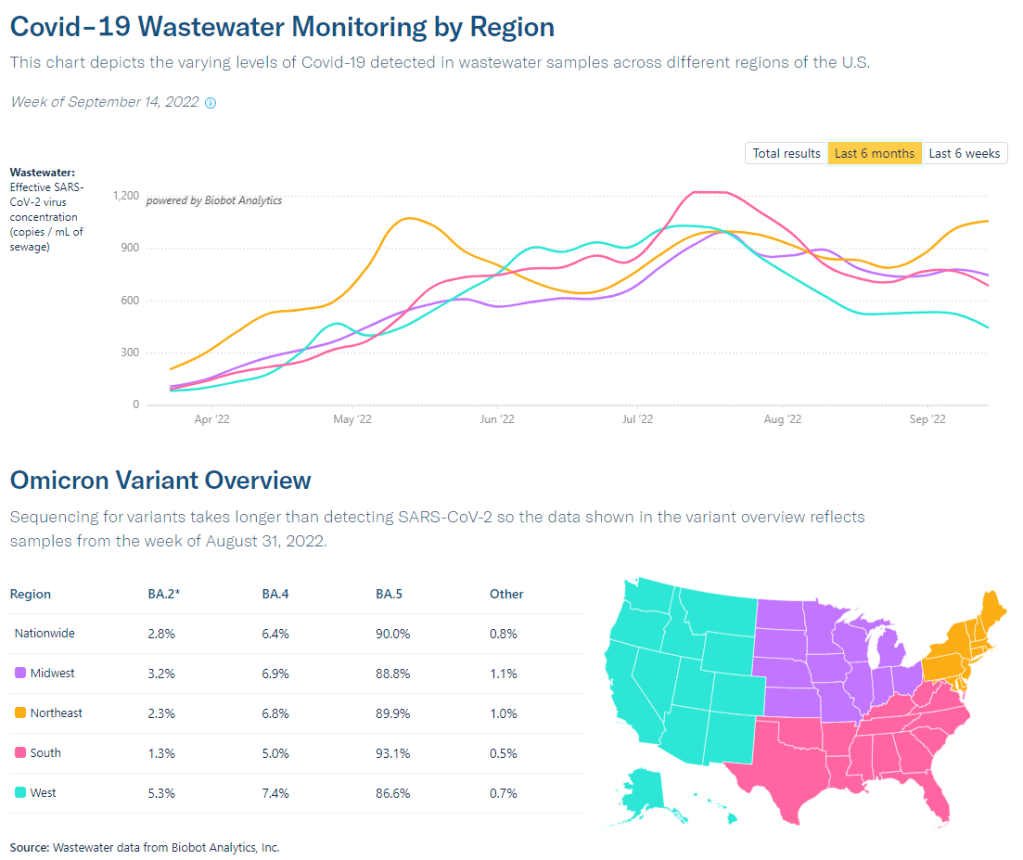
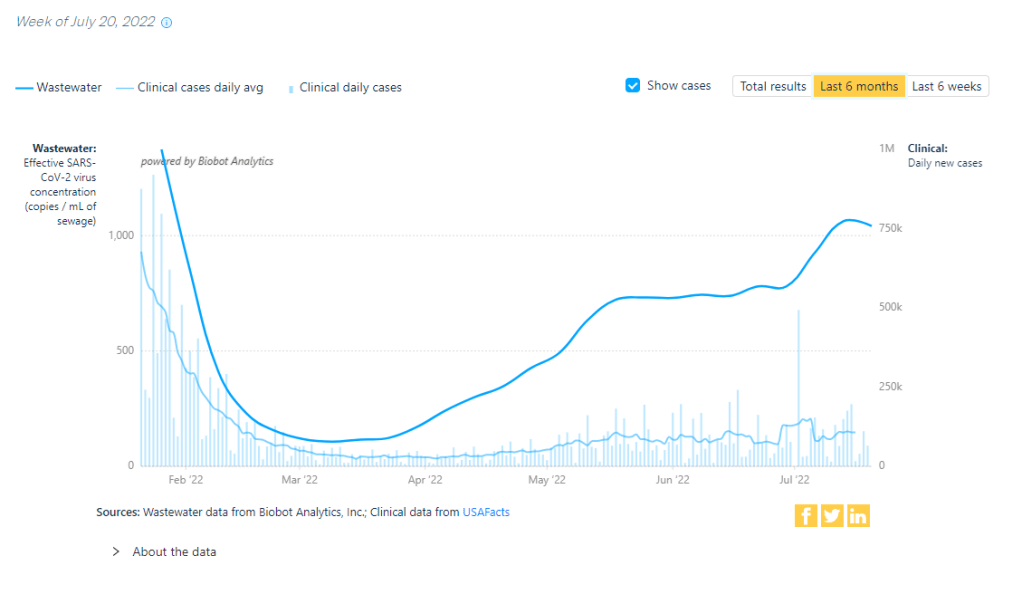
Wastewater monitoring similarly shows an uptick in coronavirus transmission at the national level, according to Biobot’s dashboard. The Northeast still has the highest virus concentration, but other regions of the country are catching up—particularly the West coast, which reported a significant increase in the last two weeks.
About half of the wastewater surveillance sites included on the CDC’s national dashboard reported increases in coronavirus transmission over the two-week period ending November 7, with 30% of sites reporting increases of at least 100%.
Omicron BQ.1 and BQ.1.1 are likely a major source of increased virus spread. These two strains—subvariants of BA.5 that are even more contagious—now account for 44% of new cases in the week ending November 12, according to CDC estimates. New variants tend to have an impact on transmission when they reach about 50% prevalence, so we will likely see more BQ-driven spread in the weeks to come.
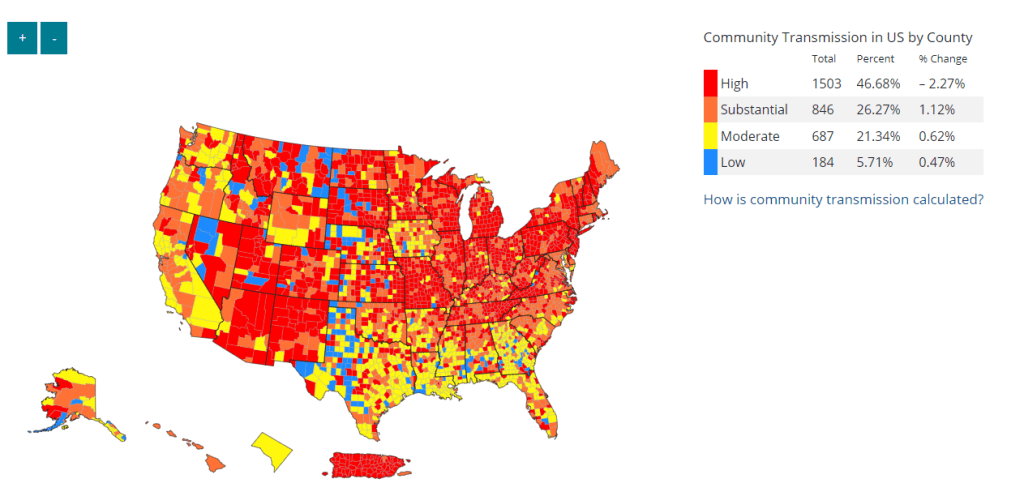
The New York/New Jersey region continues to report the highest amounts of BQ.1 and BQ.1.1: these variants represented about 60% of new cases in the last week. These two states also reported some of the highest (official) case rates in the country last week, along with Puerto Rico, New Mexico, and North Dakota, per the latest Community Profile Report. Cases and hospitalizations in New York City, often a bellwether for the rest of the country, are rising again.
At the same time, the U.S. is seeing an early and intense flu season. Most of the country’s Southeast region (from Virginia to Mississippi) reported the highest possible levels of influenza-like activity in the week ending November 5, according to the CDC. Flu, COVID-19, and RSV are all straining hospitals as we head into the holiday season.
The new, Omicron-specific booster shots provide enhanced protection against the latest variants, but uptake remains very low—as shown by new CDC data providing vaccinations by state. Only 10% of the eligible population has received one of the new shots, as of November 9.