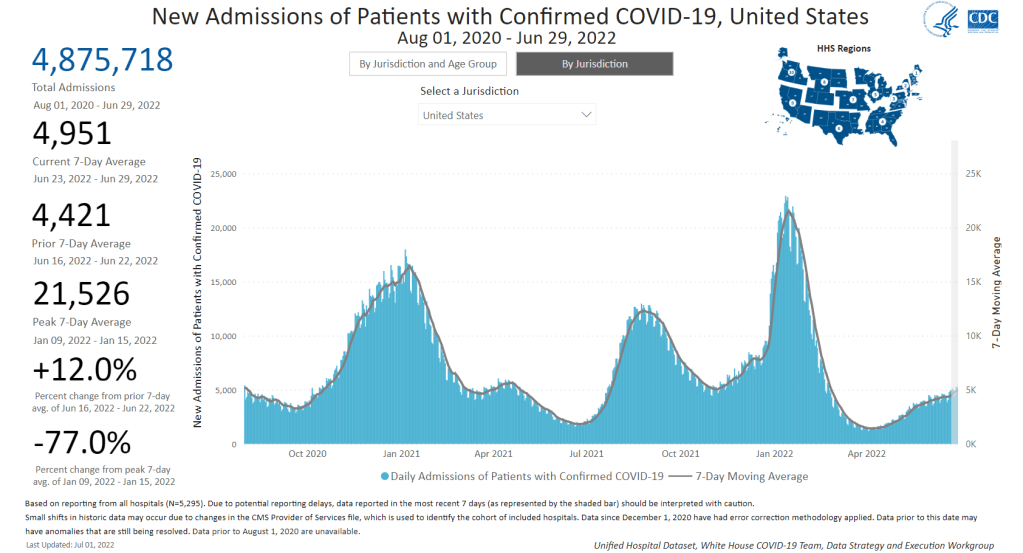
New hospital admissions for COVID-19 increased 12% last week over the week prior, a signal of the continued surge. Chart via the CDC.
In the past week (June 25 through July 1), the U.S. reported about 800,000 new COVID-19 cases, according to the CDC. This amounts to:
An average of 110,000 new cases each day
234 total new cases for every 100,000 Americans
11% more new cases than last week (June 18-24)
In the past week, the U.S. also reported about 35,000 new COVID-19 patients admitted to hospitals. This amounts to:
An average of 5,000 new admissions each day
10.6 total admissions for every 100,000 Americans
12% more new admissions than last week
Additionally, the U.S. reported:
2,200 new COVID-19 deaths (0.7 for every 100,000 people)
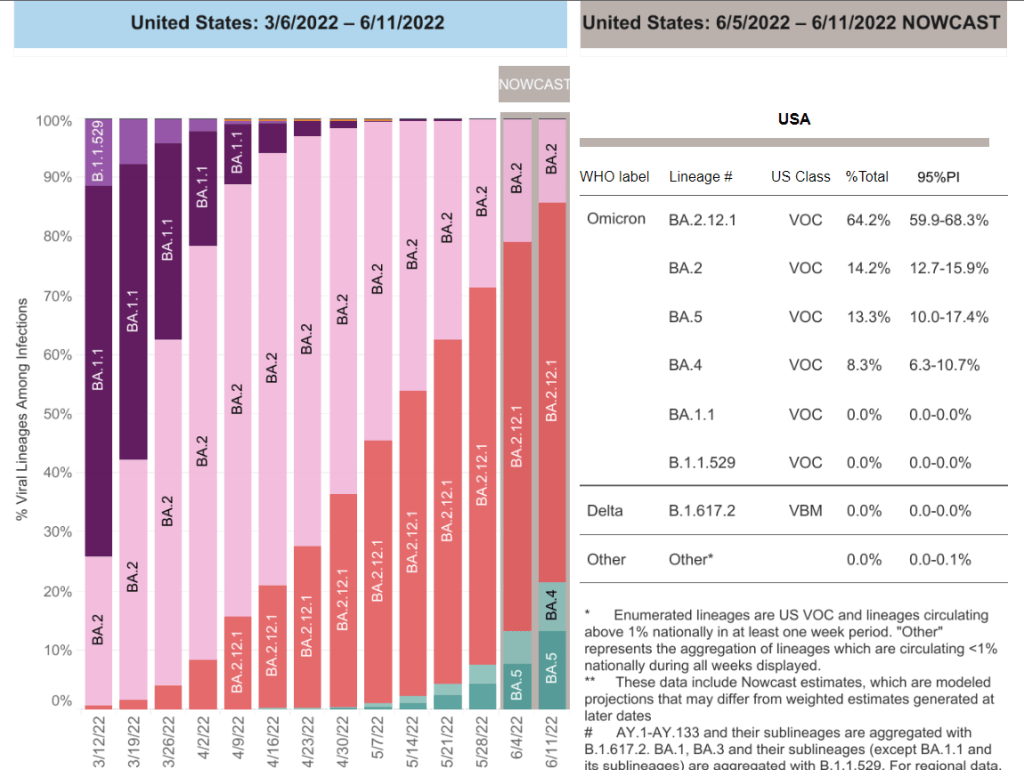
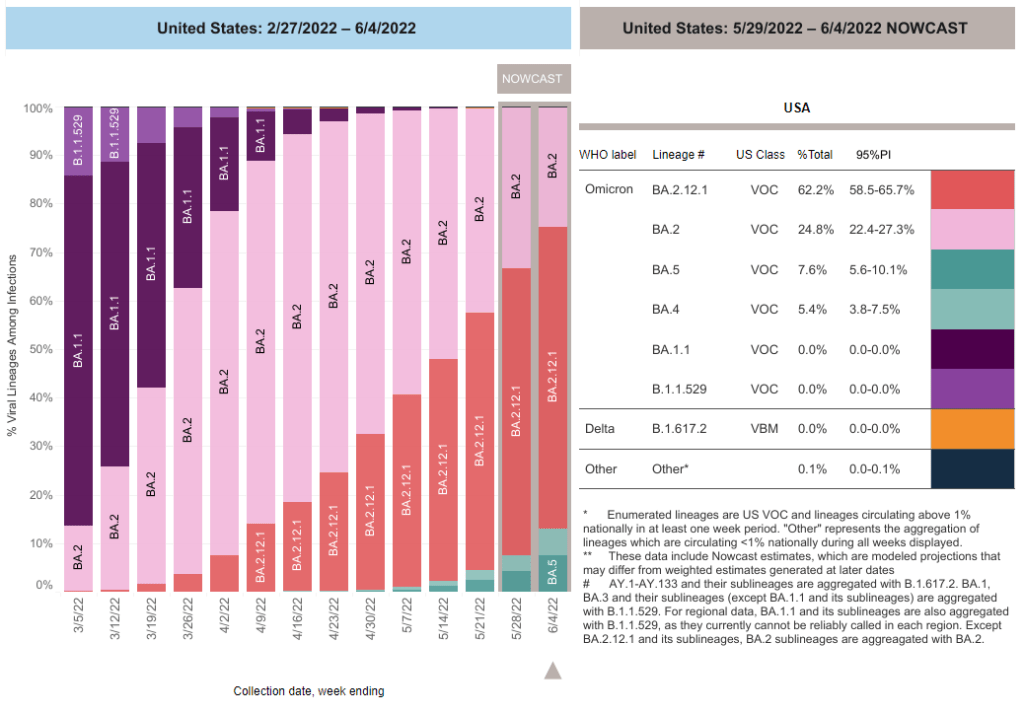
48% of new cases are Omicron BA.2.12.1-caused; 52% BA.4/BA.5-caused (as of June 25)
An average of 150,000 vaccinations per day (per Bloomberg)
BA.4 and BA.5 are now the dominant coronavirus lineages in the U.S., and they’re reviving our recent surge: from the plateau of recent weeks, national COVID-19 cases are clearly going up again. Reported cases rose 11% last week from the week prior. And, as always, this number is a significant undercount of true infections.
New hospital admissions also went up last week: about 5,000 Americans were admitted to hospitals with COVID-19 each day, up 12% from the week prior. While the vast majority of COVID-19 cases may now be mild—thanks to vaccinations, prior infections, and treatments—this is a reminder that severe symptoms are still very possible.
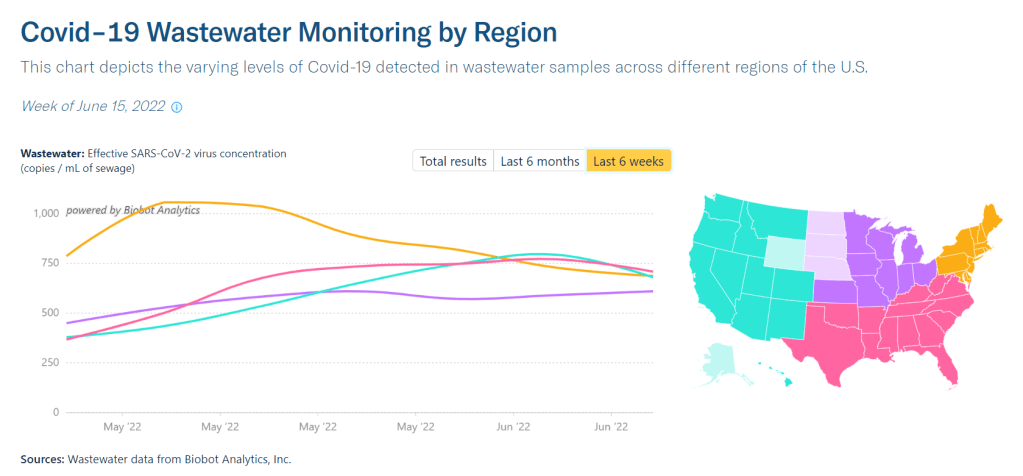
Wastewater data from Biobot indicate a continued plateau in transmission at the national level. At the regional level, COVID-19 levels are trending down in the West and South, but ticking up again in the Northeast, likely as BA.4 and BA.5 take over from BA.2.12.1 in these areas.
In my FAQ post last month ago, I wrote that scientists weren’t yet sure whether BA.4 and BA.5 would be able to outcompete BA.2.12.1, the offshoot of BA.2 first identified in New York. Now, it seems clear that BA.4 and BA.5 are capable of dominating: these two subvariants caused over half of new cases nationwide in the week ending June 25, as well as in most regions.
Missouri wastewater update. Numbers up again slightly from last week. BA.4/5 has overtaken BA.2.12.1 by a nose. The other Omicron sub-variants are holding steady. Still no sign of BA.2.75. This is the cumulative data from 61 sewersheds. pic.twitter.com/z9MUYkRylC
Even places like New York City, which saw a major BA.2/BA.2.12.1 wave, is now reporting another uptick in cases, according to data from the local health department. The city’s test positivity rate went over 10% on Thursday for the first time since January, a signal of the underreporting in recent weeks as PCR testing becomes less popular. And yet, city leadership is not interested in implementing any new safety precautions.
Remember, the problem with these subvariants is that they’re built for reinfection. Even if you had Omicron BA.1 in the winter, or even had BA.2 this spring, you could easily get BA.4 or BA.5. These infections are, at best, a week-long inconvenience, and at worst, could turn into Long COVID.
The holiday tomorrow will interrupt COVID-19 reporting, as holidays always do. Stay safe this weekend, and don’t be fooled if you see a brief downturn in case numbers.
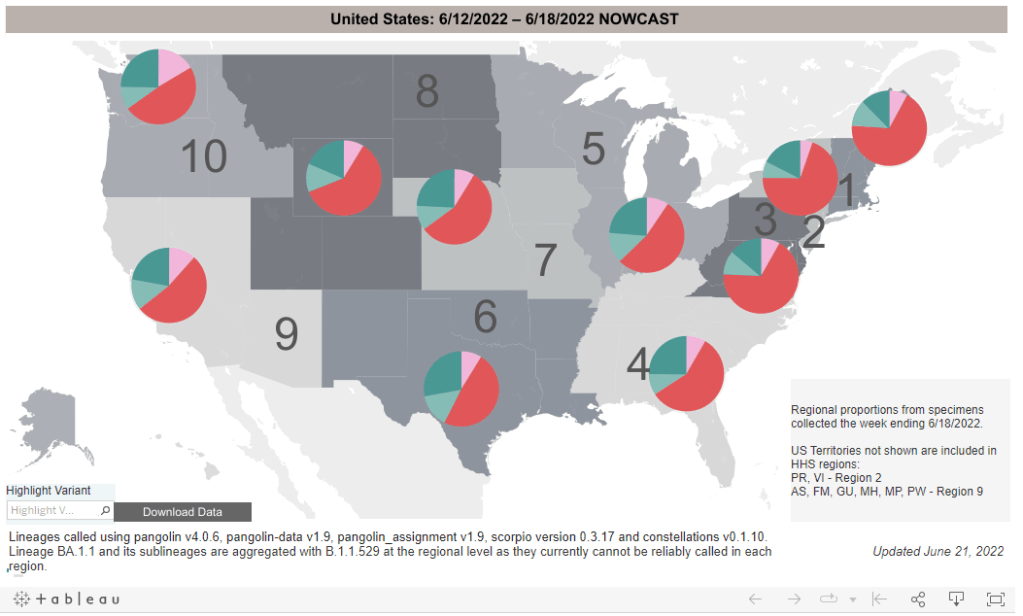
BA.4 and BA.5 (teal) are competing with BA.2.12.1 (red), with different lineages dominating in different parts of the country. CDC estimates reflect the week from June 12 to June 18.
In the past week (June 18 through 24), the U.S. reported about 680,000 new COVID-19 cases, according to the CDC. This amounts to:
An average of 100,000 new cases each day
208 total new cases for every 100,000 Americans
6% fewer new cases than last week (June 11-17)
In the past week, the U.S. also reported about 31,000 new COVID-19 patients admitted to hospitals. This amounts to:
An average of 4,400 new admissions each day
9.3 total admissions for every 100,000 Americans
1% more new admissions than last week
Additionally, the U.S. reported:
1,800 new COVID-19 deaths (0.5 for every 100,000 people)
56% of new cases are Omicron BA.2.12.1-caused; 35% BA.4/BA.5-caused (as of June 18)
An average of 50,000 vaccinations per day (per Bloomberg)
America’s Omicron subvariant surge continues to be in a plateau this week, with national COVID-19 case rates, hospitalization rates, and wastewater trends remaining fairly level or showing slight declines.
The U.S. has reported a weekly average between 100,000 and 110,000 new cases a day since mid-May, according to the CDC. These numbers are massive undercounts, as about five times more rapid antigen tests are being conducted in the U.S. than PCR tests, so the true trend is difficult to discern—but we can safely say that there is a lot of coronavirus circulating throughout the country.
New hospital admissions, the number of COVID-19 patients who sought treatment, rose slightly in the last week: about 4,400 patients were admitted each day nationwide, compared to 4,300 last week. Wastewater data from Biobot shows a national plateau, as coronavirus levels drop in the Northeast and West while rising in the South and remaining stagnant in the Midwest.
Why this prolonged plateau? Most likely, the rise of immune-evading Omicron subvariants BA.4 and BA.5 is preventing a BA.2-initiated wave from truly dipping back down. Estimates from the CDC suggest that BA.4 and BA.5 may even be outcompeting BA.2.12.1: the share of U.S. cases caused by BA.2.12.1 dropped for the first time in the CDC’s latest variant prevalence update, from 63% in the week ending June 11 to 56% in the week ending June 18.
Regions with a higher share of BA.4 and BA.5—namely, Gulf Coast states, the Midwest, and the West Coast—are also reporting case increases. A few state hotspots that stick out in the (admittedly, poor) official case counts: Hawaii, Florida, New Mexico, Alaska, and California all reported more than 250 new cases per 100,000 people in the week ending June 22.
In the Northeast, BA.2.12.1 is still causing a majority of cases, but BA.4 and BA.5 are gaining some ground. This may explain why places like New York City are seeing case trends that simply refuse to go down as quickly as we’ve observed in past waves, though a lack of new safety measures is likely also playing a role.
NYC this plateau is stressing me out*
*the usual caveats about underreporting, antigen tests not included, etc apply pic.twitter.com/6wKgebObOn
Meanwhile, vaccination rates remain the lowest they’ve been since late 2020. Fewer than 25,000 people received a first vaccine dose in the week ending June 21, according to the CDC. I was expecting to see a bump from children under five finally becoming eligible for vaccination, but it has not shown up in the data yet—likely another signal of current apathy towards COVID-19 safety.
BA.4 and BA.5 caused more than 20% of new COVID-19 cases nationwide in the week ending June 11, according to CDC estimates.
This week, I had a new story published at TIME’s online news site, explaining what Omicron BA.4 and BA.5 could mean for COVID-19 trends in the U.S.
The story makes similar points to my FAQ post on these subvariants from earlier in June: basically, BA.4 and BA.5 have evolved to get around antibodies from a prior coronavirus infection or vaccination, and the U.S. is likely to see a lot of reinfections from these subvariants—even among people who already had BA.1 or BA.2 earlier this year. BA.2.12.1 has mutated in a similar way, leading experts to suspect that one of these subvariants (or all three) will dominate the next phase of the pandemic.
When I talked to variant experts for my TIME story, I asked them for their thoughts on surveillance. “Is it getting harder to identify and track new linages like BA.4 and BA.5 as fewer people use PCR tests and more use at-home tests?” I asked. “What improvements or shifts would you like to see in surveillance?”
All three experts I spoke to had different perspectives, which I found interesting—and worth sharing in the COVID-19 Data Dispatch, since I wasn’t able to include this (somewhat wonkier) information in my TIME story.
Here’s what they said:
Marc Johnson, a microbiology and immunology professor at the University of Missouri who leads the state’s wastewater surveillance program, thinks that expanding wastewater monitoring is the way to go (though he admitted his bias, as someone who works in this area). “Sewershed monitoring is a really good way to track variants going forward,” he said. “It gives you a comprehensive view without costing you hundreds of thousands of dollars… or without having to sequence a thousand people.”
Shishi Luo, associate director of bioinformatics and infectious diseases at Helix (a genomics and viral surveillance company), is thinking about how to ensure her company consistently receives enough PCR test samples to get useful data from sequencing. At the moment, pharmacies and community testing sites are still providing enough samples that Helix has sufficient information to track variants, she said. But, anticipating that those numbers may dwindle, Helix is connecting with urgent care clinics and hospitals that do diagnostic testing. “I think those places will continue to collect samples and perform qPCR tests,” she said.
Paul Bieniasz, a professor at Rockefeller University who studies viral evolution, thinks that the current levels of surveillance are sufficient—at least, when it comes to policymaking and updating vaccines. “I would like to keep surveillance at a level such that such that we can have a pretty accurate picture about what’s going on,” he said. But he wants to prioritize “the really important things”: namely, understanding changes to vaccine effectiveness, which treatments to use, and identifying a new “major antigenic shift” like the one that produced Omicron as soon as it occurs.
“But it can always be better,” he said. “The more intense the surveillance, the more sensitive it is, and the earlier you detect things that might be of concern in the future.”
In the past week (June 11 through 17), the U.S. reported about 700,000 new COVID-19 cases, according to the CDC. This amounts to:
An average of 100,000 new cases each day
215 total new cases for every 100,000 Americans
8% fewer new cases than last week (June 4-10)
In the past week, the U.S. also reported about 30,000 new COVID-19 patients admitted to hospitals. This amounts to:
An average of 4,300 new admissions each day
9.2 total admissions for every 100,000 Americans
5% more new admissions than last week
Additionally, the U.S. reported:
1,900 new COVID-19 deaths (0.6 for every 100,000 people)
64% of new cases are Omicron BA.2.12.1-caused; 22% BA.4/BA.5-caused (as of June 11)
An average of 130,000 vaccinations per day (per Bloomberg)
National COVID-19 cases appeared to plateau this week, as some parts of the country seem to have peaked in their Omicron subvariants wave while others are still reporting increasing transmission. The CDC reported an average of 100,000 cases each day—as always, this is a significant undercount of actual infections due to changing test availability.
Major indicators are showing continued high transmission around the country. National cases have leveled off or slightly dipped, but the number of new COVID-19 patients admitted to hospitals increased by 5% compared to the prior week—continuing a trend of steady increases since early April. (Hospitalization trends usually lag case trends, but the increased unreliability in case reporting may have shifted this.)
Wastewater surveillance also suggests that COVID-19 spread remains at high levels nationwide, with a very slight dip in the last week, according to Biobot’s tracker. The Northeast region is a couple of weeks past the point of its surge, at this point; data from individual Northeast cities like Boston, New York City, and New Haven, Connecticut back up this trend.
West Coast, Midwest, and Southern states continue to report rising or plateauing transmission, according to Biobot. Wyoming, Nevada, Montana, and Utah reported the highest increases in official case counts this week (compared to the prior week), according to the June 16 Community Profile Report.
Some of these Midwest and Southern states are also reporting high prevalences of BA.4 and BA.5, the latest (and, likely, most contagious) Omicron subvariants yet. The CDC estimates that these two lineages caused about 21% of new cases nationwide in the week ending June 11. But these data are always reported with a significant lag, suggesting that the true prevalence could be closer to 50%.
As many of our local leaders, workplaces, and social circles continue to pretend that the pandemic is over—when we are actually facing one of the country’s biggest COVID-19 waves yet—remember that there are still options to protect yourself and your community. Safety measures like wearing a good mask, testing frequently, and gathering outdoors or in well-ventilated spaces are more important than ever.
Omicron BA.4 and BA.5 (shown here in teal) have been spreading rapidly in the U.S. in the last month. CDC data are as of June 4.
In the past week (June 4 through June 10), the U.S. reported about 760,000 new COVID-19 cases, according to the CDC. This amounts to:
An average of 110,000 new cases each day
233 total new cases for every 100,000 Americans
8% more new cases than last week (May 28-June 3)
In the past week, the U.S. also reported about 29,000 new COVID-19 patients admitted to hospitals. This amounts to:
An average of 4,100 new admissions each day
8.8 total admissions for every 100,000 Americans
8% more new admissions than last week
Additionally, the U.S. reported:
2,100 new COVID-19 deaths (0.7 for every 100,000 people)
62% of new cases are Omicron BA.2.12.1-caused; 13% BA.4/BA.5-caused (as of June 4)
An average of 90,000 vaccinations per day (per Bloomberg)
As I predicted last week, the brief dip in reported COVID-19 cases was a result of the Memorial Day holiday, not an actual signal of the BA.2/BA.2.12.1 wave reaching its peak. National case counts are up again this week, with the country still reporting over 100,000 new cases a day. And remember, the true infection rate could be five or more times higher, thanks to under-testing.
Hospital admissions, a more reliable metric (less impacted by holiday interruptions) also went up this week. The number of Americans admitted to the hospital with COVID-19 has risen steadily each week since early April.
Even as millions of people are protected from severe symptoms by vaccination or prior infection, many are still susceptible—whether they’re too young to be vaccinated or have not yet received booster shots for which they are eligible. Plus, the U.S. continues to have next to zero data on Long COVID cases, a debilitating, long-term condition that can impact even people who are fully vaccinated and boosted.
Highly contagious Omicron subvariants continue to drive this surge. BA.2.12.1, the subvariant first identified in New York, is now causing almost two-thirds of cases nationwide, according to the CDC’s latest estimates. Meanwhile, the agency is finally listing separate estimates for BA.4 and BA.5, subvariants with greater capacity to reinfect people (even those who already had other versions of Omicron.)
BA.4 and BA.5 caused about 13% of cases combined in the week ending June 4, and are spreading fast. These two subvariants are currently more prevalent in parts of the Midwest and South, while BA.2.12.1 is more dominant in the Northeast. This pattern might partially explain why the Northeast is seeing virus transmission decrease or plateau, while other regions report increases.
Wastewater data from Biobot show a similar picture: a downward trend in the Northeast, offset by upward trends in the other regions. Cities like Boston and New York City are showing somewhat confusing signals right now, as Memorial Day travel and gatherings may have interrupted the decline.
We’ve received several questions about the recent divergence between the @MWRA_update North & South Systems—our Epidemiology team found that this is not an abnormal divergence. 1/3 pic.twitter.com/0hihJHJazn
According to the CDC’s old community transmission levels (which are based on cases, not hospitalizations), about 96% of U.S. counties are currently reporting high transmission—and should recommend masking in public. But new mask requirements or other safety measures have been few and far between as this surge remains largely invisible.
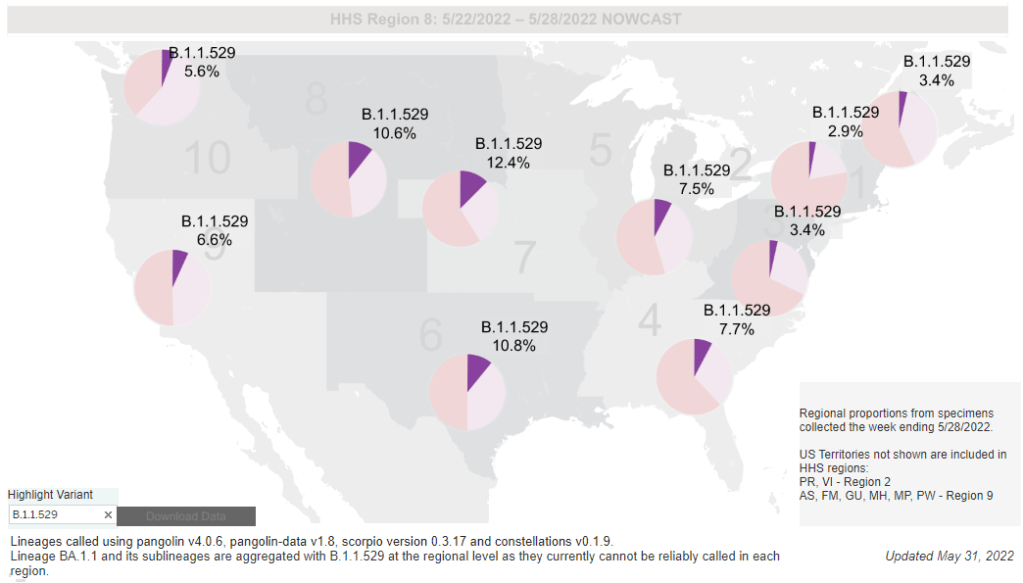
While the CDC is not yet reporting BA.4 and BA.5 separately, the subvariants are included in B.1.1.529; this grouping is driving increased transmission in some Midwestern and Southern states. Chart via the CDC variant dashboard.
America’s current COVID-19 surge is being driven by BA.2 and its sublineage BA.2.12.1. But there are other versions of Omicron out there to which we need to pay attention—namely, BA.4 and BA.5. Here’s a brief FAQ on these two subvariants, including why scientists are concerned about them and where they’re spreading in the U.S.
What are BA.4 and BA.5?
Remember how, when South African scientists first sounded the alarm about Omicron in November, they identified three subvariants—BA.1, BA.2, and BA.3? BA.1 first spread rapidly around the world, followed by BA.2.
Then, in the winter, South African scientists again identified new Omicron subvariants, called BA.4 and BA.5. These two variations split from the original Omicron lineage, and tend to be discussed together because they have similar mutations. (Specifically, they have identical spike protein mutations; this article discusses the mutations in more detail).
It’s important to note that, while South African scientists characterized these subvariants, they likely didn’t originate in the country. South Africa has a better variant surveillance system than many other countries, particularly compared to its neighbors, allowing the country’s scientists to quickly identify variants of concern. BA.4 and BA.5 also caused a new surge in South Africa, allowing for study of the subvariants’ performance.
Why are scientists concerned about these subvariants?
Early studies of BA.4 and BA.5 indicate that not only are these subvariants more transmissible than other forms of Omicron, they’re also more capable of bypassing immunity from prior infection or vaccination.
While the differences between BA.4/BA.5 and BA.1/BA.2 are less dramatic than the differences between the Omicron family and Delta, scientists hypothesize that there is still enough distinction between these two Omicron sub-groups that people who already had Omicron BA.1 or BA.2/BA.2.12.1 could potentially get reinfected by BA.4 or BA.5.
My guess based on this: BA.4/BA.5 escape, while not as dramatic as Omicron escape from vaccine or Delta immunity, is enough to cause trouble and lead to an infection wave. But not likely to cause much more severe disease than the previous wave, especially in vaccinated.
What are BA.4 and BA.5 doing in South Africa and other countries?
BA.4 and BA.5 have been detected in over 30 countries, according to CNN. But scientists have again focused on South Africa, as this country has better surveillance than many others—particularly as PCR testing declines around the world.
In South Africa, the BA.4/BA.5 wave that started in April has peaked and is now on the decline. Hospital admissions and deaths were lower in this recent wave than in the Omicron BA.1 wave in November and Decenter, largely thanks to high levels of immunity in the country. Still, the continued Omicron infections suggest that reinfection is a real concern for these subvariants.
Brief trip back into Covid data today:
Promising news from South Africa, where the BA.4 / BA.5 variant wave has passed quietly, with high levels of immunity meaning this wave has had little impact on rates of severe illness or death pic.twitter.com/C5W6iZzDLK
South Africa never really had a BA.2 wave, so BA.4 and BA.5 mostly competed with other Omicron lineages in that country. But in the U.K., which did face BA.2, recent data suggest that BA.4 and BA.5 have a growth advantage over even BA.2.12.1. In other words, BA.4 and BA.5 could potentially outcompete BA.2.12.1 to become the most transmissible Omicron subvariants yet.
What are BA.4 and BA.5 doing in the U.S.?
The subvariants are definitely here and spreading, but we have limited visibility into where and how much thanks to declined testing and surveillance. The CDC has yet to separate out BA.4 and BA.5 on its variant dashboard; according to White House COVID-19 Data Director Cyrus Shahpar, this is because the CDC has yet to identify these subvariants as causing 1% or more of new national cases in a given week.
Updated variant proportions just posted. BA.2.12.1 now estimated to be ~59% of specimens sequenced last week. BA.4 and BA.5 not yet meeting the 1%+ threshold to be listed separately https://t.co/YIeQkH8YmEpic.twitter.com/SsSyoVO5Gh
— Dr. Cyrus Shahpar Archived (@cyrusshahpar46) May 31, 2022
But the CDC does include BA.4 and BA.5 in its Omicron B.1.1.529 category, which has grown from causing 1% of new cases in the first week of May to causing 6% of new cases in the last week of the month. The number of cases sequenced in a week has dropped this spring compared to the first Omicron surge, leading me to wonder: are BA.4/BA.5 really causing fewer than 1% of new cases each, or do we just not have the data to detect them yet?
CDC data do show that the B.1.1.529 group (which includes BA.4/BA.5) is causing over 10% of new cases in the Plain States, Gulf Coast, and Mountain West—compared to under 5% in the Northeast, where BA.2.12.1 is more dominant. This data aligns with local reports of BA.4 and BA.5 spreading in wastewater in some Midwestern states that track variants in their sewage. For example, scientists at the Metropolitan Council in the Twin Cities recently said they expect BA.4 and BA.5 to “replace BA.2.12.1 as the dominant variants” in the next few weeks.
What could BA.4 and BA.5 mean for future COVID-19 trends in the U.S.?
As I noted above, data from the U.K. suggest that BA.4 and BA.5 could outcompete BA.2—and even BA.2.12.1—to become the dominant Omicron subvariants in the U.S. Early data from U.S. Omicron sequences are showing a similar pattern, reported variant expert Trevor Bedford in a recent Twitter thread.
“Focusing on the US, we see that BA.2.12.1 currently has a logistic growth rate of 0.05 per day, while BA.4 and BA.5 have logistic growth rates of 0.09 and 0.14 per day,” Bedford wrote. The country’s rising case counts can be mostly attributed to BA.2.12.1, he said, but BA.4 and BA.5 are clearly gaining ground. And, he noted, these two subvariants may be able to reinfect many people who already had BA.1 or BA.2.
Thus, we expect at least some portion of the BA.4 / BA.5 epidemics to be driven by increased vaccine breakthrough and increased reinfection relative to current BA.2 circulation. 12/12
In short: even more Omicron breakthrough infections and reinfections could be coming our way. Even if BA.2.12.1 transmission dips (as it seems to be doing in the Northeast), we could quickly see new outbreaks driven by BA.4 and BA.5—leading overall case numbers to plateau or rise again.
“For the summer, going into the winter, I expect these viruses to be out there at relatively high levels,” Dr. Alex Greninger from the University of Washington’s clinical virology lab told CNN. “Just the number of cases, the sheer disruptions of the workforce — It’s just a very high, high burden of disease.”
New Surgeon General advisory on health worker burnout: This week, U.S. Surgeon General Dr. Vivek Murthy released a new advisory on COVID-19 burnout among health workers, summarizing research on the issue and highlighting it as a public health priority. The advisory discusses a variety of societal, cultural, structural, and organizational factors contributing to health worker burnout, while tying this burnout to growing shortages of doctors and other health professionals. From the one-page summary of the advisory: “If not addressed, the health worker burnout crisis will make it harder for patients to get care when they need it, cause health costs to rise, hinder our ability to prepare for the next public health emergency, and worsen health disparities.”
CDC may change COVID-19 reporting for hospitals: The CDC is planning a few changes to its reporting requirements for hospitals in order to simplify the reporting process and cut down on redundant information, according to a draft plan shared with Bloomberg. Among the changes: hospitals may no longer be required to report suspected COVID-19 cases (i.e. those cases not yet confirmed with a PCR test); with most hospitals testing all patients when they’re admitted, suspected cases are less common and the data are less useful than they had been at earlier points in the pandemic. The CDC may also stop requiring COVID-19 reporting from some types of facilities, such as mental health centers, and may change the frequency of required reporting.
New preprint about Omicron BA.4 and BA.5: While the U.S. mostly worries about BA.2.12.1, additional Omicron subvariants BA.4 and BA.5 have been spreading in South Africa and other countries. A new study from a highly-regarded consortium of Japanese researchers suggests that BA.4 and BA.5 are about 20% more transmissible than BA.2 (similarly to BA.2.12.1). Also, even more concerning: the researchers found that BA.4 and BA.5 are more capable of resisting protection from a prior Omicron infection than BA.1. While the study has not yet been peer-reviewed, it garnered a lot of attention on Twitter this week from scientists warning that we need to watch out for these subvariants.
U.S. gets closer to a vaccine for kids under five: The FDA has set new dates for its vaccine advisory committee to review data on COVID-19 vaccines for children under age five: the committee will discuss both Moderna’s and Pfizer’s under-five vaccines on June 15, after discussing Moderna’s vaccine for children ages six to 17 on June 14. This announcement came after Pfizer and BioNTech released new data on their under-five vaccine, saying that a series of three doses provided strong protection against severe disease. There are some caveats for the data (which were shared via press release), but this is great news for children under age five and their families.
NIH sharing some COVID-19 technology (but not patents): I missed this news from earlier in May: the National Institutes of Health has made a deal with the World Health Organization’s COVID-19 Technology Access Pool and the Medicines Patent Pool to lisense 11 technologies used in COVID-19 vaccines and therapeutics. This lisense will allow pharmaceutical manufacturers around the world to make the coronavirus spike protein, RNA virus tests, and other COVID-19 components, increasing access to these technologies in low- and middle-income countries. Of course, it would be better for these countries if the NIH had shared full vaccine patents, but apparently that’s asking too much.