- COVID-19 Federal Datasets webinar: This past week, the health data research organization CareSet hosted a webinar walking the audience through the HHS’s Community Profile Reports and other facets of federal COVID-19 data reporting. The session featured Kevin Duvall from HHS and Amy Gleason from the U.S. Digital Services. If you use (or are interested in using) the Community Profile Reports, I highly recommend watching the recording; Duvall and Gleason provided great context on how the HHS stepped up its data collection this year.
- Subnational COVID-19 vaccination data: Barcelona-based data scientist Lucas Rodés-Guirao has compiled vaccination data at subnational levels (or, states and regions) for 20 different countries. The dataset includes the U.S. as well nations in Europe and South America; it’s sourced from public data released by national public health agencies.
- Anti-Asian Hate Incidents: Stop AAPI Hate, a national coalition documenting anti-Asian hate and discrimination during the COVID-19 pandemic, has released a new report with data on 2020 incidents. According to the report, Stop AAPI Hate has received 2,800 firsthand accounts of anti-Asian hate from 47 states and D.C. since the organization started collecting reports in mid-March.
Blog
-
Featured sources, Feb. 14
-
Next in vaccination data demands: More hyperlocal data

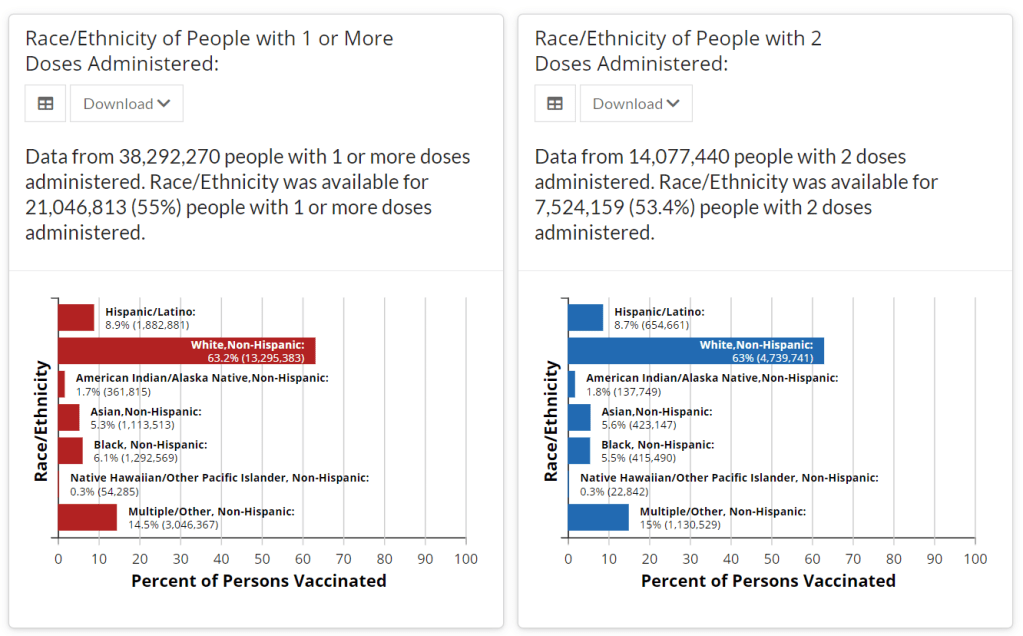
Demographic data released by the CDC; figures as of Feb. 14. The CDC continues to improve its vaccination reporting. The agency is now regularly reporting demographic data on its dashboard—including race, ethnicity, age, and sex. You can see counts for both U.S. residents who have received one and two doses. Like the rest of the CDC’s dashboard, the agency is updating these figures every day.
Advocates for greater equity in the vaccine rollout have pushed for such a data release for weeks. Meanwhile, more states than ever before are publishing their own demographic data: as of yesterday, we’re up to 33 states reporting race and/or ethnicity of vaccinated residents, 36 reporting age, and 32 reporting sex/gender.
But when it comes to tracking who’s getting vaccinated in America, we still have a long way to go. Now that demographic data are becoming more available at the federal and state levels, equity advocates are pushing for more local data—vaccinations by county, by town, by ZIP code.
New York City data reporter Ann Choi, for example, pointed out on Friday that this city has lagged behind cities such as Chicago and D.C. in releasing ZIP code-level vaccination data, which would allow researchers and journalists to see precisely which neighborhoods are getting more shots. And NYC ZIP codes are precise—I’m literally moving two blocks, but my ZIP code is changing.
(P.S. Ann will be speaking at the third workshop in the Diving into COVID-19 data series, on March 3, about her work at THE CITY!)
The Biden administration will soon start sending doses directly to Community Vaccination Centers, sites operated in partnership with existing community health clinics in an attempt to capitalize on existing connections that these clinics have in their neighborhoods. In order to judge the success of these clinics, we need data about their communities. Local data, demographic data, occupation data… the more complete picture that we can get, the better.
With more local data, we can do more stories like these:
- Across The South COVID-19 Vaccine Sites Missing From Black And Hispanic Neighborhoods (NPR)
- At This Early Stage of the COVID-19 Vaccine Roll-Out, Most Older Adults Have Not Yet Been Vaccinated As Supply Remains Limited (KFF)
- Covid-19 vaccination rates follow the money in states with the biggest wealth gaps, analysis shows (STAT)
Related posts
- Sources and updates, November 12Sources and updates for the week of November 12 include new vaccination data, a rapid test receiving FDA approval, treatment guidelines, and more.
- How is the CDC tracking the latest round of COVID-19 vaccines?Following the end of the federal public health emergency in May, the CDC has lost its authority to collect vaccination data from all state and local health agencies that keep immunization records. As a result, the CDC is no longer providing comprehensive vaccination numbers on its COVID-19 dashboards. But we still have some information about this year’s vaccination campaign, thanks to continued CDC efforts as well as reporting by other health agencies and research organizations.
- Sources and updates, October 8Sources and updates for the week of October 8 include new papers about booster shot uptake, at-home tests, and Long COVID symptoms.
- COVID source shout-out: Novavax’s booster is now availableThis week, the FDA authorized Novavax’s updated COVID-19 vaccine. Here’s why some people are excited to get Novavax’s vaccine this fall, as opposed to Pfizer’s or Moderna’s.
-
New schools guidance fails to call for data reporting
This past week, the Centers for Disease Control and Prevention (CDC) released a long-awaited guidance on school reopening.
While the CDC isn’t able to actually regulate what schools do, many state and local leaders look to the agency for advice on how to best follow the available scientific evidence. And, if you’ve been following the reopening debate, you know that there are a lot of differing opinions on how to best follow the available scientific evidence. Pro-opening advocates hoped to see the CDC strongly insist that schools go in-person, perhaps with limited cleaning and allowing less than six feet of distancing. Pro-closure advocates hoped to see the agency insist that teachers needed to be vaccinated before they could go back to their classrooms.
Rather than strictly advocating for either closed or open classrooms, however, the guidance takes a moderate route. It emphasizes three strategies already familiar to school leaders: layering different COVID-19 protection methods (masks, distancing, ventilation, and so on); looking at COVID-19 cases in the surrounding community to determine whether it’s safe for you to open; and having multiple opening “phases” available depending on community safety. Frequent testing and vaccinations of school staff are included as “additional” options, which the CDC suggests schools should employ if they have the resources.
New York Times reporter Apoorva Mandavilli, who has covered the epidemiological questions around reopening, wrote a Twitter thread that further explains why this is a moderate route:
My big question of this guidance, though, was: what does this mean for data? As we’ve written in the CDD before, the Biden administration has the opportunity to correct a longstanding failure of its predecessor. Under Biden, national public health leadership could require that all public schools report their case counts, testing numbers, and enrollment numbers to the federal government—and publish these figures in a systematic way. But the new CDC guidance largely retains the status quo for school COVID-19 data.
“Every COVID-19 testing site is required to report to the appropriate state or local health officials all diagnostic and screening tests performed,” the guidance says. This requirement has been in place since last spring. Similarly, the CDC says that school administrators should notify parents, teachers, and staff when cases are reported—again, such internal reporting systems are already in place.
But there’s no mention of making these data public. The CDC is not promising a national school data dashboard, or even requiring state and local public health departments to put their data up on a portal with the rest of their COVID-19 figures.
You’d think that state and local agencies wouldn’t need such a push, over a year into the pandemic. But, as we’ve reported in the CDD before, the vast majority of states currently fail to publish K-12 COVID-19 data in a way that makes it possible to actually track transmission rates in schools.
While 34 states and D.C. regularly report counts of COVID-19 cases that have occurred in schools, 16 states report incomplete data—or no data at all. And for the states that do report case counts, most don’t report enrollment numbers, making it difficult to discern whether the virus is impacting a single family or running rampant in a school. (Four cases in a school with 4,000 kids in classrooms, for example, is vastly different from four cases in a school with 100 kids in classrooms.)
New York continues to be the model state for K-12 data, as it’s one of only four to report enrollment numbers and the only state to report school-specific testing numbers. As the CDC seems to consider systematic school testing “optional,” it seems likely that this will continue.
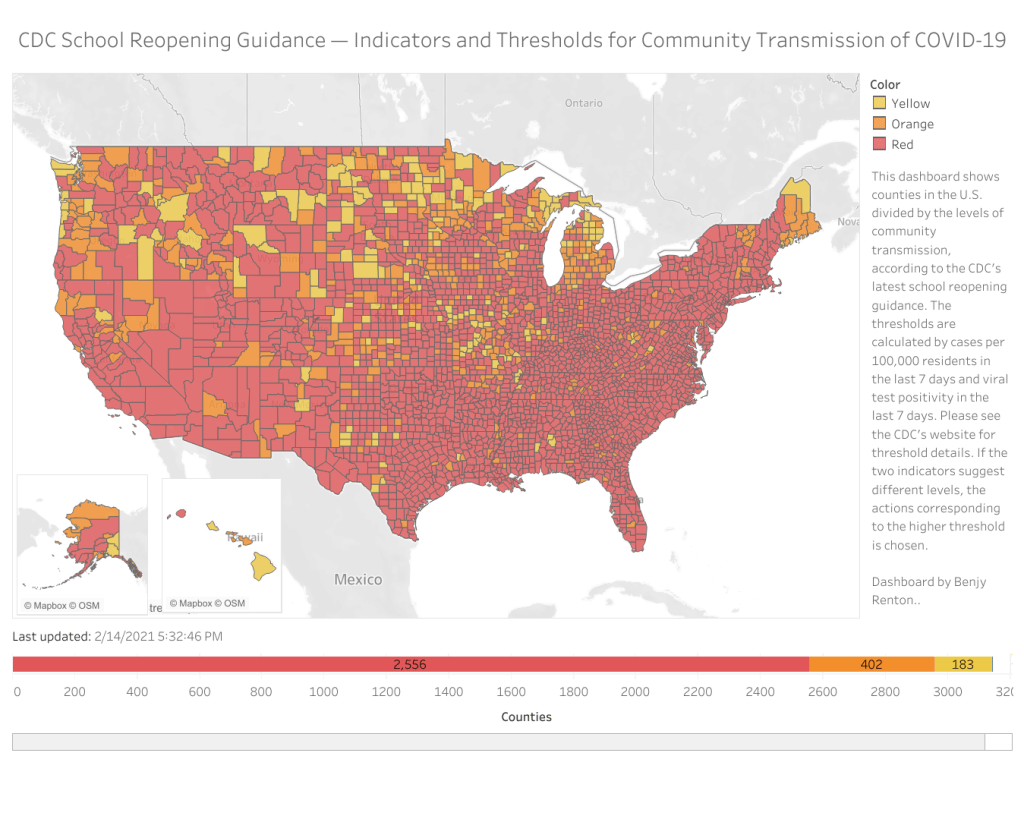
We can see that most counties in the U.S. have high enough community transmission rates—or, COVID-19 cases in the general public—that the CDC’s new guidance would categorize them as being in the “red zone,” a.k.a. too dangerous for schools to be open. But without case numbers for schools themselves, reported in a standard way, it’s hard to know whether the CDC’s assessment is accurate.
School data continues to be a massive gap in America’s pandemic tracking. Readers, I urge you to see what data are available for your state, county, and district—and push your local officials to be more transparent.
Dashboard by Benjy Renton.
Related posts
- COVID-19 school data remain sporadicOn November 18, New York City mayor Bill de Blasio announced that the city’s schools would close until further notice. The NYC schools discrepancy is indicative of an American education system that is still not collecting adequate data on how COVID-19 is impacting classrooms—much less using these data in a consistent manner.
- COVID-19 school data remain sporadic
-
National numbers, Feb. 14
In the past week (February 7 through 13), the U.S. reported about 656,000 new cases, according to the COVID Tracking Project. This amounts to:
- An average of 94,000 new cases each day
- 200 total new cases for every 100,000 Americans
- 1 in 501 Americans getting diagnosed with COVID-19 in the past week
The 7-day average for new cases was under 100,000 this week for the first time since October—but it’s still far above the records that America set during our spring and summer surges.

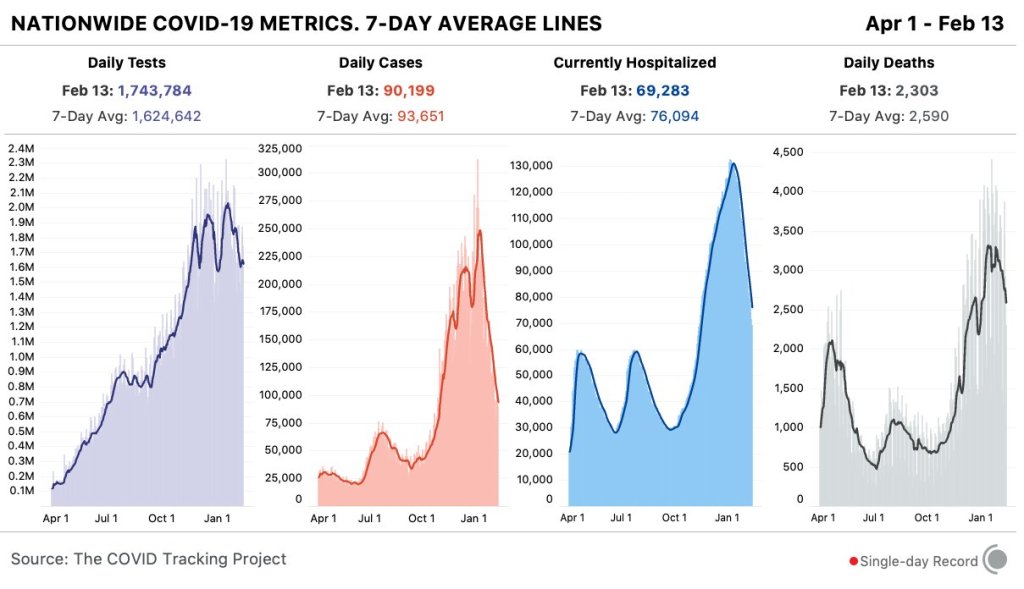
Nationwide COVID-19 metrics published in the COVID Tracking Project’s daily update on February 13. Cases, deaths, and hospitalizations are continuing to decline. Last week, America also saw:
- 69,300 people now hospitalized with COVID-19 (21 for every 100,000 people)
- 21,800 new COVID-19 deaths (6.6 for every 100,000 people)
- An average of 1.64 million vaccinations per day (per Bloomberg)
This past week, fewer Americans died of COVID-19 than any previous week in 2021, according to the COVID Tracking Project. In White House briefings this week, CDC Director Dr. Rochelle Walensky said that it will take a unified effort for us to continue this trend, especially as coronavirus variants pose an increased threat.
Nearly 1,000 cases of the B.1.1.7 variant (which originated in the U.K.) have been reported in the US as of February 11. Though the U.S. has increased our genomic sequencing efforts by about tenfold in the past three weeks, this number is still likely a significant undercount.
“We must continue to take action,” Dr. Walensky said on Wednesday—stressing the importance of wearing masks (yes, two masks at once!), physically distancing, and washing your hands.
-
COVID source shout-out: COVID Tracking Project
This past Monday, the COVID Tracking Project announced that it will soon close its operations. The Project will release its final update on March 7; then, after two more months of documentation, analysis, and archival work, it will close out in May.
“We didn’t come to this decision easily, but we have believed from the very beginning of the project that the work of compiling, publishing, and analyzing COVID-19 data for the US properly belongs to federal public health agencies,” the Project leads explain in a Tweet thread announcing the decision. “The CDC and HHS are now publishing data that is much more comparable to the figures we have been compiling from states since last spring.”
I recommend reading Erin Kissane and Alexis Madrigal’s article on the CTP website, which explains the decision more fully. They also note specific “good signs” of the federal government’s commitment to data transparency—all of which I’ve also covered in the CDD.
I’ve been volunteering for the COVID Tracking Project since early April 2020, and I have a lot of feelings about what that experience has meant to me. I’ll probably write a longer post about it on March 7 (which is, coincidentally enough, a Sunday). But for now, I’d like to say an enormous thank you to the staffers and volunteers who have worked to keep the Project going. It’s been an honor to contribute to this collective public service with all of you.
-
Federal data updates, Feb. 7
Since our main stories this week focused on NYC, here are a couple of updates from the federal public health agencies.
- CDC releases demographic vaccination data: This past Monday, the CDC published a MMWR report on characteristics of Americans vaccinated during the first month of our vaccine rollout, December 14 to January 14. Race/ethnicity data are missing for almost half of the vaccinations recorded here, but the existing data show white Americans getting vaccinated at higher rates than Black and Hispanic/Latino Americans.
- CDC vaccination dashboard now includes time series: As of Thursday, the CDC’s COVID Data Tracker now includes a page called “Vaccination Trends,” which shows daily counts of total doses administered, people receiving 1 dose, and people receiving 2 doses. The doses are assigned to the date they’re administered, not the date they’re reported, so they may not match time series on other dashboards. Time series aren’t yet available for individual states.
- KFF reports COVID-19 vaccinations by race/ethnicity: The Kaiser Family Foundation’s “State COVID-19 Data and Policy Actions” tracker now includes a dashboard with vaccinations by race/ethnicity, including data from 23 states as of Feb. 1. KFF says the data will be updated on a regular basis.
- U.S. Department of Education surveying COVID-19’s impact for students: On Friday, the Department of Education announced that the Institute of Education Sciences would collect “vital data on the impact of COVID-19 on students and the status of in-person learning.” Data gathered in the survey will include the share of America’s schools that are open in-person vs. remote, enrollment by various demographic metrics, attendance rates, and information on the logistics of in-person and remote instruction. Notably, the survey does not promise to collect data on COVID-19 cases, hospitalizations, and deaths associated with K-12 schools.
- At-home tests are coming: This week, the White House announced that the new administration has contracted with diagnostic company Ellume and six other suppliers to produce tens of millions of at-home tests by the end of the summer. Ellume’s test is an antigen test, and, though the other test suppliers haven’t yet been announced, we can assume they also make antigen or rapid nucleic acid amplification tests; neither test type is currently reported by the federal government. If these tests do become a significant part of America’s COVID-19 response—and some experts are skeptical that this will happen—a major change in test reporting practices will be needed.
-
Some optimistic vaccine news but variants still pose a major threat
Last week, Janssen, a pharmaceutical division owned by megacorp Johnson & Johnson, released results for its phase 3 ENSEMBLE study. The Janssen vaccine uses an adenovirus vector (a modified common cold virus that delivers the DNA necessary to make the coronavirus spike protein), can be stored at normal fridge temperatures, and only requires one dose. Here’s a table of the raw numbers from Dr. Akiko Iwasaki of Yale:
At first glance it does look like it’s “less effective” than the mRNA vaccines from Moderna and Pfizer. But, when you look at the severe disease, there’s a 100% decrease in deaths. No one who got the J&J vaccine died of coronavirus, no matter where they lived— including people who definitely were diagnosed with the South African B.1.351 variant. Here’s how that compares with the Moderna, AstraZeneca, Pfizer, and Novavax vaccines, per Dr. Ashish Jha of Brown:
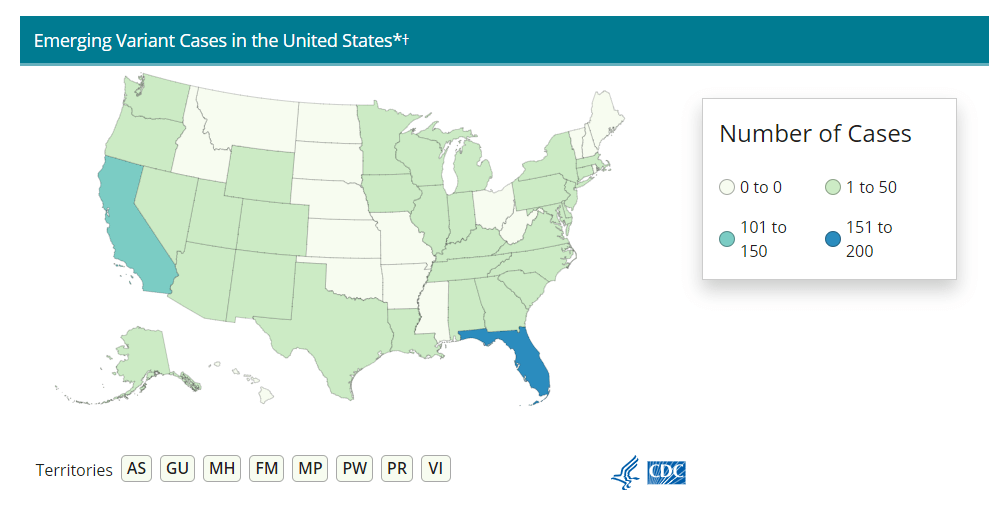
Nobody who got any of the vaccine candidates was hospitalized or died from COVID-19. That’s huge, especially as variants continue to spread across the U.S. (Here’s the updated CDC variant tracker.)
J&J’s numbers are especially promising when it comes to variant strains. Moderna and Pfizer released their results before the B.1.1.7 (U.K.) or B.1.351. (S.A.) variants reached their current notoriety, which makes J&J’s overall efficacy numbers look worse by comparison. But the fact that no one who got the J&J vaccine was hospitalized no matter which variant they were infected with is a cause for optimism. (B.1.351 is the variant raising alarms for possibly being able to circumvent a vaccine’s protection due to a helpful mutation called E484K. A Brazilian variant, P1, also has this mutation, though there’s not a lot of research on vaccine efficacy for this particular mutant.)
It also means that vaccination needs to step up. While it may seem counterintuitive to step up vaccinations against variants that can supposedly circumvent them, it’s important to note that there still was a significant decrease in COVID-19 cases in vaccinated patients from South Africa. A 57% drop compared with the 95% prevalence of the B.1.351 still suggests that vaccination can prevent these cases, and thus can seriously slow the spread of the variant.
What does all of this mean for COVID-19 rates? We can infer a few things. For starters, when vaccines are distributed to the general public around April or May, we may see hospitalization rates and death rates drop more than positive test rates. Positive test rates should obviously drop too, but they’ll probably stay at least a little higher than hospitalizations and death rates for a while.
Second, it means that we really need to ramp up sequencing efforts in the U.S.. We need more data to tell us just how well these vaccines can protect against the spreading variants, but we can’t collect that data if we don’t know which strain of SARS-CoV-2 someone gets. We here at the CDD have covered sequencing efforts – or lack thereof – before, but the rollout has still been painfully slow. CDC Director Rochelle Walensky stressed that “we should be treating every case as if it’s a variant during this pandemic right now,” during the January 29 White House coronavirus press briefing. But the 6,000 sequences per week she’s pushing for as of the February 1 briefing should have been the benchmark months ago. We’re still largely flying blind until we can get our act together.
Some states in particular may be flying blinder than others. As Caroline Chen wrote in ProPublica yesterday, governors of New York, Michigan, Massachusetts, California, and Idaho are planning to relax more restrictions, including those on indoor dining. Such a plan is probably the perfect way to ensure these variants spread, so much that even Chen was surprised at how pessimistic the outlook was when she asked 10 scientists for the piece.
The B.1.1.7 variant is expected to become the dominant strain in the U.S. by March, according to the CDC. And on top of that, the B.1.1.7 variant seems to have picked up that helpful E484K mutation in some cases as well. Per Angela Rasmussen of Georgetown University, if these governors don’t realize how much they’re about to screw everything up, “the worst could be yet to come.” God help us.
-
The volunteers working to make NYC vaccinations more accessible

Screenshot of the NYC Vaccine List homepage. When faced with entrenched disparities and a local government that doesn’t want to confront them, it can be difficult for singular individuals to step in and fill gaps. But the founders of NYC Vaccine List knew they could fill one specific gap: they built a better website for finding vaccination appointments.
The NYC Vaccine List website is simple—simpler than the official city site. Just go to the homepage, scroll past the instructions, and you’ll find a list of vaccine locations. For each location, the site clearly marks available appointments or, where this information can’t be automatically pulled in, provides a link to the location’s website and a note from the last NYC Vaccine List volunteer who checked it. When I checked it at about midnight this morning, Yankee Stadium appointments (for Bronx residents only) were at the top of the list.
I talked to Dan Benamy and Michael Kuznetsov, two of the founders of this project, over email last week; they told me more about how the NYC Vaccine List website works and their efforts to improve its functionality for all New Yorkers. This interview has been lightly edited and condensed for clarity.
Betsy Ladyzhets: I know the basics of the project’s methodology—you’re scraping the websites of different vaccination sites and compiling all the info in one place. But I’d like to know more about what running this site actually looks like on a day-to-day basis. What parts of the project are manual vs. automated? Are there regular hours that you work on updates?
NYC Vaccine List: The project is managed through a Discord chat server, which makes it possible for volunteers to communicate about certain topics in a group chat, as well as one-on-one when needed. Various responsibilities have been parcelled out to different volunteers based on their ability to help in different areas: maintaining the crawlers, calling to verify information that cannot be crawled, and reaching out to local organizations and press to help spread the word about the project. There are no fixed hours—as this is an all-volunteer effort, we fit this work in between our responsibilities to work and family. This means that it’s not that unusual for there to be work done well into the early hours of the morning!
BL: I saw on Twitter that you’re working on providing translations to make the site accessible in languages other than English. How is that going so far? Have you noticed any changes in the people using the site thanks to this change?
NYC VL: As of this week, the site can be translated on-demand using the “Language” button in the upper right hand corner of the site. We use the Google Translate widget, which is the same technology used by NYC.gov. The Google Translate widget is provided free-of-charge to COVID-related efforts. Our volunteers have reached out to friends and family to validate the translations, and received positive feedback that the translations make the site easier to use for a non-English speaker.
BL: So far, white New Yorkers are getting vaccinated at disproportionately high rates while Black and Latino New Yorkers are getting vaccinated at disproportionately low rates. What can the city do to make vaccination appointments more accessible for these groups? What role do you see your project playing in addressing this issue?
NYC VL: The social and epidemiological questions that come along with a mass vaccination effort are complex, and although we have volunteers that have experience in this realm, our organization is not in a position to make recommendations to the city. We hope to increase access to the vaccine by removing the burden of navigating dozens of websites and waiting for hours on hold in order to find a vaccine.
We have two simultaneous efforts that strive to make the site more equitable to all residents: First, we’ve prioritized technical fixes that make the site usable for non-English speakers, those with slow internet, those that cannot easily travel across the city, and those relying on screen-readers. Second, we’ve reached out to organizations around the city that directly work with underserved communities. In that outreach, we’ve made sure that the organizations are aware of our site, as well as that they have a direct line of communication back to us in case there is a way to improve the site for their communities and constituents.
BL: The city revamped its own vaccine portal recently; the updated site at least appears to be easier to use. Has this update impacted your project?
NYC VL: The new site is a big step in the right direction, and we’re thrilled to see it because it means more New Yorkers can easily find an appointment. First and foremost, the site should be usable for New Yorkers that visit it directly. Any challenges that we encounter while trying to visit it automatically are secondary, so we don’t have any gripes related to how the page is coded. We’re continuing our efforts to build a site that encompasses all available vaccine locations and appointments available to New Yorkers, which the new site does not yet do, and remain hopeful that the city will continue to make progress in this domain.
BL: What are your future plans for the project? Do you see yourselves keeping this going through future phases of vaccination?
NYC VL: At this point, we haven’t made future plans for the project. We’re energized by the short-term impact we’ve been able to make, and are hopeful that our project won’t be needed for much longer.
BL: What has been your favorite story so far of someone using the website to find an appointment?
NYC VL: We have a new favorite story every day, but one that came in a few minutes ago is top of mind: “Thank you. Thank you. Thank you. A lung transplant makes me a high-risk individual but the ways things are set up, my doctors could not help me get the vaccine. … NYC Vaccine List might literally be my lifesaver. I got my first shot yesterday, Feb. 3, after I spotted an opening on your site at 1:20 a.m. that morning. Thank you. Thank you. Thank you.”
Related posts
- Sources and updates, November 12Sources and updates for the week of November 12 include new vaccination data, a rapid test receiving FDA approval, treatment guidelines, and more.
- How is the CDC tracking the latest round of COVID-19 vaccines?Following the end of the federal public health emergency in May, the CDC has lost its authority to collect vaccination data from all state and local health agencies that keep immunization records. As a result, the CDC is no longer providing comprehensive vaccination numbers on its COVID-19 dashboards. But we still have some information about this year’s vaccination campaign, thanks to continued CDC efforts as well as reporting by other health agencies and research organizations.
- Sources and updates, October 8Sources and updates for the week of October 8 include new papers about booster shot uptake, at-home tests, and Long COVID symptoms.
- COVID source shout-out: Novavax’s booster is now availableThis week, the FDA authorized Novavax’s updated COVID-19 vaccine. Here’s why some people are excited to get Novavax’s vaccine this fall, as opposed to Pfizer’s or Moderna’s.
- Sources and updates, November 12
-
Access barriers lead to vaccination disparity in NYC
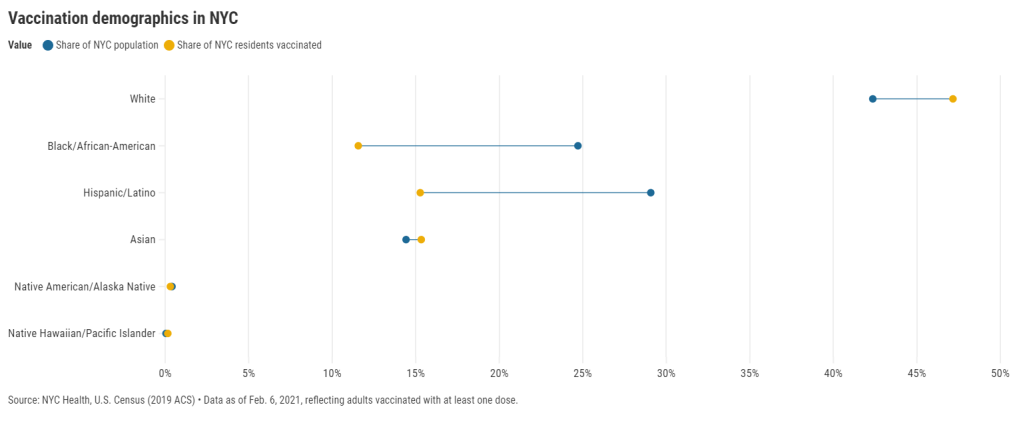
27 states are now reporting race and ethnicity data for their vaccinations. This week, New York joined that number. New York City also started reporting these data last Sunday, as we noted in that day’s issue. Despite promises from city and state leadership to prioritize equity in the vaccine rollout, the numbers so far are showing white New Yorkers getting vaccinated at much higher rates than their Black and Hispanic/Latino neighbors.
Here’s one way of visualizing the disparity: Black New Yorkers make up 25% of NYC’s population, but only 12% of those vaccinated. Latino New Yorkers make up 29% of the population, but only 15% of those vaccinated.
Here’s another way of visualizing the disparity: about 4.6% of white NYC residents have been vaccinated, compared to 2.2% of Latino New Yorkers and only 2% of Black New Yorkers. White New Yorkers are getting vaccinated twice as fast as their neighbors. This is particularly striking when you consider that Black and Latino New Yorkers disproportionately make up our essential workers—they constitute the majority of grocery workers, public transit workers, healthcare workers, childcare workers, and cleaning services workers, according to a March 2020 report by the NYC Comptroller’s office.
(Note: Asian American and Pacific Islanders make up a disproportionately large share of healthcare workers and Pacific Islanders have been particularly hard-hit by the pandemic; these two factors may help explain the high rate of vaccinations in the NYC Pacific Islander community.)
As someone who lived in NYC during the height of the city’s spring surge, I’ve seen how hard the pandemic has hit my neighbors of color. Sirens screamed through my north Brooklyn neighborhood at all hours, and hundreds of requests for aid came into my local mutual aid group. About 7,400 Black New Yorkers and 8,000 Latino New Yorkers have died of COVID-19 since the pandemic hit this city. In any version of an equitable vaccine rollout, these communities should be first in line.
So, what’s happening? Why are vaccinations for Black and Brown New Yorkers lagging? The answer is a combination of poor planning and poor access. The city didn’t set up appropriate systems to tell its most vulnerable communities about the vaccines or help them set up appointments. As a result, those NYC residents who have the time, know-how, and internet access to navigate a complex system are snapping up appointments—and you can guess which residents those are.
“What we’re going through now with the vaccine rollout reminds me of what we were going through at the beginning of the pandemic,” said Dr. Uché Blackstock, emergency physician and founder of the organization Advancing Health Equity, at a webinar with City Councilmember Mark Levine this past week. She described how she struggled to get enough tests and PPE to care for her patients—many of whom were Black and Latino essential workers—last spring.
Now, there’s both a supply gap and an information gap. In one example now infamous in the city, a vaccination site in Washington Heights (home to NYC’s Little Dominican Republic) was primarily catering to white patients from other parts of the city, the suburbs, and even New Jersey. Josefa Velasquez, a reporter at THE CITY who exposed the problems at this site, described how the vaccination center was ill-equipped to serve the population in its neighborhood:
At the door, most people entering appeared to be white and unfamiliar with the neighborhood. Some asked security guards where they could find parking. Nylon Longchamp handbags and Burberry scarves stood out.
Outside of the site, run by NewYork-Presbyterian Hospital near its Washington Heights medical center complex, Olga encountered another language barrier: None of the handful of guides and security guards outside directing people spoke Spanish.
Velasquez herself actually helped translate for some of the seniors trying to get vaccinated. After her reporting brought the vaccination center’s problems to light, the center limited all new appointments to NYC residents and reserved 60% of slots for Washington Heights residents. But the story is still indicative of larger issues: NYC data show that 23% of vaccinations in the city have gone to non-residents, and a significant majority of those non-residents are white.
Even when appointments are reserved for New Yorkers, barriers to vaccine access remain. Just this week, Yankee stadium opened as a vaccination site with all doses reserved for residents of the Bronx. Councilmember Levine posted on Friday that thousands of these appointments were still open, unreserved—while appointments elsewhere in the city get snapped up in minutes.
A reply to Levine’s Tweet reveals one reason: Bronx residents can’t access these Yankee stadium appointments through the NYC vaccination website, because this clinic is run by a network of private physicians. The city website is confusing enough already for many New Yorkers—and now that website doesn’t even encompass all available appointments.
Some residents of the Bronx also associate the stadium with invasions of their community:
At the same webinar that I cited earlier, Councilmember Levine announced a redesign of the official NYC vaccine appointment scheduler. The site’s design has been simplified and made more accessible. On the homepage, for example, users are provided with four options: Schedule First Dose, Schedule Second Dose, Reschedule Appointment, Cancel Appointment. But users still have to navigate through a checklist and input a lot of personal information in tiny boxes. And, while NYC does have a vaccine hotline, it “hasn’t been adequately staffed,” according to Levine—nor is there adequate translation.
In an ideal world, Dr. Blackstock suggests that doctors should call all their patients proactively to offer vaccine appointments. Community health workers should go door-to-door. Vaccination centers should be set up in every low-income housing development. NYC clearly dedicated nor the advance planning time nor the funding to such proactive measures. But the least we can do should be setting up an easy-to-use website and phone line, right?
(We also need more data on vaccinations by occupations, preexisting health conditions, and ZIP codes—but that’s a topic for another issue.)
Related posts
- Sources and updates, November 12Sources and updates for the week of November 12 include new vaccination data, a rapid test receiving FDA approval, treatment guidelines, and more.
- How is the CDC tracking the latest round of COVID-19 vaccines?Following the end of the federal public health emergency in May, the CDC has lost its authority to collect vaccination data from all state and local health agencies that keep immunization records. As a result, the CDC is no longer providing comprehensive vaccination numbers on its COVID-19 dashboards. But we still have some information about this year’s vaccination campaign, thanks to continued CDC efforts as well as reporting by other health agencies and research organizations.
- Sources and updates, October 8Sources and updates for the week of October 8 include new papers about booster shot uptake, at-home tests, and Long COVID symptoms.
- COVID source shout-out: Novavax’s booster is now availableThis week, the FDA authorized Novavax’s updated COVID-19 vaccine. Here’s why some people are excited to get Novavax’s vaccine this fall, as opposed to Pfizer’s or Moderna’s.
- Sources and updates, November 12
-
National numbers, Feb. 7
In the past week (February 1 through 6), the U.S. reported about 840,000 new cases, according to the COVID Tracking Project. This amounts to:
- An average of 120,000 new cases each day
- 257 total new cases for every 100,000 Americans
- 1 in 389 Americans getting diagnosed with COVID-19 in the past week
- 50% fewer new cases than we reported in the first full week of January

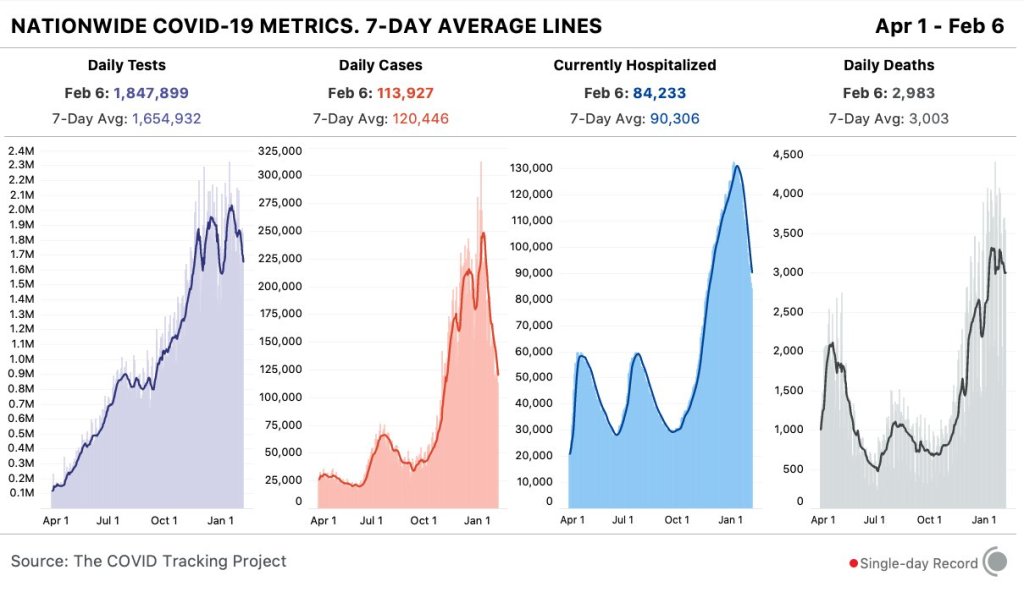
Nationwide COVID-19 metrics published in the COVID Tracking Project’s daily update on February 6. The U.S. reported fewer than 1 million new cases for the first week since Thanksgiving. Last week, America also saw:
- 84,200 people now hospitalized with COVID-19 (26 for every 100,000 people)
- 22,500 new COVID-19 deaths (6.9 for every 100,000 people)
- An average of 1.4 million vaccinations per day (per Bloomberg)
This is the first week in which America has reported fewer than 1 million new COVID-19 cases since Thanksgiving. Also, per the COVID Tracking Project, the number of Americans in the hospital with COVID-19 has decreased for 25 days in a row. Bloomberg reported a record 2.1 million vaccine doses yesterday. Whichever metric you look at, the news is good.
CDC Director Rochelle Walensky emphasized the declining rates in White House COVID-19 briefings this week. On Friday, for example, she noted that the number of new COVID-19 patients on February 2 was about 10,500—compared to the peak of 18,000 reported on January 5. Still, 10,000 new admissions was bad news when I reported this number at the end of November.
But, as I keep stressing in these updates, we can’t get too excited about the good news. As of February 4, the U.S. is up to 611 cases of the B.1.1.7 (or UK) variant, 5 cases of the B.1.351 (or South Africa) variant, and 2 cases of the P.1 (or Brazil) variant—and these numbers are likely significant undercounts. For more information on these variants and how they impact vaccination, read Sarah Braner’s post later in the issue.
