- New York Times COVID-19 tracker is back: After shutting down ahead of the ending federal public health emergency, the New York Times COVID-19 tracker has now resumed updates. Since the tracker is based on CDC data, case numbers and other major metrics are no longer available; but readers can find hospital admissions, deaths, and vaccinations nationally and by state, along with some local data based on hospital service areas. The NYT website doesn’t give much information about why they resumed updates—if anyone reading this can share what happened, please let me know! (And thank you to reader Robin Lloyd who flagged the renewed updates.)
- CDC Director calls for more data authority: CDC Director Rochelle Walensky appeared in front of Congress this week, speaking to Republican lawmakers for a hearing about her time leading the agency before she steps down at the end of June. One notable trend from the hearing, according to reporting by Rachel Cohrs at STAT News: Walensky acknowledged that the CDC wasn’t able to collect some key COVID-19 data points, such as vaccination rates for COVID-19 patients in hospitals. Walensky called for Congress to give the CDC more authority in collecting data from state and local health departments.
- CDC expanding its wastewater testing targets: Another CDC update for this week: the agency’s National Wastewater Surveillance System is expanding the pathogens that it will look for in sewage, Genome Web reports. NWSS plans to test for several respiratory viruses (COVID-19, flu, RSV), foodborne infections such as E. coli and norovirus, antimicrobial resistance genes, mpox, and other pathogens that may warrant concern. CDC scientists are working with the company GT Molecular to develop and test new assays. Other wastewater research groups are similarly developing tests to expand the health data that we get from sewage, I’ve learned in reporting for an upcoming story (which will be out later this summer).
- Genomic surveillance to keep tabs on Omicron’s evolution: CDC researchers invovled with tracking coronavirus variants shared some updates in a study published this week by the agency’s Morbidity and Mortality Weekly Report. As fewer people are getting PCR tests across the U.S., the CDC has access to fewer samples for sequencing than it did at prior points in the pandemic. As a result, scientists have had to update their analytical procedures for using available data to estimate how much different variants are spreading. According to the CDC, Omicron has dominated the U.S. since early 2022, with earlier BA lineages giving way to XBB.
- Fungal infections increased during the pandemic: In recent years, hospital patients have become increasingly at risk of infection with fungi, which can spread widely in healthcare settings. A new paper from the CDC adds evidence to this trend: fungal infections in hospitals have increased steadily from 2019 through 2021, the researchers found. The researchers also found that patients hospitalized with COVID-19 and a fungal infection had high mortality rates, with almost half of these patients dying in 2020-2021. COVID-19 can disrupt patients’ immune systems and make them more vulnerable to fungi, the researchers suggested. This is a major threat that’s likely to continue in coming years.
Category: Wastewater
-
Sources and updates, June 18
-
National numbers, June 11

Some NYC sewershed have reported substantial increases in coronavirus levels in recent weeks. Screenshot from the New York State wastewater dashboard. In the past week (May 28 through June 3), the U.S. reported about 7,200 new COVID-19 patients admitted to hospitals, according to the CDC. This amounts to:
- An average of 1,000 new admissions each day
- 2.2 total admissions for every 100,000 Americans
- 6% fewer new admissions than last week (May 21-27)
Additionally, the U.S. reported:
- 4.2% of tests in the CDC’s surveillance network came back positive (an 8% decrease from last week)
- 40% of new cases are caused by Omicron XBB.1.5; 26% by XBB.1.16; 21% by XBB.1.9 (as of June 10)
- (Biobot update delayed)
Nationally, the COVID-19 situation in the U.S. is similar to where we’ve been for the last few weeks. Major metrics (such as we have them) show an overall plateau in disease spread. Wastewater trends in a few places suggest a summer surge might be coming, but it’s hard to say for sure.
Hospital admissions and test positivity (from the specific network of labs reporting to the CDC) are trending slightly down at the national level. But there are still about 1,000 people being hospitalized with COVID-19 every day.
Biobot Analytics, my usual go-to source for wastewater surveillance data, did not update their dashboard this week due to a tech issue. The company’s most recent data, as of May 29, show plateaus in all four major regions.
The CDC’s National Wastewater Surveillance System (NWSS) shows a similar picture. Among about 1,100 sewage testing sites that recently reported to the CDC, 60% reported decreases in coronavirus levels in the last two weeks while 40% reported increases.
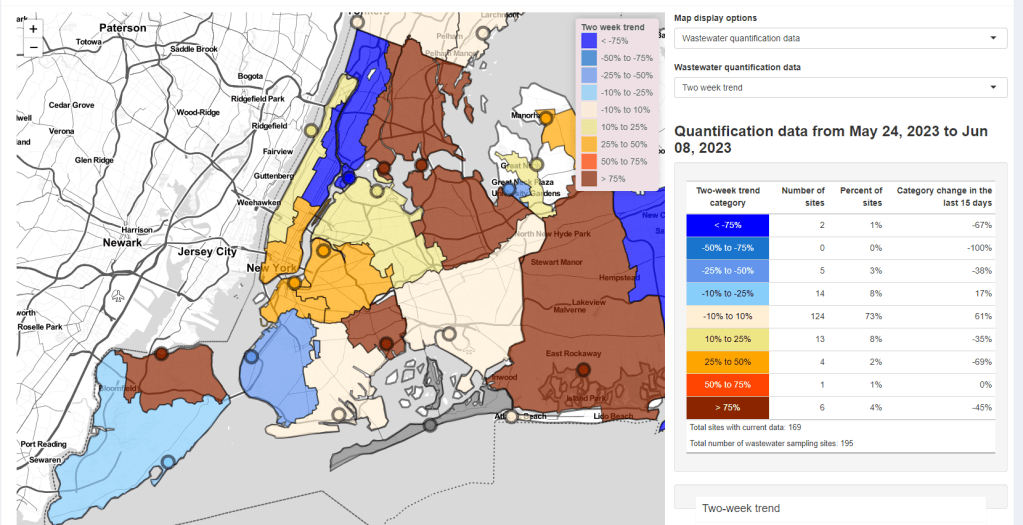
New York City is one of the places seeing wastewater increases, as I noted last week. Patterns differ somewhat across the city’s fourteen sewersheds, with some reporting more than 1000% increases in wastewater levels in recent weeks while others are still in plateaus.
Both the New York/New Jersey and New England regions are reporting slight upticks in their test positivity, according to the CDC’s surveillance network. This (along with the trends in NYC’s sewage) could be a precursor of more COVID-19 spread this summer, but it’s currently hard to say for sure.
The CDC updated its variant estimates (now reported every other week) this past Friday. XBB.1.5 is still the most common lineage, causing an estimated 40% of cases, the CDC reports. XBB.1.16 and XBB.1.9 continue to outcompete it, causing about 26% and 21% of cases respectively.
These newer lineages have yet to contribute to a significant shift in transmission, from what I can tell. We have yet to see if past immunity in the U.S. can hold off against the ever-evolving Omicron variants this summer.
-
Answering reader questions about wastewater data, rapid tests, Paxlovid
I wanted to highlight a couple of questions (and comments) that I’ve received recently from readers, hoping that they will be useful for others.
Interpreting wastewater surveillance data
One reader asked about how to interpret wastewater surveillance data, specifically looking at a California county on the WastewaterSCAN dashboard. She noticed that the dashboard includes both line charts (showing coronavirus trends over time) and heat maps (showing coronavirus levels), and asked: “I’m wondering what the difference is, and which is most relevant to following actual infection rates and trends?”
My response: Wastewater data can be messy because environmental factors can interfere with the results, and what may appear to be a trend may quickly change or reverse course (this FiveThirtyEight article I wrote last spring on the topic continues to be relevant). So a lot of dashboards use some kind of “risk level” metric in addition to showing linear trends in order to give users something a bit easier to interpret. See the “virus levels” categories on the CDC dashboard, for instance.
Personally, I like to look at trends over time to see if there might be an uptick in a particular location that I should worry about, but I find the risk level metrics to be more useful for actually following infection rates. Of course, every dashboard has its own process for calculating these levels—and we don’t yet have a good understanding of how wastewater data actually correlate to true community infections—so it’s helpful to also check out other metrics, like hospitalizations in your county.
Rapid test accuracy
Another reader asked: “Is there any data on the effectiveness of rapid tests for current variants like Arcturus? I’m hearing more and more that they are working less and less well as COVID evolves.”
My response: Unfortunately, I’m not aware of any specific data on rapid test effectiveness for recent variants. Early in the Omicron period, there were a few studies that showed the rapid tests still worked for that variant. The virus has obviously evolved a lot since then, but there is less interest in and fewer resources for evaluating these questions at this point in the pandemic, so it’s hard to say whether the continued mutations have had a significant impact on test effectiveness.
I think it’s important to flag, though, that rapid tests have never been highly accurate. People have tested negative on rapids—only to get a positive PCR the next day—since these tests were first introduced in spring 2021. The tests can be helpful for identifying if someone is contagious, with a high viral load, but are less accurate for people without symptoms. So, my recommendation with these tests is always to test multiple times, and to get a PCR if you have access to that. (Acknowledging there is less and less PCR access these days.) Also, if you were recently exposed to COVID-19, wait a few days to start rapid testing; see more details in this post from last year.
Double dose of Paxlovid
Another reader wrote in to share their experience with accessing Paxlovid during a recent COVID-19 case. The reader received a Paxlovid prescription, which led to a serious alleviation of symptoms. But when she experienced a rebound of symptoms after finishing the Paxlovid course, she had a hard time getting a second prescription.
“Fauci, Biden, head of Pfizer and CDC director got a second course of Paxlovid prescribed to them,” the reader wrote. “When I attempted to get this, my doctors pretended I was crazy and said this was never done.” She added that she’d like to publicize the two-course Paxlovid option.
My response: I appreciate this reader sharing her experience, and I hope others can consider getting multiple Paxlovid prescriptions for a COVID-19 case. The FDA just provided full approval to Pfizer for the drug, which should alleviate some bureaucratic hurdles to access. I also know that current clinical trials testing Paxlovid as a potential Long COVID treatment are using a longer course; 15 days rather than five days. The results of those trials may provide some evidence to support a longer course overall.
If you have a COVID-19 question, please send me an email and I’ll respond in a future issue!
-
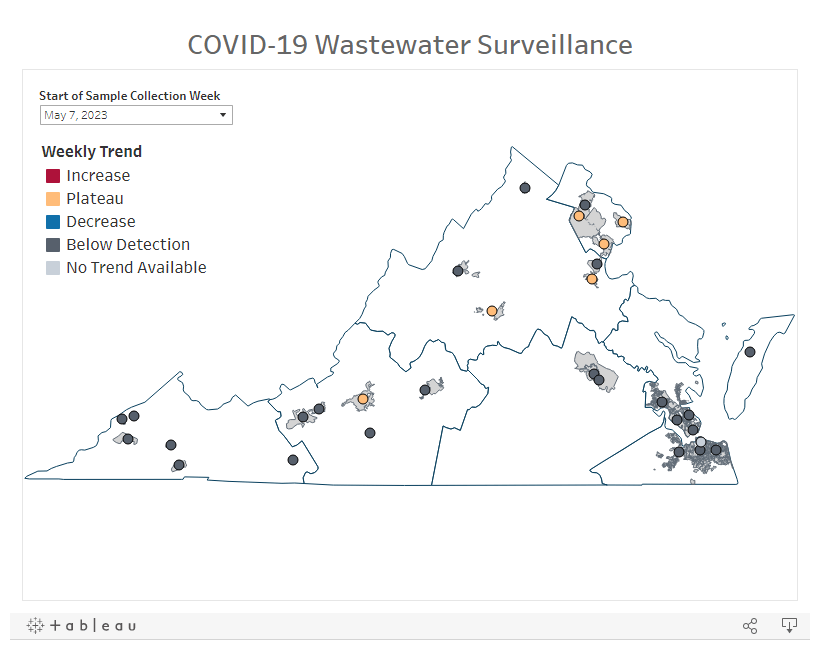
COVID source shout-out: Virginia’s new wastewater dashboard

One of the visuals available on Virginia’s new wastewater dashboard. With the public health emergency ending, a lot of state and local health departments are sunsetting or paring down their COVID-19 dashboards. Wastewater surveillance data are an exception, though, with agencies continuing to test sewage (and share the results) as other forms of COVID-19 testing become less available.
Virginia’s Department of Health is one notable example: this past week, the agency added a new wastewater surveillance section to its COVID-19 dashboard. The new section includes a map of testing sites, coronavirus trends by site, viral loads over time, and plenty of text explaining how to interpret the data.
This dashboard will be a great resource for Virginia residents aiming to continue following COVID-19 spread in their communities. It’ll be updated weekly on Tuesdays, according to the department.
-
National numbers, May 21

According to wastewater data from Biobot, COVID-19 spread right now is lower than at this time last year, but higher than the prior two years. In the past week (May 7 through 13), the U.S. reported about 9,200 new COVID-19 patients admitted to hospitals, according to the CDC. This amounts to:
- An average of 1,300 new admissions each day
- 2.8 total admissions for every 100,000 Americans
- 5% fewer new admissions than last week (April 30-May 6)
Additionally, the U.S. reported:
- A 4% lower concentration of SARS-CoV-2 in wastewater than last week (as of May 17, per Biobot’s dashboard)
- 64% of new cases are caused by Omicron XBB.1.5; 13% by XBB.1.9; 14% by XBB.1.16 (as of May 13)
- An average of 75,000 vaccinations per day
Nationwide, COVID-19 spread in the U.S. continues to be in a somewhat-middling plateau: lower than the massive amount of Omicron transmission we all got used to throughout late 2022, but still higher than the lulls between outbreaks we saw in prior years.
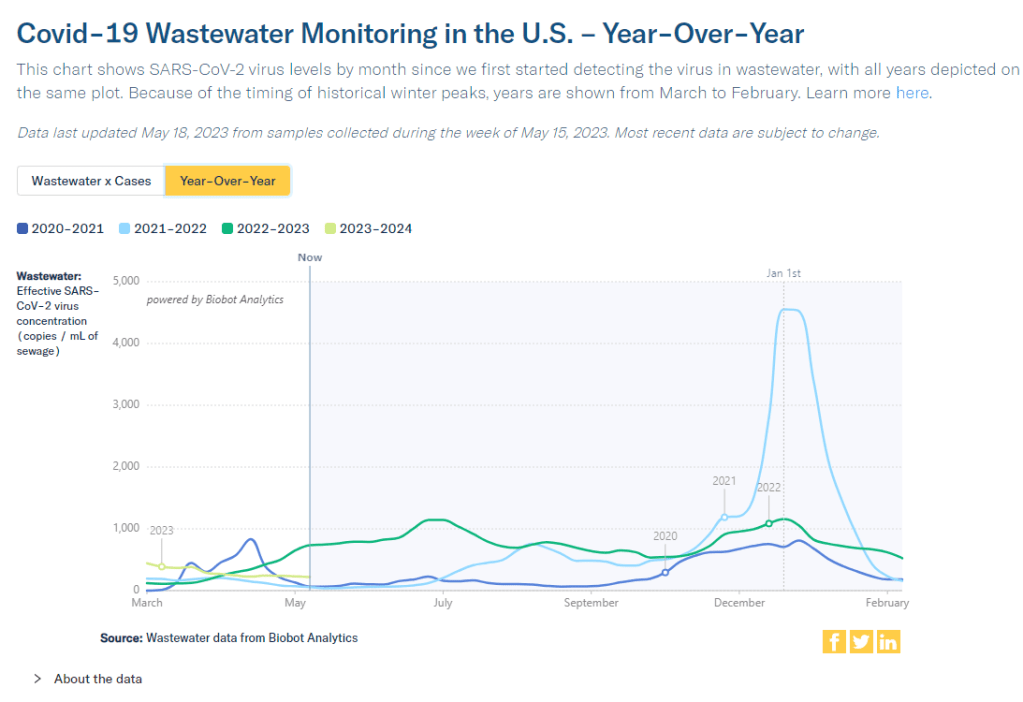
Biobot’s national wastewater surveillance offers a helpful visual for this comparison. As of May 20, the company calculates a national average of 221 viral copies per milliliter of sewage (a common unit for quantifying SARS-CoV-2 in wastewater), based on hundreds of sewage testing sites in its network.
In late May of last year, when early Omicron offshoots were spreading widely, this value was several times higher: 736 viral copies per milliliter. But around the same time in 2021 (when millions of Americans were getting their first vaccine shots) or 2020 (when the very first big surge had ended), wastewater concentrations were under 100 viral copies per milliliter.
It’s also important to note that wastewater concentrations have been fairly level for a couple of months now, both nationally and for all four major regions. High immunity across the population and a lack of divergent new variants have kept us from seeing a new surge since the 2022 winter holidays; but without widespread safety measures, I suspect we’re unlikely to see a drop in transmission below the current baseline.
Hospital admissions, now the CDC’s primary metric for tracking this disease, show a similar picture to the wastewater data. Numbers are low and ticking ever-so-slightly downward, but they’re not zero: about 1,300 people were admitted to hospitals with COVID-19 each day in the week ending May 13.
Deaths with COVID-19 also remain at low yet significant numbers. While the CDC reports only 281 deaths in the last week, this information is now presented with a greater delay than during the federal public health emergency, as the agency had to switch from death reports received directly from states to death certificate data. For the week ending May 6, the CDC revised its number up from about 300 to 622 COVID-19 deaths.
There are no changes to variant estimates this week, as the CDC is now updating that data every other week rather than weekly. XBB.1.5 remains the dominant variant, with XBB.1.16 and XBB.1.19 slowly gaining ground.
Overall, it’s getting harder to identify detailed COVID-19 trends, but a lot of data still do remain available. I’ll keep providing updates as best I can.
-
COVID source shout-out: Wastewater testing at the San Francisco airport
A few months ago, I wrote about how testing sewage from airplanes could be a valuable way to keep tabs on the coronavirus variants circulating around the world. International travel is the main way that new variants get from one country to another, so monitoring those travelers’ waste could help health officials quickly spot—and respond to—the virus’ continued mutations.
This spring, San Francisco International Airport became the first in the U.S. to actually start doing this tracking; I covered their new initiative for Science News. The airport is working with the CDC and Concentric, a biosecurity and public health team at the biotech company Ginkgo Bioworks, which already collaborates with the agency on monitoring travelers through PCR tests.
The San Francisco airport started collecting samples on April 20, and scientists at Concentric told me that they’re happy with how it’s going so far. Airport staff are collecting one sample each day, with each one representing a composite of many international flights. Parsing out the resulting data won’t be easy, but the scientists hope to learn lessons from this program that they can take to other surveillance projects.
Both scientists at Concentric and outside experts are also excited about the potential to monitor other novel pathogens through airplane waste (though the San Francisco project is focused on coronavirus variants right now). Read my Science News story for more details!
-
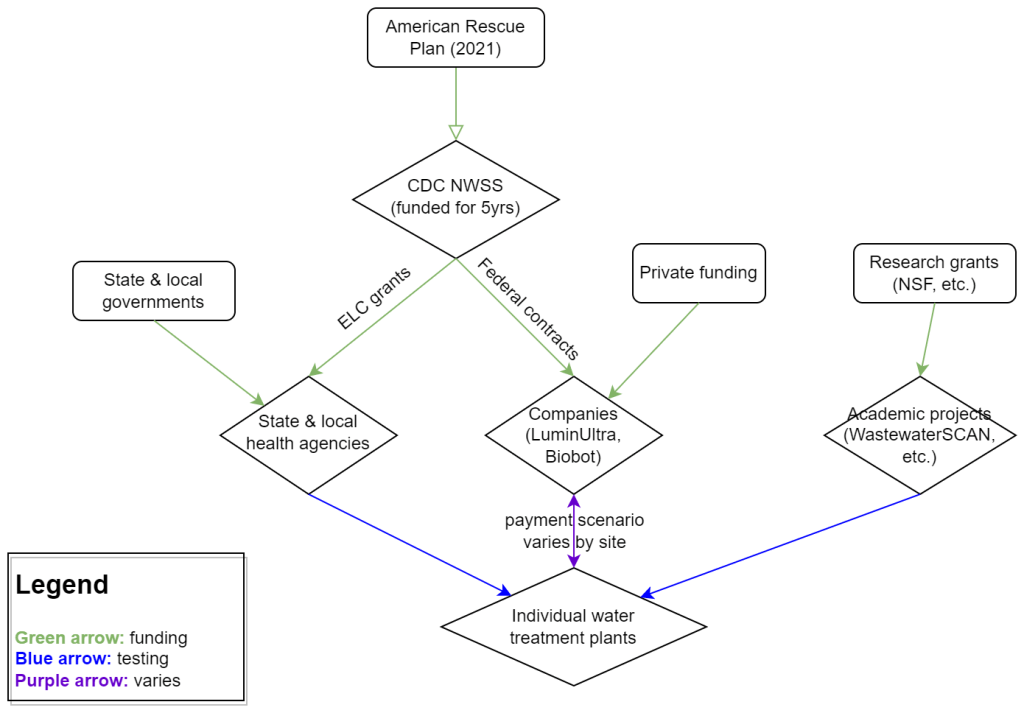
How wastewater surveillance is funded, and concerns for its future

My attempt to explain the wastewater surveillance funding ecosystem in one diagram. (Credit: Betsy Ladyzhets) This week, I have a new story out in Scientific American about why the wastewater surveillance infrastructure built during the pandemic may not last in the long term. While current monitoring projects aren’t likely to go anywhere right now, issues with funding, uneven commitments at state and local levels, and the overall novelty of this field may lead those programs to shut down in the coming years.
Here’s the story’s opening paragraphs:
During the past three years of the pandemic, testing sewage water for the virus that causes COVID has become a valuable tool: it has spotted surging infections and new variants weeks before they showed up in medical clinics, for instance. The technology has also warned of other health threats such as seasonal viruses and increased opioid use.
But now its long-term ability to protect public health is in jeopardy. Funding uncertainty from the federal government and uneven commitments from state health departments have raised the specter that wastewater monitoring programs may shut down in the future.
The U.S. Centers for Disease Control and Prevention’s National Wastewater Surveillance System (NWSS), which includes the majority of wastewater testing sites in the U.S., is “fully funded through 2025,” says Amy Kirby, director of the program. But after that, “new sources of sustainable funding” are needed, Kirby says, ideally through the CDC’s regular budget rather than resources tied to COVID. Uncertainty about money—along with logistical challenges and questions about how to interpret data from this relatively novel source—has made some state governments hesitant to invest in the technology, leading to an uneven national system.
My reporting for this piece involved interviews with the CDC, state and local public health agencies, and other major wastewater organizations (Biobot, WastewaterSCAN). I learned a lot about the overall ecosystem for funding wastewater surveillance, including a lot of somewhat-technical details that didn’t make it into the SciAm story. So, I’m sharing some of those details here.
Where wastewater surveillance funding comes from:
The primary funder for wastewater monitoring programs across the U.S. is CDC NWSS. The CDC itself received funding through the American Rescue Plan in 2021, sufficient to fully fund NWSS through 2025.
That CDC funding has gone in two main directions. First, the CDC has funded state and local public health agencies to set up (and maintain) their own wastewater testing projects. This is how most of the states with robust programs (places like New York, Utah, Virginia, Ohio) have funded their efforts. State and local health agencies may also receive funding from their own local governments, though most of the agencies I talked to for my story said they were primarily relying on the CDC. New York State is one major example of a state government funding wastewater surveillance right now.
And second, the CDC has set up national contracts with wastewater testing companies to supplement NWSS in places where monitoring otherwise might not be happening. The agency first contracted with LuminUltra in early 2022, then switched to Biobot Analytics last spring. Earlier this year, Biobot’s contract with the CDC was extended for six months, through July. After that, the agency plans to enter a new, five-year contract with a wastewater testing company that will cover COVID-19 as well as other emerging diseases, like mpox. This contract could go to Biobot or another company; the CDC is currently going through an application process.
Biobot and other private companies like it are also receiving funding from private sources, such as venture capital firms. In addition, individual water treatment facilities, local governments, and even businesses might set up contracts with private companies to help them test the wastewater in their jurisdiction. For example, Toronto’s Pearson Airport has contracted with LuminUltra to test wastewater from the airport terminals. In these cases, funding is coming from the specific organization that wants testing, rather than a larger program. Biobot also tests at hundreds of sites for free through its Biobot Network, in exchange for sharing the data publicly.
Finally, there’s a whole separate ecosystem of academic wastewater surveillance efforts, mostly run by university labs or research centers. WastewaterSCAN is the biggest example of this right now; the project was founded at Stanford and Emory Universities, but has since expanded through grants and philanthropic funding to cover about 150 sites across the country. Most academic projects either partner with specific treatment facilities in their areas or test the sewage on their campuses—SCAN is an exception with its broader scale.
Concerns for wastewater surveillance’s long-term future:
As you can probably tell by this description of the funding landscape, wastewater surveillance in the U.S. is pretty complicated. When scientists started testing wastewater for SARS-CoV-2 in spring 2020, this was basically a grassroots effort with different research projects across the country trying out different things. CDC NWSS has worked hard to compile data into one national system and develop standards, but the system is still far from unified.
For the CDC program to continue its efforts, the agency needs more long-term funding—and this funding shouldn’t be tied to COVID-19. The potential for wastewater surveillance to inform public health decisions goes far beyond this pandemic, and funding should reflect that potential; also, no COVID-specific funding packages have passed Congress since the American Rescue Plan, in 2021.
One way Congress could do this would be by expanding a funding system called “Epidemiology and Laboratory Capacity for Prevention and Control of Emerging Infectious Diseases,” or ELC. Most wastewater grants to state and local health agencies over the last couple of years have gone through ELC, though the funding came from the American Rescue Plan. Many of the health officials I talked to for my story like ELC, know how to fill out the annual applications, and would want to keep using it to receive wastewater funding.
Before the pandemic, the ELC program was drastically underfunded, I learned from experts at the Association of Public Health Laboratories (APHL). States’ applications historically “vastly exceed the money that CDC is given to put out for them,” APHL policy officer Peter Kyriacopoulos told me. APHL recommends that Congress should expand the program’s funding from $300 million per year (its pre-pandemic benchmark) to $800 million per year, or more. The ELC program is up for renewal this year, which could be an opportunity for Congress to add more permanent funding for wastewater surveillance and other epidemiological efforts.
More permanent funding could go a long way in convincing more state health agencies to invest in wastewater surveillance programs, rather than relying on outside assistance from companies like Biobot or academic partners. More data and guidance on how to actually use wastewater data to inform public health decisions would help, too, since many agencies are still figuring this out. Such investment at the state level would help make the country’s wastewater infrastructure more comprehensive, and more capable of responding to new health threats.
Instead, right now, we have an uneven system. Some places are regularly monitoring for COVID-19 and easily able to expand to new testing targets, while others might lose this valuable data source in the next year or two. For any local reporters reading this, I highly recommend digging into your community’s wastewater surveillance system, and figuring out whether it’s set up for the long term.
More wastewater data
-
COVID source shout-out: WastewaterSCAN’s newsletter

Map of WastewaterSCAN sites, from the project’s March 24 newsletter. A few weeks ago, I learned that the WastewaterSCAN project has a newsletter, which shares updates about COVID-19 and other diseases nationally and for the Bay Area in California. It’s a helpful resource for following infectious disease trends.
WastewaterSCAN, for any readers who might be unfamiliar, is a wastewater surveillance project founded by researchers at Stanford and Emory Universities. The project started in 2020 by monitoring wastewater in the Bay Area for SARS-CoV-2, but has since expanded to about 150 sites nationwide and six testing targets: the coronavirus, flu, RSV, mpox, norovirus, and human metapneumovirus (HMPV).
In the newsletter, the SCAN team shares summary data about all of these diseases, as well as some variant analysis for SARS-CoV-2. The language is sometimes a bit technical (as its primary audience is the team’s academic and public health partners), but still very useful for seeing where diseases are rising or falling. SCAN’s local updates are especially helpful for anyone living in the Bay Area.
Also, the SCAN team recently had a paper published in the Lancet discussing their work monitoring wastewater for diseases beyond COVID-19. The new article shows this technology’s potential for broader public health surveillance.
-
COVID-19 dashboards that haven’t shut down yet

The Health Equity Tracker, run by the Morehouse School of Medicine’s Satcher Health Leadership Institute, is one of a few COVID-19 dashboards that is not shutting down at this time. We are in an era of dashboard shutdowns. Government agencies, research groups, and media organizations alike are winding down their COVID-19 reporting efforts. Some of these changes are directly tied to the end of the federal public health emergency in May, while others are more broadly attributed to shifting resources.
In the last couple of weeks alone: the Johns Hopkins COVID-19 dashboard stopped collecting new data, the New York Times switched its COVID-19 tracker to show CDC data instead of compiling original information from states and counties, and the CDC itself announced that its COVID-19 data newsletter will end in May. The White House COVID-19 team will also be disbanded in May, according to reporting from the Washington Post.
I haven’t done a comprehensive review of state and local COVID-19 dashboards, but I’m sure many of those are similarly shutting down, reporting less frequently, and reducing the types of data that they offer to the public. This is a trend I’ve been following since early last year, when state health departments started to declare COVID-19 was now “endemic” and didn’t require special monitoring resources, PCR testing infrastructure, etc. But it’s been accelerating in recent weeks, following the White House announcement about the end of the federal emergency.
When explaining why their COVID-19 reporting efforts are ending, organizations often state that the disease is “no longer a major threat” or say that public interest in tracking COVID-19 has waned. I’m skeptical about both of those claims. First of all, we know that COVID-19 is still killing hundreds of Americans each week, with a majority of those being people who have had multiple vaccine doses. And we know that millions are facing activity limitations from Long COVID. As I wrote last month, the U.S. didn’t have a “mild” winter this year; we’re just getting better at ignoring COVID-19’s continued impacts.
And second of all, I know there’s still an audience for this work—including many of the people who remain most vulnerable to COVID-19. Thank you to everyone who regularly reads this newsletter and blog, sends me questions, shares my work on social media, etc. for constantly validating that the interest is still here.
With all of you great readers in mind, I’ve compiled this list of COVID-19 dashboards that I know haven’t yet shut down. The list is focused on national sources rather than state/local or international ones, in the interest of being most helpful to the majority of readers.
- CDC COVID Data Tracker: The CDC’s COVID-19 dashboard is, of course, the primary source for federal data at this point in the pandemic. It provides weekly updates for most metrics (cases, hospitalizations, deaths, vaccinations, variant estimates, etc.); wastewater surveillance data are updated daily, with individual testing sites reporting on different cadences (usually about twice per week).
Post-PHE update: Still active, but greatly changed. Cases and testing metrics are no longer available (with testing labs and state/local health agencies no longer required to report to the CDC), while other key metrics are updated less frequently or with more of a delay. See this post for more details. - Census Household Pulse Survey: Since early in the pandemic, the U.S. Census’ Household Pulse Survey has provided data on how COVID-19 impacted Americans’ day-to-day lives. This survey’s most recent iteration is scheduled for March through May 2023. The Census collaborates with other federal agencies on its surveys, including the CDC for Long COVID questions.
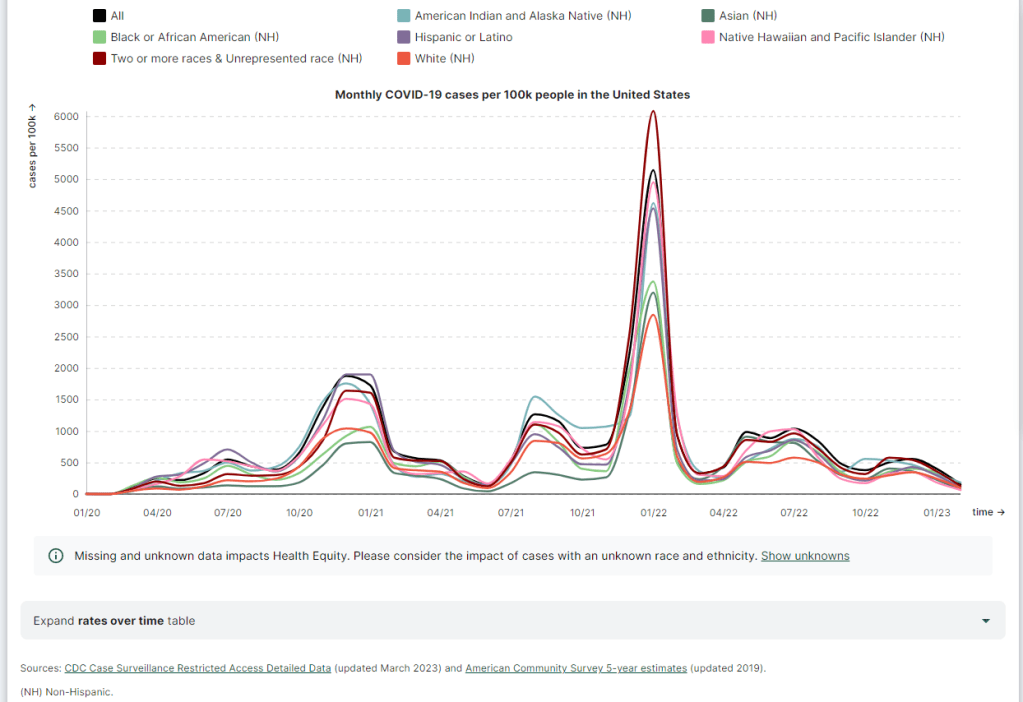
Post-PHE update: The Pulse survey is typically conducted in two-month installments, with several weeks between each installment to adjust questions and process data. Its most recent installment ended in early May, and the next one has yet to be announced; we should know within the next month whether this data source is ending with the PHE or if it will continue. - Morehouse Health Equity Tracker: This project, from the Satcher Health Leadership Institute at the Morehouse School of Medicine, tracks COVID-19 metrics and a variety of other health conditions by race and ethnicity. The COVID-19 data are based on a CDC restricted access dataset; updates will continue “for as long as the CDC gives us data,” software engineer Josh Zarrabi said on Twitter this week.
Post-PHE update: For COVID-19 data, this tracker utilizes a CDC dataset of cases with detailed demographic information, compiled from case reports sent to the CDC by state health agencies. The CDC dataset was last updated in April 2023, and it’s unclear whether it’ll be updated again (but my guess is it’ll end with the PHE). The Morehouse tracker includes plenty of other health metrics, though, so I expect this dashboard will be able to adjust to the CDC change. - APM Research Lab: This research organization, run by American Public Media, has several ongoing COVID-19 trackers. These include COVID-19 deaths by race and ethnicity (national and by state), vaccination rates (national and by state), and Minnesota-specific data, in collaboration with Minnesota Public Radio.
Post-PHE update: APM is continuing to update its tracker; the most recent update to its COVID-19 deaths by race and ethnicity page occurred on May 17. Its staff will likely need to make some changes to their underlying data sources, since the CDC is now reporting COVID-19 deaths differently, but the basic metrics remain available. - Walgreens COVID-19 Index: Walgreens shares data from COVID-19 tests conducted at over 5,000 pharmacy locations nationwide. The tracker includes test positivity (national trends and state-by-state), variant prevalence, and positivity by vaccination status.
Post-PHE update: Still active, with no change due to the PHE’s end. - COVIDcast by CMU Delphi: COVIDcast is a COVID-19 monitoring project by the Delphi Group at Carnegie Mellon University. The dashboard pulls in COVID-19 data from the CDC and other sources, such as Google search trends and antigen test positivity.
Post-PHE update: No longer includes cases and deaths (which were pulled from the CDC), but still updating other metrics, including hospital admissions, symptom searches from Google trends, and COVID-related doctor visits. - Iowa COVID-19 Tracker: Despite its name, the Iowa COVID-19 Tracker displays data from across the country, sourced from the CDC. It’s run by Sara Anne Willette, a data expert based in Ames, Iowa. Willette frequently shares data updates on social media and streams on Twitch when updating her dashboard.
Post-PHE update: Still active, but with some changes due to the new limitations in CDC data. Dashboard manager Sara Anne Willette shares frequent updates on Twitter about what she’s changing and why. - COVID-19 dashboard by Jason Salemi: This dashboard by University of South Florida epidemiologist Jason Salemi is another page displaying CDC data in somewhat-more-user-friendly visualizations. The dashboard is focused on Florida, but shares national state- and county-level data.
Post-PHE update: Salemi shared on Twitter last week that he is currently assessing whether to keep the dashboard running or decomission the site. - Biobot Analytics: Biobot Analytics is the leading wastewater surveillance company in the U.S., tracking COVID-19 at hundreds of sewershed sites through its partnership with the CDC National Wastewater Surveillance System and independent Biobot Network. The dashboard has helpful national- and regional-level charts along with county-level data for sites in Biobot’s network.
Post-PHE update: Still active, no changes due to the PHE’s end. In fact, Biobot continues to add more wastewater testing sites to its network. - WastewaterSCAN: WastewaterSCAN is another leading wastewater project, led by professors at Stanford and Emory Universities. The project started with sites in California, but has since expanded nationwide; it’s tracking several other common viruses in addition to COVID-19.
Post-PHE update: Still active, similarly to Biobot’s dashboard. - For more wastewater data: Check out the COVID-19 Data Dispatch resource page with annotations on state and local dashboards.
- KFF COVID-19 Vaccine Monitor: Since late 2020, the Kaiser Family Foundation has monitored American attitudes around COVID-19 vaccines and other pandemic issues. Updates were initially released monthly, but have become less frequent in the last year (the latest update was published on February 7, 2023).
Post-PHE update: This KFF project appears to be ongoing, but at a lower frequency of updates; the most recent update is still February 2023. A newer KFF dashboard (tracking Medicaid enrollment and unwinding) is also receiving ongoing updates. - Axios-Ipsos COVID-19 polls: Axios has partnered with the polling firm Ipsos on regular polls tracking COVID-19 views and behaviors. The polling data are available in PDF reports and in spreadsheets from Roper. In 2023, Axios and Ipsos shifted their focus from COVID-19 to broader questions about public health, with a new series of quarterly polls.
Post-PHE update: These two organizations will continue their new series of quarterly polls about public health, launched in early 2023. The most recent installment was posted this past week and includes questions about the PHE’s end, gun violence, opioids, and more.
Have I missed any major data sources? Send me an email or comment below to let me know, and I’ll highlight it in a future issue.
Editor’s note, April 2, 2023: This post has been updated with two additional dashboards (APM Research Lab and Walgreens), and additional information on the CDC’s wastewater surveillance dashboard.
Editor’s note, May 21, 2023: This post has been updated with notes about changes impacting these dashboards due to the end of the federal public health emergency (PHE).
More federal data
- CDC COVID Data Tracker: The CDC’s COVID-19 dashboard is, of course, the primary source for federal data at this point in the pandemic. It provides weekly updates for most metrics (cases, hospitalizations, deaths, vaccinations, variant estimates, etc.); wastewater surveillance data are updated daily, with individual testing sites reporting on different cadences (usually about twice per week).
-
At-home tests, wastewater: COVID-19 testing after the public health emergency ends

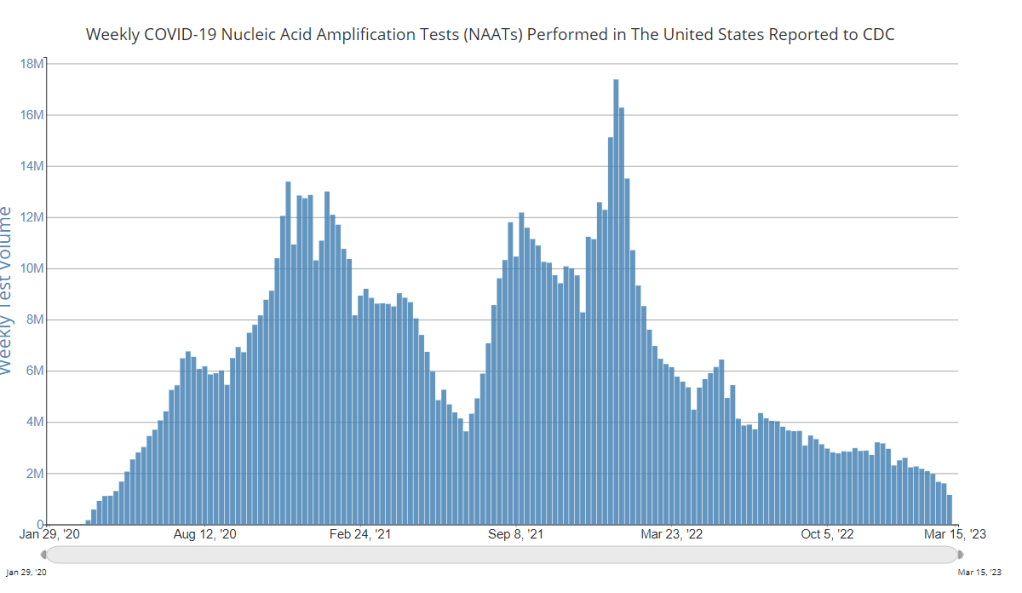
Nationwide, fewer people are getting lab-based COVID-19 tests now than at any time since the start of the pandemic. Chart via the CDC. When the public health emergency ends this spring, COVID-19 testing is going to move further in two separate directions: rapid, at-home tests at the individual level, and wastewater testing at the community level.
That was my main takeaway from an online event last Tuesday, hosted by Arizona State University and the State and Territory Alliance for Testing. This event discussed the future of COVID-19 testing following the public health emergency, with speakers including regulatory experts, health officials from state agencies, and executives from diagnostic companies.
“The purpose of testing has shifted” from earlier in the pandemic, said Dr. Thomas Tsai, the White House’s COVID-19 testing coordinator, in opening remarks at the event. Public health agencies previously used tests to monitor COVID-19 in their communities and direct contact-tracing efforts; now, individual tests are mostly used for diagnosing people, and the resulting data are widely considered to be a major undercount of true cases.
While the speakers largely agreed about the continued value of rapid, at-home tests (for diagnosing people) and wastewater surveillance (for tracking COVID-19), they saw a lot of challenges ahead for both technologies. Here are some challenges that stuck out to me.
Challenges for rapid, at-home tests:
The public health emergency’s end won’t have an immediate impact on which COVID-19 tests are available, health policy researcher Christina Silcox from Duke University explained at the event. But, in the coming months, the FDA is likely to also end its emergency use authorization for COVID-19 diagnostics. As a result, companies that currently have tests authorized under this emergency will need to apply for full approval. Relatively few rapid tests are currently approved in this way, so the change could lead to fewer choices for people buying tests.
At the same time, it will become harder for many Americans to access rapid tests. After the federal emergency ends, private insurance companies will no longer be required to cover rapid tests. Some insurance providers might still do this (especially if large employers encourage it), said Amy Kelbik from McDermott+Consulting, but it will no longer be a universal option. At the same time, Medicare will stop covering rapid tests; Medicaid coverage will continue through fall 2024.
In light of these federal changes, state health officials at the ASU event talked about a need for continued funding to support rapid test distribution from state and local agencies. “Testing will continue to inform behavior, but will become drastically less available,” said Heather Drummond, testing and vaccine program leader at the Washington State Department of Health. Washington has led a free test distribution program, but it’s slated to end with the conclusion of the federal health emergency, Drummond said; she’d like to see services like this continue for the people who most need free tests.
Drummond and other health officials also discussed the challenges of educating people about how to interpret their test results, as COVID-19 guidance becomes less widely available. The vast majority of rapid, at-home test results are not reported to public health agencies—and, based on the event’s speakers, this isn’t a problem health agencies are particularly interested in devoting resources to solving right now. But as rapid tests become the default for diagnosing COVID-19, continued outreach will be needed on how to use them.
Also, as I’ve written before, some PCR testing infrastructure should still be maintained, for cases when someone needs a more definitive test result or wants documentation in case of long-term symptoms. PCR test access will likely get even worse after the federal health emergency ends, though, as insurance plans will also stop covering (or cover fewer costs for) these tests.
Challenges for wastewater surveillance:
Overall, wastewater surveillance is the best source for community-level COVID-19 data, speakers at the ASU event agreed. Official case numbers represent significant undercounts of true infections, and hospitalizations (while more reliable) are a delayed indicator. Wastewater data are unbiased, real-time, population-level—and the technology can be expanded to other common viruses and health threats, health officials pointed out at the event.
But wastewater surveillance is still very uneven across the U.S. It’s clear just from looking at the CDC’s map that some states have devoted resources to detailed wastewater testing infrastructure, with a testing site in every county—while others just have a handful of sites. Funding uncertainty likely plays a role here; speakers at the event expressed some confusion about the availability of CDC funds for long-term wastewater programs.
The CDC’s wastewater surveillance system has also faced challenges with standardizing data from different testing programs. And, at state and local agencies, health officials are still figuring out how to act on wastewater data. Agencies with more robust surveillance programs (such as Massachusetts, which had two officials speak at the ASU summit) may be able to provide success stories for other agencies that aren’t as far along.
Broader testing challenges:
For diagnostic company leaders who spoke at the event, one major topic was regulatory challenges. Andrew Kobylinski, CEO and co-founder of Primary.Health, said that the FDA’s test requirements prioritize highly accurate tests, even though less sensitive (but easier to use) tests might be more useful in a public health context.
Future COVID-19 tests—and tests for other common diseases—may need a new paradigm of regulatory requirements that focus more on public health use. At the same time, health agencies and diagnostic companies could do more to collect data on how well different test options are actually working. While it’s hard to track at-home tests on a large scale, more targeted studies could help show which tests work best in specific scenarios (such as testing after an exposure to COVID-19, or testing to leave isolation).
Company representatives also talked about financial challenges for developing new tests, particularly as interest in COVID-19 dies down and as recession worries grow this year. While a lot of biotech companies dove into COVID-19 over the last three years, they haven’t always received significant returns on their investments. For example, Lucira, the company behind the first flu-and-COVID-19 at-home test to receive authorization, recently filed for bankruptcy and blamed the long FDA authorization process.
Mara Aspinall, the ASU event’s moderator and a diagnostic expert herself, ended the event by asking speakers whether COVID-19 has led to lasting changes in this industry. The answer was a resounding, “yes!” But bringing lessons from COVID-19 to other diseases and health threats will require a lot of changes—to regulatory processes, funding sources, data collection practices, and more.
More testing data
