If the U.S. does see a fourth surge this spring, one of the main culprits will be variants. Three months after the first B.1.1.7-caused case was detected in this country, that variant now causes about one third of new COVID-19 cases nationwide. The B.1.1.7 variant, first detected in the U.K., spreads more readily and may pose a higher risk of hospitalization and death.
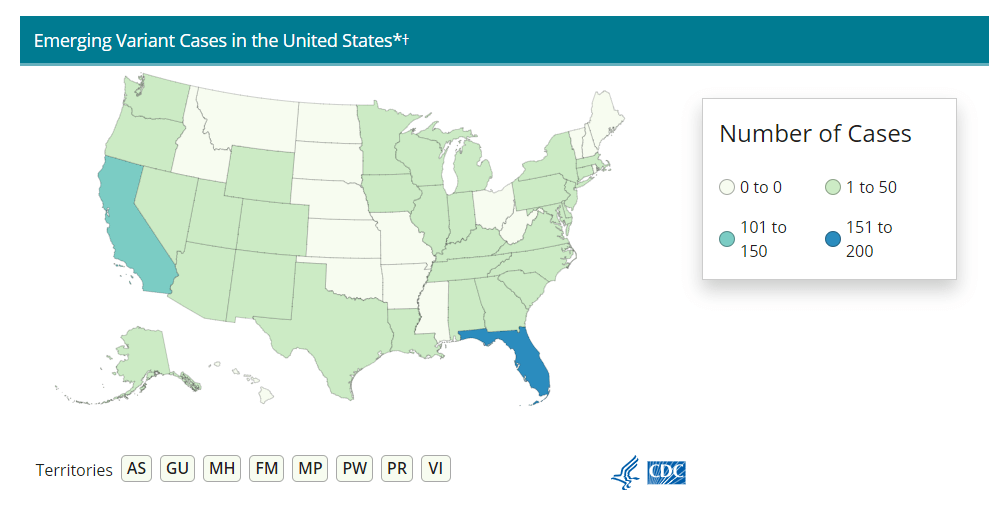
Meanwhile, other variants have taken root. There’s the variant that originated in California, B.1.427/B.1.429, which now accounts for over half of cases in the state. There’s the variant that originated in New York City, B.1.526, which is quickly spreading in New York and likely in neighboring states. And there’s the variant that originated in Brazil, P.1; this variant has only been identified about 200 times in the U.S. so far, but it’s wreaking havoc in Brazil and some worry that it may be only a matter of time before we see it spread here.
The thing about viral variants—especially those more-transmissible variants—is, they’re like tribbles. They might seem innocuous at first, but if left to multiply, they’ll soon take over your starship, eat all your food, and bury you in the hallway. (If you didn’t get that reference, watch this clip and then get back to me.) The only way to stop the spread is to first, identify where they are, and then use the same tried-and-true COVID-19 prevention measures to cut off their lineages. Or, as Dr. McCoy puts it: “We quit feeding them, they stop breeding.”
In the U.S., that first part—identify where the variants are—is tripping us up. The CDC has stepped up its sequencing efforts in a big way over the past few months, going from 3,000 a week in early January to 10,000 a week by the end of March. But data on the results of these efforts are scarce and uneven, with some states doing far more sequencing than others. New York City, for example, has numerous labs frantically “hunting down variants,” while many less-resourced states have sequenced less than half a percent of their cases. And the CDC itself publishes data with gaping holes and lags that make the numbers difficult to interpret.
The CDC has three places you can find data on variants and genomic sequencing; each one poses its own challenges.
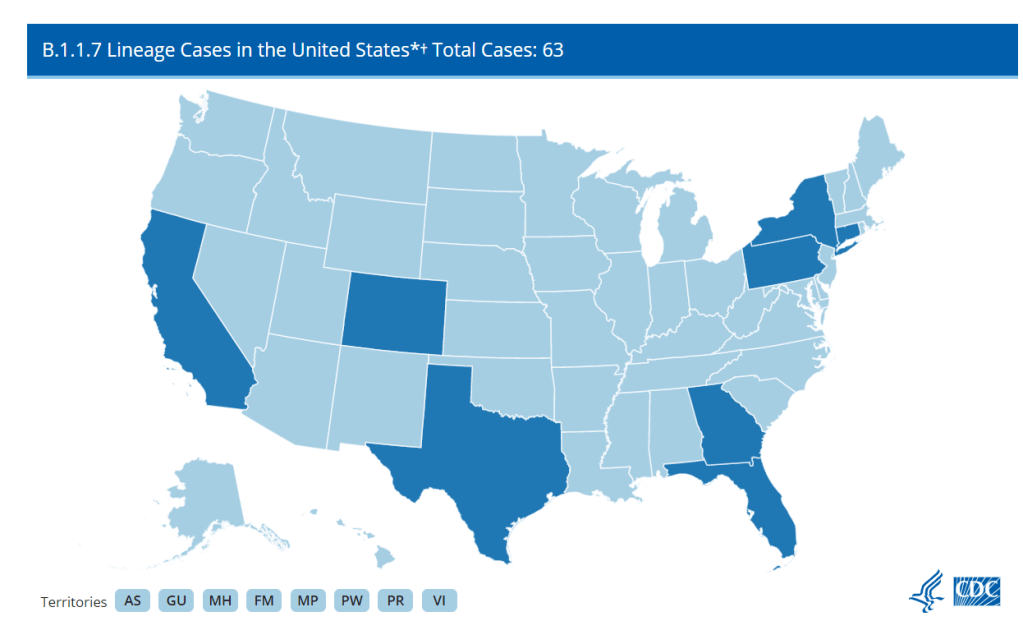
First, there’s the original variant data tracker, “US COVID-19 Cases Caused by Variants.” This page reports sheer numbers of cases caused by three variants of concern: B.1.1.7 (U.K. variant), B.1.351 (South Africa variant), and P.1 (Brazil variant). It’s updated three times a week, on Tuesdays, Thursdays, and Sundays—the most frequent schedule of any CDC variant data.
But the sheer numbers of cases reported lack context. What does it mean to say, for example, the U.S. has about 12,500 B.1.1.7 cases, and 1,200 of them are in Michigan? It’s tricky to explain the significance of these numbers when we don’t know much sequencing Michigan is doing compared to other states.
This dataset is also missing some pretty concerning variants: both the B.1.526 (New York) and B.1.427/B.1.429 (California) variants are absent from the map and state-by-state table. According to other sources, these variants are spreading pretty rapidly in their respective parts of the country, so there should be case numbers reported to the CDC—it’s unclear why the CDC hasn’t yet made those numbers public.
(To the CDC’s credit, the California variant was recently reclassified as a “variant of concern,” and Dr. Walensky said at a press briefing this week that the New York variant is under serious investigation to get that same reclassification bump. But that seems to be a long process, as it hasn’t happened weeks after the variant emerged.)
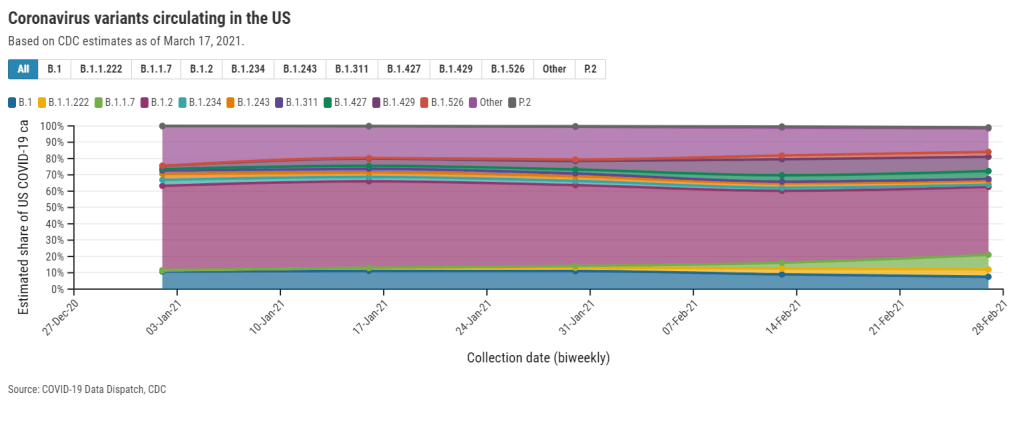
Second, there’s the variant proportions tracker, which reports what it sounds like: percentages, representing the share of COVID-19 cases that CDC researchers estimate are caused by different coronavirus variants. The page includes both national estimates and state-by-state estimates for a pretty limited number of states that have submitted enough sequences to pass the CDC’s threshold.
I wrote about this page when it was posted two weeks ago, calling out the stale nature of these data and the lack of geographic diversity. There’s been one update since then, but only to the national variant proportions estimates; those numbers are now as of March 13 instead of February 27. The state numbers are still as of February 27, now over a month old.
Note that Michigan—the one state everyone’s watching, the state that has reported over 1,000 B.1.1.7 cases alone—is not included in the table. How are we supposed to use these estimates when they so clearly do not reflect the current state of the pandemic?
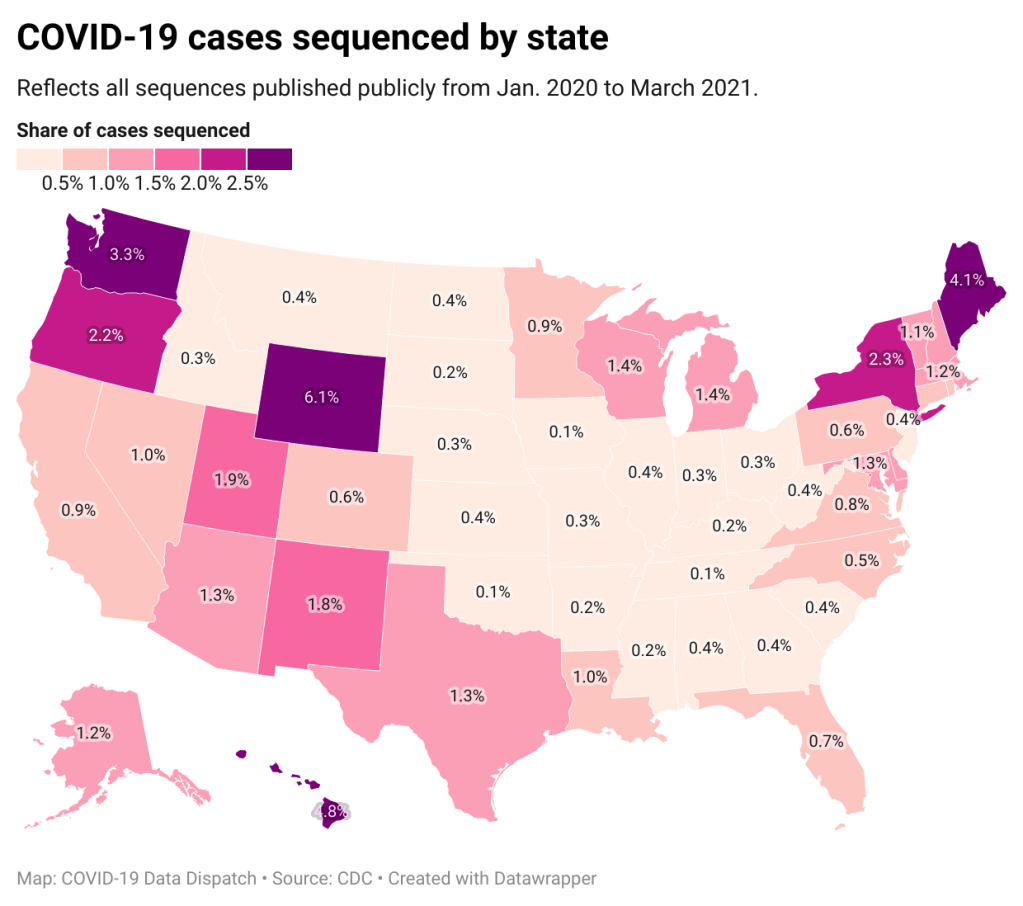
!function(){“use strict”;window.addEventListener(“message”,(function(a){if(void 0!==a.data[“datawrapper-height”])for(var e in a.data[“datawrapper-height”]){var t=document.getElementById(“datawrapper-chart-“+e)||document.querySelector(“iframe[src*=’”+e+”‘]”);t&&(t.style.height=a.data[“datawrapper-height”][e]+”px”)}}))}();A third variant-adjacent data page, added to the overall CDC COVID Data Tracker this past week, provides a bit more context. This page provides data on published SARS-CoV-2 sequences provided by the CDC, state and local public health departments, and other laboratory partners. You can see the sheer number of sequenced cases grow by week and compare state efforts.
It’s pretty clear that some states are doing more sequencing than others. States with major scientific capacity—Washington, Oregon, New York, D.C.—are near the top. Some states with smaller populations are also on top of the sequencing game: Wyoming, Hawaii, Maine. But 32 states have sequenced fewer than 1% of their cases in total, and 21 have sequenced fewer than 0.5%. That’s definitely not enough sequences for the states to be able to find pockets of new variants, isolate those transmission chains, and stop the breeding.
!function(){“use strict”;window.addEventListener(“message”,(function(a){if(void 0!==a.data[“datawrapper-height”])for(var e in a.data[“datawrapper-height”]){var t=document.getElementById(“datawrapper-chart-“+e)||document.querySelector(“iframe[src*=’”+e+”‘]”);t&&(t.style.height=a.data[“datawrapper-height”][e]+”px”)}}))}();Chart captions state that the state-by-state maps represent cases sequenced “from January 2020 to the present,” while a note at the bottom says, “Numbers will be updated every Sunday by 7 PM.” So are the charts up to date as of today, April 4, or are they up to date as of last Sunday, March 28? (Note, I put simply “March 2021” on my own chart with these data.)
Obviously, the lack of date clarity is annoying. But it’s also problematic that these are cumulative numbers—reflecting all the cases sequenced during more than a year of the pandemic. Imagine trying to make analytical conclusions about COVID-19 spread based on cumulative case numbers! It would simply be irresponsible. But for sequencing, these data are all we have.
So, if anyone from the CDC is reading this, here’s my wishlist for variant data:
- One singular page, with all the relevant data. You have a COVID Data Tracker, why not simply make a “Variants” section and embed everything there?
- Regular updates, coordinated between the different metrics. One month is way too much of a lag for state-by-state prevalence estimates.
- Weekly numbers for states. Let us see how variants are spreading state-by-state, as well as how states are ramping up their sequencing efforts.
- More clear, consistent labeling. Explain that the sheer case numbers are undercounts, explain where the prevalence estimates come from, and generally make these pages more readable for users who aren’t computational biologists.
And if you’d like to see more variant case numbers, here are a couple of other sources I like:
- Coronavirus Variant Tracker by Axios, providing estimated prevalence for four variants of concern and two variants of interest, along with a varants FAQ and other contextual writing.
- CoVariants, a tracker by virologist Emma Hodcroft that shows variant spread around the world based on public sequencing data. Hodcroft posts regular updates on Twitter.
- Nextstrain, an open-source genome data project. This repository was tracking pathogens long before COVID-19 hit, and it is a hub for sequence data and other related resources.
The U.S. has blown past its current sequencing goal (7,000 cases per week), but is aiming to ramp up to 25,000—and has invested accordingly. I hope that, in addition to ramping up all the technology and internal communications needed for this effort, the CDC also improves its public data. The virus is multiplying; there’s no time to waste.