- New Surgeon General advisory on health worker burnout: This week, U.S. Surgeon General Dr. Vivek Murthy released a new advisory on COVID-19 burnout among health workers, summarizing research on the issue and highlighting it as a public health priority. The advisory discusses a variety of societal, cultural, structural, and organizational factors contributing to health worker burnout, while tying this burnout to growing shortages of doctors and other health professionals. From the one-page summary of the advisory: “If not addressed, the health worker burnout crisis will make it harder for patients to get care when they need it, cause health costs to rise, hinder our ability to prepare for the next public health emergency, and worsen health disparities.”
- CDC may change COVID-19 reporting for hospitals: The CDC is planning a few changes to its reporting requirements for hospitals in order to simplify the reporting process and cut down on redundant information, according to a draft plan shared with Bloomberg. Among the changes: hospitals may no longer be required to report suspected COVID-19 cases (i.e. those cases not yet confirmed with a PCR test); with most hospitals testing all patients when they’re admitted, suspected cases are less common and the data are less useful than they had been at earlier points in the pandemic. The CDC may also stop requiring COVID-19 reporting from some types of facilities, such as mental health centers, and may change the frequency of required reporting.
- New preprint about Omicron BA.4 and BA.5: While the U.S. mostly worries about BA.2.12.1, additional Omicron subvariants BA.4 and BA.5 have been spreading in South Africa and other countries. A new study from a highly-regarded consortium of Japanese researchers suggests that BA.4 and BA.5 are about 20% more transmissible than BA.2 (similarly to BA.2.12.1). Also, even more concerning: the researchers found that BA.4 and BA.5 are more capable of resisting protection from a prior Omicron infection than BA.1. While the study has not yet been peer-reviewed, it garnered a lot of attention on Twitter this week from scientists warning that we need to watch out for these subvariants.
- U.S. gets closer to a vaccine for kids under five: The FDA has set new dates for its vaccine advisory committee to review data on COVID-19 vaccines for children under age five: the committee will discuss both Moderna’s and Pfizer’s under-five vaccines on June 15, after discussing Moderna’s vaccine for children ages six to 17 on June 14. This announcement came after Pfizer and BioNTech released new data on their under-five vaccine, saying that a series of three doses provided strong protection against severe disease. There are some caveats for the data (which were shared via press release), but this is great news for children under age five and their families.
- NIH sharing some COVID-19 technology (but not patents): I missed this news from earlier in May: the National Institutes of Health has made a deal with the World Health Organization’s COVID-19 Technology Access Pool and the Medicines Patent Pool to lisense 11 technologies used in COVID-19 vaccines and therapeutics. This lisense will allow pharmaceutical manufacturers around the world to make the coronavirus spike protein, RNA virus tests, and other COVID-19 components, increasing access to these technologies in low- and middle-income countries. Of course, it would be better for these countries if the NIH had shared full vaccine patents, but apparently that’s asking too much.
Category: Uncategorized
-
Sources and updates, May 29
-
National numbers, May 29

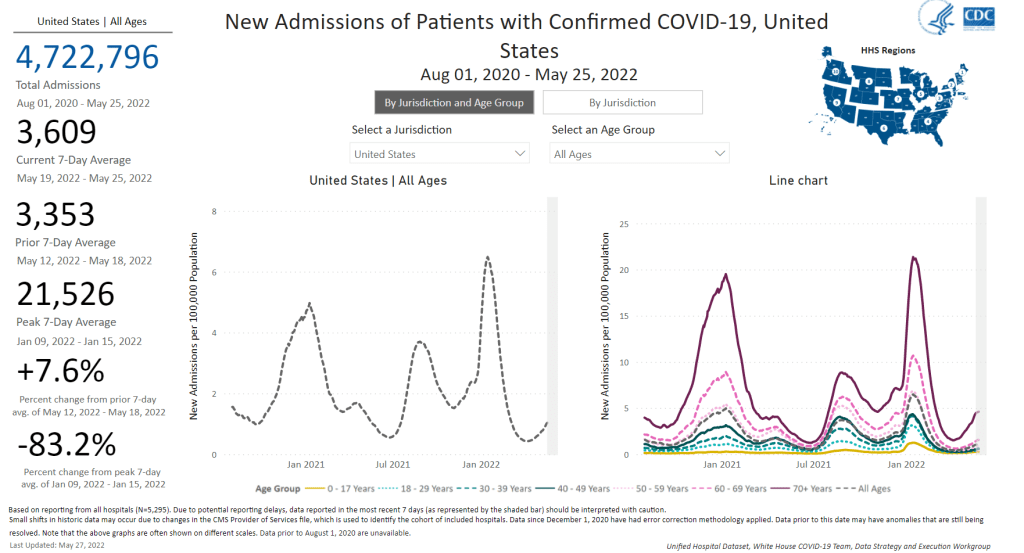
It’s not all mild cases: new COVID-19 hospital admissions have been rising at a similar rate to cases in the last couple of weeks. Chart via the CDC. In the past week (May 21 through 27), the U.S. reported about 770,000 new COVID-19 cases, according to the CDC. This amounts to:
- An average of 110,000 new cases each day
- 234 total new cases for every 100,000 Americans
- 8% more new cases than last week (May 14-20)
In the past week, the U.S. also reported about 25,000 new COVID-19 patients admitted to hospitals. This amounts to:
- An average of 3,600 new admissions each day
- 7.7 total admissions for every 100,000 Americans
- 8% more new admissions than last week
Additionally, the U.S. reported:
- 2,200 new COVID-19 deaths (0.7 for every 100,000 people)
- 97% of new cases are Omicron BA.2-caused; 58% BA.2.12.1-caused (as of May 21)
- An average of 70,000 vaccinations per day (per Bloomberg)
America’s largely-ignored BA.2 surge continues: the U.S. reported over 100,000 new cases a day last week, while an average of 3,600 new COVID-19 patients were admitted to hospitals each day. Both of these metrics rose about 8% from the week prior.
Of course, as I am frequently reminding everyone these days, current case numbers are a drastic undercount of actual infections, thanks to at-home testing and increasingly-fractured PCR access. Our current surge might actually be the country’s “second-largest wave of COVID-19 infections since the pandemic began,” Wall Street Journal reporter Josh Zumbrun wrote last week.
The culprits for this wave of infections are BA.2 and its sublineage BA.2.12.1; the latter is now causing more than half of new cases in the U.S., according to CDC estimates. Northeast states, which have been BA.2.12.1 hotspots for a few weeks now, continue to report the highest case rates: these include Rhode Island, Delaware, New Jersey, Massachusetts, D.C., and New York.
There are some promising signs that the BA.2 wave in these Northeast states may soon be on a downturn, if it isn’t already. Data from Biobot show that coronavirus levels in wastewater are dropping in this region, with reports from Boston and from Maine contributing to this pattern. New York City, where I live, has reported a case plateau for the last week or so, but I’m hopeful that it could turn into a downturn soon.
But will this encouraging pattern in the Northeast withstand the holiday weekend of largely-unmasked travel and gatherings? It may be a couple of weeks before we know for sure, because the holiday will interrupt data reporting (as holidays always do). The CDC itself is taking a long weekend off, with no Weekly Review this past Friday and no data updates at all Saturday, Sunday, and Monday.
Meanwhile, COVID-19 deaths—the most lagging pandemic metric—are going up once again. More than 300 Americans died of the disease each day last week, in a 13% increase from the week prior. These are the consequences of our country’s continued failure to protect the vulnerable.
-
Sources and updates, May 22
- HHS begins releasing Paxlovid data: This past week, the Department of Health and Human Services (HHS) published data on how many courses of Paxlovid and other major COVID-19 therapeutics have been ordered and administered nationwide. As KHN reporter Hannah Recht pointed out on Twitter: “This is still not the detailed, complete data that county health officials need to do their jobs but it’s a start.” (See Recht’s article on this data gap for more context.)
- COVID-19 Local Action Tracker: Since early 2020, the National League of Cities has tracked how cities and other local municipalities have responded to COVID-19. The tracker includes 800 cities and almost 5,000 policies, impacting over 100 million people; it links out to policy documents for each item. (H/t Data Is Plural.)
- FEMA funeral assistance: The Federal Emergency Management Agency (FEMA) has distributed over $2 billion in aid for COVID-19 funerals since the beginning of the pandemic, supporting more than 300,000 families, the agency announced in a press release this spring. The press release also includes data providing the number of applicants and total funds awarded in each state.
- New Long COVID studies with electronic records: Two recent papers on Long COVID caught my attention this week. First, researchers at data nonprofit FAIR Health analyzed a cohort of 78,000 Long COVID patients using a new diagnostic code for the condition, leading to useful findings about potential demographics and risk factors. Second, researchers at the University of North Carolina, the University of Colorado, and other collaborators used machine learning techniques on health records to identify potential Long COVID patients. Both studies used electronic health records to include wider patient pools than typical U.S. Long COVID research.
- Limited immunity after Omicron infection: Another notable paper, published this week in Nature: researchers at Gladstone Institutes, a research organization in San Francisco, examined immunity after Omicron infections by testing out potential immune responses to different variants in mice and analyzing human serological samples. Their results suggest people infected with Omicron after vaccination have more protection against variants other than Omicron compared to unvaccinated people, which may only be protected against future Omicron infections.
- FDA authorizes combined at-home test for COVID-19, flu, RSV: And a piece of diagnostic news for this week: for the first time, the FDA has provided emergency use authorization to an at-home test that can distinguish between COVID-19, the flu, and RSV. Processing the test does involve mailing results of a nasal swab to the testing company, Labcorp, so it’s not as simple as the at-home COVID-only tests we’ve all grown used to. Still, this authorization is an important step for future testing.
-
National numbers, May 22

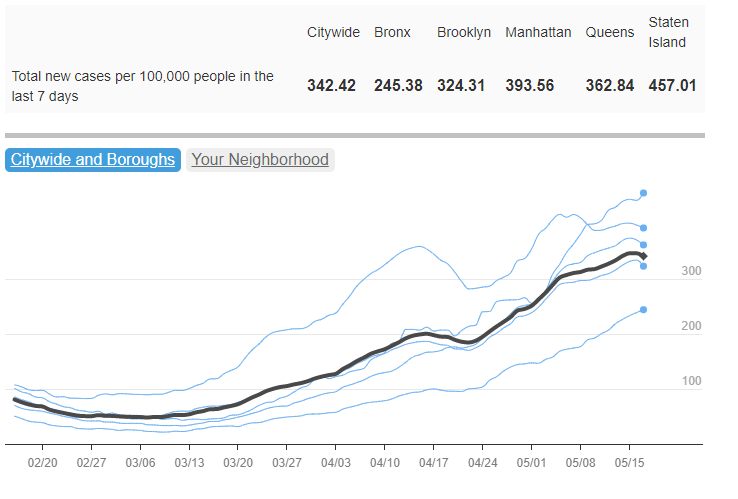
After appearing to peak in mid-April, COVID-19 case rates in New York City began going up again as BA.2.12.1 took over. Chart from NYC Health. In the past week (May 14 through 20), the U.S. reported about 710,000 new COVID-19 cases, according to the CDC. This amounts to:
- An average of 101,000 new cases each day
- 216 total new cases for every 100,000 Americans
- 19% more new cases than last week (May 7-13)
In the past week, the U.S. also reported about 23,000 new COVID-19 patients admitted to hospitals. This amounts to:
- An average of 3,300 new admissions each day
- 6.9 total admissions for every 100,000 Americans
- 24% more new admissions than last week
Additionally, the U.S. reported:
- 2,000 new COVID-19 deaths (0.6 for every 100,000 people)
- 98% of new cases are Omicron BA.2-caused; 48% BA.2.12.1-caused (as of May 14)
- An average of 140,000 vaccinations per day (per Bloomberg)
The Omicron BA.2 surge continues in the U.S., with a 19% increase in officially-reported COVID-19 cases in the past week to over 100,000 new cases a day. Of course, the official case numbers severely underestimate true infections, as PCR testing sites close and more people use rapid tests; actual case counts may be five or more times higher.
New hospital admissions are also increasing: about 23,000 COVID-19 patients were admitted for care nationwide last week, up from 11,000 one month ago. While millions of Americans have some protection against severe disease from vaccination and/or prior Omicron infections, many are still susceptible. Hospitals are beginning to fill up again in almost every state, and as Ed Yong points out, the numbers don’t capture continued burnout among healthcare workers.
BA.2.12.1, the most transmissible version of Omicron BA.2 now spreading in the U.S., accounted for almost half of new cases in the week ending May 14, according to CDC estimates. Northeast states remain hotspots: BA.2.12.1 caused about three in four new cases in New York and New Jersey last week.
One thing I’ve been wondering, in recent weeks, is when we might see cases peak in the Northeast. In New York City, where I live, case trends seemed to turn downward in mid-April; but then after about a week, the numbers went up again — perhaps a consequence of BA.2.12.1 taking over from BA.2.
COVID-19 trends from wastewater surveillance for the Northeast look similar to the case trends in NYC: a slow increase through March and April, followed by a potential plateau or further increases in May.
And other regions are catching up, according to Biobot’s tracker: states in the Midwest and South continue to see their coronavirus levels increase as the Northeast stagnates. Official case data from the latest Community Profile Report suggest that states such as Nebraska, Montana, Missouri, Kansas, and Kentucky reported the sharpest increases over the last week.
One piece of good news: new COVID-19 vaccinations rose slightly over the last week, going above 100,000 new shots administered daily for the first time in several months. Second booster shots in older adults and those with severe medical conditions are likely driving this increase, though, rather than shots for the previously unvaccinated.
As local leaders like NYC mayor Eric Adams refuse to institute new mask mandates and the country overall seems apathetic to this COVID-19 surge, it’s unclear how long we’ll be dealing with these Omciron subvariants — or how much we’ll invite the virus to keep mutating.
-
Sources and updates, May 15
- COVID-19 deaths that could’ve been prevented with vaccines: A new analysis from the Brown University School of Public Health suggests that almost 319,000 U.S. COVID-19 deaths could have been avoided if all adults had gotten vaccinated against the disease. This number differs significantly by state; there were 29,000 preventable COVID-19 deaths in Florida, compared to under 300 in Vermont. For more context on the analysis, see this article in NPR.
- CDC dashboard in Spanish: The CDC has translated its COVID-19 Data Tracker into Español. At a glance, the Spanish version appears to include all the major aspects of the tracker: cases, deaths, vaccinations, community transmission, variant prevalence, wastewater, etc. Of course, it would have been great if the agency could’ve devoted resources to this translation effort well below spring 2022, when the number of people looking to the agency for COVID-19 guidance is pretty low.
- CDC may lose access to COVID-19 data: According to reporting from POLITICO, the CDC and other national health agencies may no longer have the authority to require COVID-19 data reporting from states and individual health institutions if the Biden administration allows the country’s federal pandemic health emergency to end this summer. Such a change in authority could lead to the CDC (and numerous other researchers across the country) losing standardized datasets for COVID-19 hospitalizations, transmission in nursing homes, PCR testing, and other key metrics. Considering that hospitalizations are considered the most reliable metric right now, this could be a major blow.
- COVID-19 testing declines globally: Speaking of losing reliable data: this report from the Associated Press caught my eye. The story, by Laura Ungar, explains that the U.S. is not the only country to see a major decrease in reported COVID-19 tests (a.k.a. Lab-based PCR, not at-home rapid tests) in recent months. “Experts say testing has dropped by 70 to 90% worldwide from the first to the second quarter of this year,” Ungar writes, “the opposite of what they say should be happening with new omicron variants on the rise in places such as the United States and South Africa.”
- More promising data on Moderna kids’ vaccine: While Pfizer’s vaccine for children under five remains in development, Moderna continues to release data suggesting that this company is further ahead in providing protection for the youngest age group. This week, Moderna announced a half-dose of its vaccine provides a “strong immune response” in children ages six to 11; the announcement was backed up by a scientific study published in the New England Journal of Medicine (so, more rigorous than your typical press release). The FDA is currently evaluating a version of Moderna’s vaccine for children between ages six months and six years.
-
National numbers, May 15

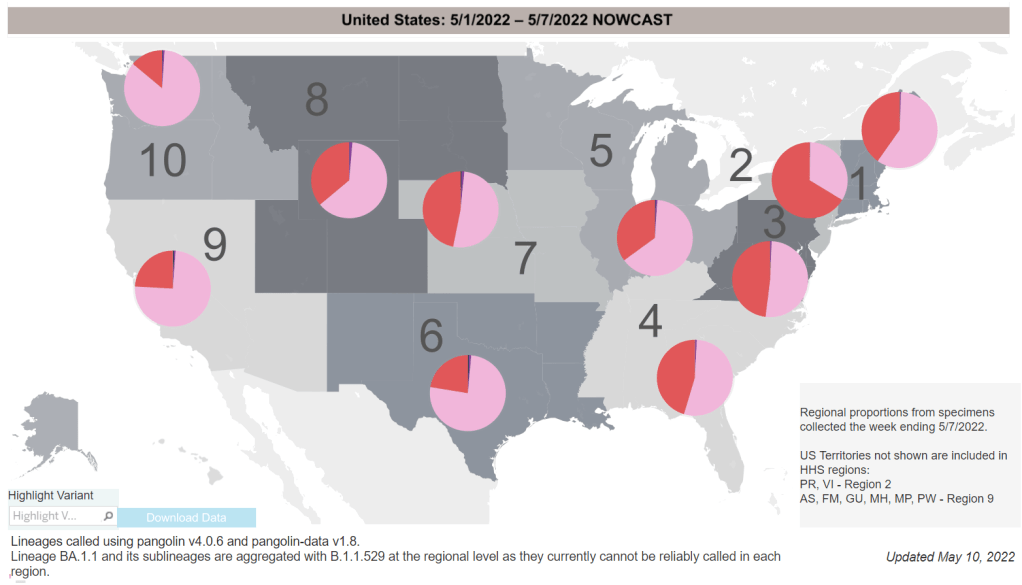
Omicron BA.2.12.1 (shown here in red) is taking over from BA.2 (pink) in much of the country, with the Northeast in the lead. Chart via the CDC, data as of May 7. In the past week (May 7 through 13), the U.S. reported about 590,000 new COVID-19 cases, according to the CDC. This amounts to:
- An average of 85,000 new cases each day
- 181 total new cases for every 100,000 Americans
- 31% more new cases than last week (April 30-May 6)
In the past week, the U.S. also reported about 18,000 new COVID-19 patients admitted to hospitals. This amounts to:
- An average of 2,600 new admissions each day
- 5.6 total admissions for every 100,000 Americans
- 18% more new admissions than last week
Additionally, the U.S. reported:
- 1,900 new COVID-19 deaths (0.6 for every 100,000 people)
- 99% of new cases are Omicron BA.2-caused; 43% BA.2.12.1-caused (as of May 7)
- An average of 80,000 vaccinations per day (per Bloomberg)
New COVID-19 cases continue to rise in the U.S., with an average of 85,000 cases reported nationally each day last week—double the daily average from three weeks ago. This is a significant undercount, of course, as the majority of COVID-19 tests conducted these days are done at home.
The country is also reporting more COVID-19 patients admitted to hospitals: about 18,400 people were admitted last week, an 18% increase from the prior week. While this is far lower than the numbers reported during the peak of the Omicron wave (and includes some incidental hospitalizations), it’s still a concerning signal: even as immunity from prior vaccinations and infections protects many Americans from severe disease, plenty of people remain vulnerable.
This current increase is largely driven by the Omicron subvariant BA.2 and its offshoot BA.2.12.1, which is the most transmissible version of this lineage yet. BA.2.12.1 caused about 43% of new cases nationwide in the week ending May 7, according to CDC estimates; in parts of the Northeast, Midwest, and South, that ratio is over 50%.
The Northeast, which has the most BA.2.12.1, also continues to report the highest coronavirus levels in wastewater regionally, according to Biobot. After a potential plateau in recent weeks, the Northeast is now continuing to show a clear uptick; wastewater data from other parts of the country also indicate a slow increase in coronavirus transmission.
The CDC’s wastewater data somewhat reaffirm these trends, but are currently difficult to interpret as a number of sites have gone offline recently. (More on that later in the issue.)
States with the highest COVID-19 case rates continue to include Northeast states: Rhode Island, Massachusetts, New York, Maine, Vermont, New Jersey, and Washington, D.C. But some Midwest states (Illinois, Michigan, Wisconsin) as well as Hawaii are also reporting over 250 new cases per 100,000 people in the last week, showing how this BA.2 surge is spreading to other regions.
If you look at the CDC’s Community Level guidance, you may think that, even if you live in one of these surging Northeast states, you can go out in public without a mask. But other metrics, such as the agency’s old Community Transmission levels (which are based more on cases than hospitalizations), suggest otherwise.
In short: if you want to protect yourself and others in your community, especially if you live in the Northeast, now is a good time to mask up, test often, and avoid large indoor gatherings.
-
National numbers, May 8

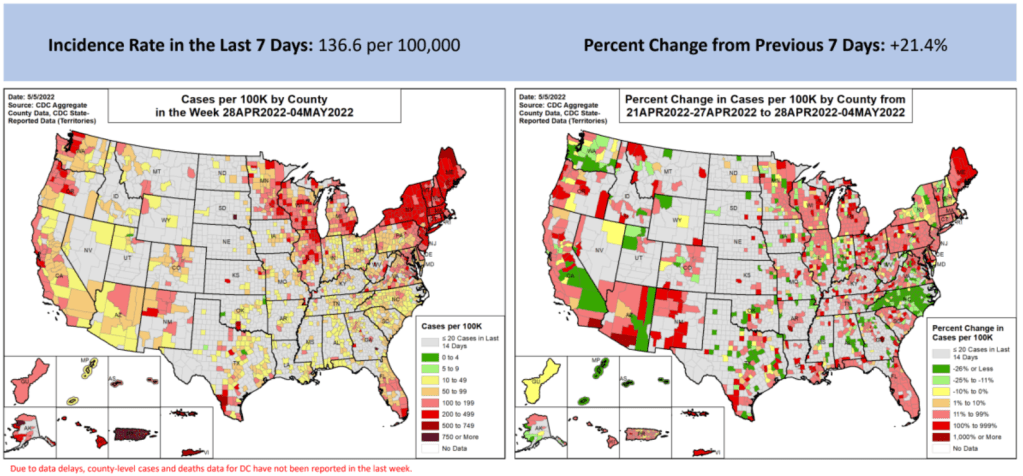
These maps from the May 5 Community Profile Report look pretty different from the CDC’s all-green “Community Levels” map, huh? In the past week (April 30 through May 6), the U.S. reported about 450,000 new COVID-19 cases, according to the CDC. This amounts to:
- An average of 65,000 new cases each day
- 138 total new cases for every 100,000 Americans
- 21% more new cases than last week (April 23-29)
In the past week, the U.S. also reported about 16,000 new COVID-19 patients admitted to hospitals. This amounts to:
- An average of 2,200 new admissions each day
- 4.7 total admissions for every 100,000 Americans
- 17% more new admissions than last week
Additionally, the U.S. reported:
- 2,300 new COVID-19 deaths (0.7 for every 100,000 people)
- 98% of new cases are Omicron BA.2-caused; 37% BA.2.12.1-caused (as of April 30)
- An average of 70,000 vaccinations per day (per Bloomberg)
New COVID-19 cases are still rising in the U.S., as the country continues to face the Omicron subvariant BA.2 and its offshoots. While at levels much lower than what we saw in December and January, daily new cases have more than doubled in the last month.
And, as I frequently note these days, case numbers are capturing a small fraction of actual COVID-19 infections, as PCR testing becomes less available and at-home rapid tests become more popular. Hospital admissions, a more reliable metric, have also shot up in recent weeks, with about 50% more COVID-19 patients admitted to U.S. hospitals last week than in the first week of April.
Wastewater data suggest that COVID-19 transmission nationwide may be increasing slightly or in a plateau, far from the kind of exponential increase we saw during the first Omicron surge. Biobot’s dashboard shows that coronavirus levels in wastewater in the Northeast, South, and Midwest continue to increase slightly, while in the West, virus levels have shifted back down in the most recent week of data.
The CDC’s wastewater dashboard similarly suggests that fewer parts of the country are seeing major coronavirus upticks than the national system reported a couple of weeks ago. But this dashboard is a bit incomplete at the moment, with hundreds of sites reporting no recent data, so I take that finding with a grain of salt.
Northeast states continue to report the highest case rates, according to the May 5 Community Profile Report. Maine, Rhode Island, Vermont, Massachusetts, Hawaii, New York, New Jersey, Illinois, New Hampshire, and Connecticut all reported more than 200 new cases for every 100,000 residents in the last week, passing the CDC threshold for a medium “Community Level” (or, under the agency’s old guidance, more than double the threshold for high transmission).
The BA.2 subvariant is now causing almost 100% of new COVID-19 cases in the country, according to CDC estimates, with the even-more-contagious BA.2.12.1 sub-subvariant causing about one in three of those cases. In the coming weeks, we’ll see how well protection from vaccines and recent Omicron BA.1 infections holds up against these more-transmissible versions of the virus.
-
Sources and updates, May 1
- Nursing Home Inspect (ProPublica): ProPublica recently published a major investigation into medical exemptions to COVID-19 vaccines among nursing home workers, finding that high numbers of workers are claiming these exemptions even though the actual, medical reasons causing someone to be ineligible for vaccination are fairly limiting. Along with the investigation, the newsroom added staff COVID-19 vaccination data to its Nursing Home Inspect database, which allows users to compare nursing homes based on negative inspection reports and other deficiencies.
- Neighborhood Atlas: One source I learned about at the health journalists’ conference this weekend is the Neighborhood Atlas tool from researchers at the University of Wisconsin School of Medicine and Public Health. The atlas maps out metrics that put neighborhoods—i.e. Census block groups, a geographical level much more granular than counties—at a health disadvantage, including income, education, employment, and housing.
- Access to hospital services for minority groups: Another source from the AHCJ conference: this February 2022 paper and corresponding dataset, measuring how far different minority communities across the country have to go to access hospital services. Over half of rural Native American communities are more than 30 miles from the closest intensive care unit, said Dr. Mary-Katherine McNatt in a talk introducing this source.
- KFF’s State Health Facts: Also at the conference, Juliette Cubanski from the Kaiser Family Foundation (KFF) gave a presentation on the organization’s data tools and resources for journalists, focusing on Medicare data. One broadly useful KFF tool is the State Health Facts dashboard, which enables journalists and researchers to search through over 800 health indicators at the state level. These indicators are frequently updated with the most recent data.
- Nursing home staffing reports: COVID-19 revealed how unprepared America’s nursing homes were for a health crisis. In a panel discussing this issue, Richard Mollot from the Long Term Care Community Coalition (a nonprofit that advocates for better long-term care) shared some data from his organization, highlighting drops in staffing during the pandemic that have not yet been recovered.
-
National numbers, May 1

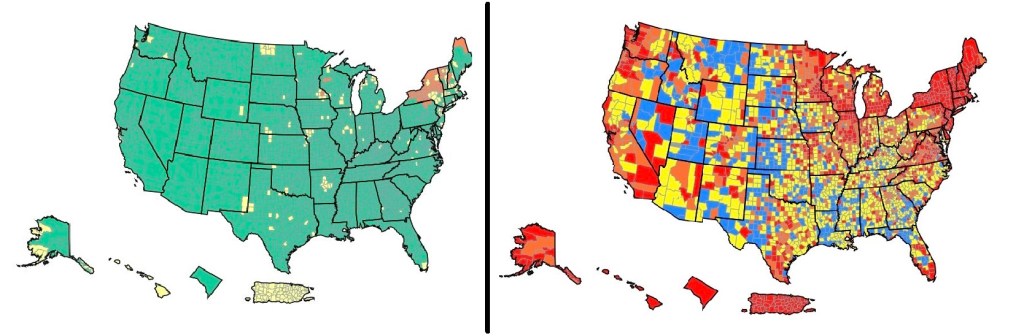
On the left, the CDC’s current Community Levels indicate that 90% of the U.S. is in a “low risk” region. On the right, the CDC’s old Transmission Levels indicate that only 15% of the country is in a “low risk” region. In the past week (April 23 through 29), the U.S. reported about 370,000 new COVID-19 cases, according to the CDC. This amounts to:
- An average of 53,000 new cases each day
- 113 total new cases for every 100,000 Americans
- 25% more new cases than last week (April 16-22)
In the past week, the U.S. also reported about 13,000 new COVID-19 patients admitted to hospitals. This amounts to:
- An average of 1,900 new admissions each day
- 4.0 total admissions for every 100,000 Americans
- 19% more new admissions than last week
Additionally, the U.S. reported:
- 2,300 new COVID-19 deaths (0.7 for every 100,000 people)
- 97% of new cases are Omicron BA.2-caused; 29% BA.2.12.1-caused (as of April 23)
- An average of 80,000 vaccinations per day (per Bloomberg)
Nationwide, new COVID-19 cases have increased in the U.S. for the fourth week in a row. The daily case average has doubled since early April, and that’s just the cases that we’re reporting; with less PCR testing availability and more people using at-home tests, we have very limited visibility into this current uptick.
New hospital admissions, a more reliable metric than cases, have also continued to rise this week. U.S. hospitals reported about 13,200 COVID-19 patients admitted this week, up from under 10,000 in the first week of April.
Wastewater data similarly continue to indicate increased coronavirus spread. The Northeast is still in a high plateau, according to Biobot’s dashboard, while other parts of the country are reporting upticks.
This mirrors the reported case data: Northeast states Vermont, Rhode Island, New York, and Massachusetts reported the highest case rates in the week ending April 27, according to the latest Community Profile Report. But states in the South and West, such as North Carolina and Nebraska, reported the sharpest increases.
Almost one-third of new cases were caused by the BA.2.12.1 subvariant in the week ending April 23, according to the CDC’s latest estimates. This version of Omicron, first identified by the New York state health department, is even more transmissible than BA.2. It’s causing more than half of cases in the New York and New Jersey region, the CDC estimates.
Despite all of these concerning signals, the vast majority of the country seems unaware that we are in a new COVID-19 spike. Indeed, I’m writing this from the plane back to New York City, on which I’m one of few mask-wearers.
And I can’t really blame my fellow travelers for their lack of awareness: if you just look at the CDC’s Community Level map—as the agency recommends people do—you’d think that the whole country is in a green, low-risk zone. The agency’s old guidance, with more stringent, case-based thresholds, paints a very different picture.
The U.S. has “reached the choose-your-own-adventure stage of the pandemic,” as Maryn McKenna put it in a recent WIRED article. We’re taking “individual responsibility” to a whole new level.
-
Sources and updates, April 17
- A Poor People’s Pandemic Report: This new report, compiled by the Poor People’s Campaign (a national activist group that advocates for low-income Americans) as well as U.N. economists and other researchers, shows the pandemic’s disproportionate impacts by income levels. Overall, people in poorer counties died of COVID-19 at nearly twice the rate of those in richer counties, the report found. On this dashboard, users can see the correlations of COVID-19 death rates with income, population density, and other factors. This article from the Guardian includes more context on the findings.
- SARS-CoV-2 in Animals: I recently learned about this dashboard while working on an upcoming Documenting COVID-19 story: the U.S. Department of Agriculture (USDA) reports on COVID-19 cases in animals, identified through both PCR and antibody tests. In addition to the case numbers, the dashboard includes announcements of notable cases and recent research in this area. It’s important to note that these numbers are likely undercounts, because the U.S. doesn’t actively monitor animals for COVID-19, unlike some other countries.
- The Role of Wastewater Data in Pandemic Management: This new report from the Rockefeller Foundation examines how state and local public health agencies are using wastewater surveillance. The foundation surveyed 12 state and 194 local agencies, many of which have been monitoring wastewater for a year or more; this report includes findings on the populations served by wastewater surveillance, data used to make pandemic management decisions, barriers that agencies face for expanding their surveillance, and more.
- GAO report on Wastewater Surveillance: Speaking of wastewater, the U.S. Government Accountability Office (GAO) also released a report on the monitoring tool this week. The GAO report provides an overview of how wastewater surveillance works and its potential for providing early warnings of outbreaks, along with challenges faced by agencies seeking to start testing their wastewater. From the report’s highlights: “the lack of national coordination and standardized methods pose challenges to wider adoption.”
- Protection from vaccination and previous infection: A new study, published in the CDC MMWR this week, assesses the benefits of COVID-19 vaccination for people who had a prior infection. During the Omicron surge, the study shows, people who had been previously infected and vaccinated were less likely to be hospitalized due to a COVID-19 reinfection, compared to those who weren’t vaccinated. Vaccine effectiveness against hospitalization was 35% for those who had two doses, and 69% for those who had received a booster.
- Pfizer seeks booster shot for 5-11 year olds: This week, Pfizer announced that it’s asking the FDA to authorize a booster shot for children in the 5 to 11 age group. The company cited new data showing that kids who got a booster shot six months after their primary series experienced a significant increase in antibodies that protect against COVID-19. These data have yet to be published in a scientific report or vetted by experts, though. Also, still no news on Pfizer’s vaccine for younger children (which could also require three doses).
