- New York State expands wastewater surveillance program: This week, the New York State health department announced a major investment in the state’s wastewater surveillance program: the program has received a $6.6 million grant from the CDC and $15 million from the governor (over the next three years). With this investment, New York’s wastewater surveillance network will grow from 125 to 215 testing sites and will expand from COVID-19 to include flu, RSV, hepatitis, norovirus, and antimicrobial resistance. This is great news for New York—I hope to see other states make similar investments.
- Bivalent boosters vs. XBB lineages: The bivalent, Omicron-specific booster shots provide some protection against XBB.1.5 and related Omicron subvariants, according to a new study published this week in the CDC’s Morbidity and Mortality Weekly Report. CDC researchers used data from COVID-19 testing at pharmacies to compare results among people who had received the new booster and those who hadn’t. Booster recipients were significantly less likely to have a symptomatic XBB/XBB.1.5 infection compared to people who hadn’t received the shot, the researchers found (with a vaccine effectiveness value of 48%). While the boosters work less well against XBB.1.5 than they did against BA.4/BA.5, they’re still a valuable protective measure.
- CDC overhauling data communications: The CDC is creating new internal offices that will change how it processes, publishes, and communicates about data, according to POLITICO. The new offices include an Office of Health Equity and an Office of Public Health Data, Surveillance, and Technology—both of which have new acting directors as of this week. It’s currently unclear what the new offices will do, exactly, or how they will improve upon a fractured nationwide health data system (with decisions about how to store and share key data largely left up to state agencies and private companies). Still, it’s good to see movement on the CDC’s efforts.
- WHO deliberates ending the global health emergency: On Friday, a World Health Organization committee met to discuss whether the official global health emergency over COVID-19 should be ended. The committee’s decision will be made public tomorrow, as a recommendation to WHO Director-General Tedros Adhanom Ghebreyesus; Tedros will ultimately decide whether or not to end the emergency. Global health experts who spoke to STAT reporter Helen Branswell suggested that the WHO likely isn’t ready to end this emergency yet, but it may happen later in 2023.
- KFF compiles Long COVID data: A new report from the Kaiser Family Foundation compiles and provides context for Long COVID data reported by the Census and CDC’s Household Pulse Survey. The share of people who reported ever having Long COVID symptoms following a COVID-19 case has declined slightly over time, the KFF report finds; this number went from 35% in June 2022 to 28% in January 2023. However, the number is still high and Long COVID can be debilitating for many, as 79% of people with Long COVID report limitations to their day-to-day activities.
- Health of Congressional Districts: Finally: a new dashboard, published this week by researchers at NYU Langone Health, provides detailed health metrics for all 435 Congressional districts in the U.S. (plus Washington, D.C.). The dashboard is a helpful source for researchers and policymakers looking to understand health patterns in specific districts. One of its key metrics is a “COVID Local Risk Index” that reflects the risk residents face for severe health, social, and economic outcomes of COVID-19.
Category: Uncategorized
-
Sources and updates, January 29
-
National numbers, October 9

Regional wastewater data from Biobot suggest the Northeast currently has much higher coronavirus transmission levels than the rest of the country. In the past week (October 1 through 7), the U.S. reported about 300,000 new COVID-19 cases, according to the CDC. This amounts to:
- An average of 42,000 new cases each day
- 89 total new cases for every 100,000 Americans
- 10% fewer new cases than last week (September 24-30)
In the past week, the U.S. also reported about 23,000 new COVID-19 patients admitted to hospitals. This amounts to:
- An average of 3,300 new admissions each day
- 7.1 total admissions for every 100,000 Americans
- 5% fewer new admissions than last week
Additionally, the U.S. reported:
- 2,400 new COVID-19 deaths (350 per day)
- 79% of new cases are caused by Omicron BA.5; 14% by BA.4.6; 5% by BF.7; 2% by BA.2.75 (as of October 8)
- An average of 400,000 vaccinations per day (CDC link)
Following a pattern from the last couple of months, national COVID-19 cases and hospitalizations continued to trend slightly downward this week—though local indicators suggest we may experience a fall surge soon.
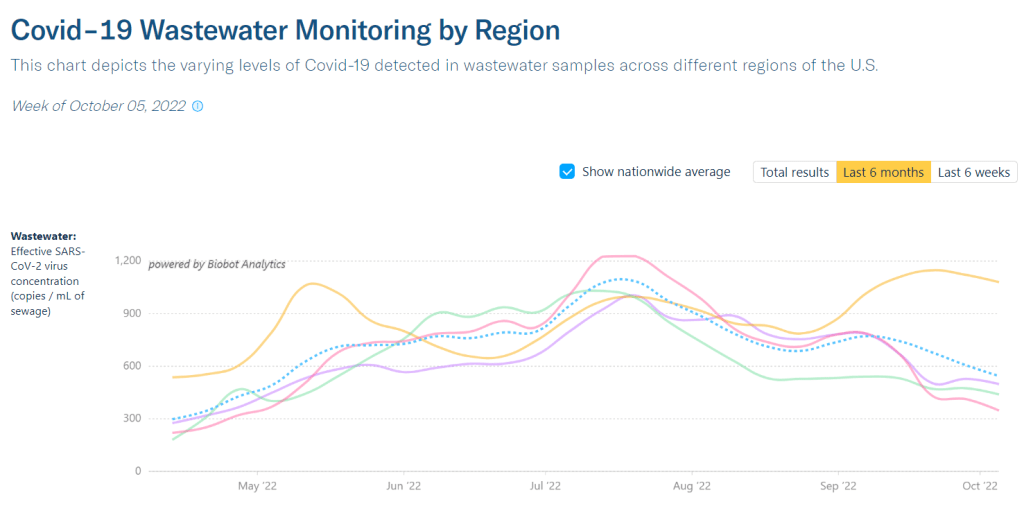
Biobot’s wastewater dashboard reports that coronavirus transmission has plateaued at a high level in the Northeast, and at lower levels in the Midwest, West, and South. More locally, several counties that Biobot monitors in Massachusetts, New Jersey, and nearby states are seeing increased viral levels in their wastewater; two prominent examples are Boston and Hartford, Connecticut.
Official COVID-19 cases are heavily underreported right now (by a factor of ten times or more); if we had a better testing infrastructure, they might match more closely to wastewater trends.
Even so, data from the HHS’s October 6 Community Profile Report show that several Northeast states reported among the highest case rates this week. Rhode Island, New Jersey, New York, and Massachusetts all reported 150 or more cases per 100,000 people in the week ending October 5. Kentucky and Puerto Rico reported even more cases, at rates over 200 per 100,000.
At the moment, we’re not seeing enough of the newer Omicron subvariants (BF.7, BA.2.75, etc.) to blame the transmission increases on them. Cold weather (driving people to gather indoors) and waning immunity from past cases and vaccinations are more likely culprits, as Katelyn Jetelina noted in a recent Your Local Epidemiologist post.
Jetelina also pointed out that fall waves are starting in Western European countries, including Germany and the U.K. The U.S. has followed trends in these countries throughout the pandemic, and it seems likely that the same thing will happen this fall—especially considering that the U.S. and European nations have similarly dismissive attitudes towards safety measures right now.
Again, the best way to protect yourself as we prepare for a potential surge is to get an Omicron-specific, bivalent booster shot. Uptake of these shots continues to be quite low in the U.S. so far: as of October 5, just 11.5 million Americans have received them, representing about 5% of the eligible population.
-
National numbers, September 11

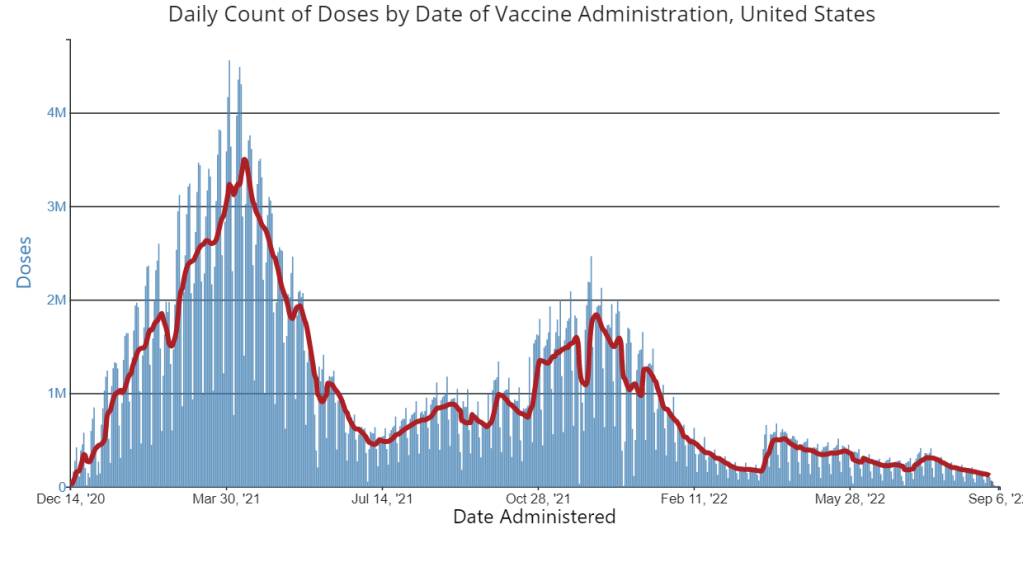
A week after new COVID-19 boosters were authorized, the U.S. has yet to see a significant jump in vaccine doses administered. Chart via the CDC. In the past week (September 3 through 9), the U.S. reported about 500,000 new COVID-19 cases, according to the CDC. This amounts to:
- An average of 70,000 new cases each day
- 150 total new cases for every 100,000 Americans
- 19% fewer new cases than last week (August 27-September 2)
In the past week, the U.S. also reported about 32,000 new COVID-19 patients admitted to hospitals. This amounts to:
- An average of 4,600 new admissions each day
- 9.9 total admissions for every 100,000 Americans
- 11% fewer new admissions than last week
Additionally, the U.S. reported:
- 2,200 new COVID-19 deaths (0.7 for every 100,000 people)
- 88% of new cases are caused by Omicron BA.5; 9% by BA.4.6 (as of September 10)
- An average of 25,000 vaccinations per day (per Bloomberg)
It might appear that the U.S. reported a significant drop in COVID-19 cases last week, as the CDC’s numbers dropped to about 70,000 new cases a day last week from 87,000 new cases a day in the prior week. But in fact, the decline was likely exaggerated by Labor Day weekend, as testing labs and the public health workers who crunch data took time off.
Wastewater data from the last two weeks tell a different story. In Biobot’s most recent update, the company reported a slight increase in coronavirus concentration in wastewater at the national level. Regionally, the virus grew in the Northeast, Midwest, and South.
While hospital admissions and other healthcare system metrics continue to show a decline, wastewater data is often an advanced indicator for new coronavirus surges. In this case, it could mean the often-predicted fall wave is beginning in some parts of the country. Remember: wastewater surveillance can catch transmission upticks early because it doesn’t rely on individuals getting PCR tests or seeking out healthcare—factors that can cause lags and undercounting in case and hospitalization data.
Potential factors contributing to increased COVID-19 outbreaks might include holiday gatherings and travel, the start of the school year, and new Omicron subvariants taking over. BA.4.6, the lineage from BA.4 that may be even more transmissible, went from causing about 8% of new cases in the week ending September 3 to 9% in the week ending September 10, according to CDC estimates; meanwhile, BA.5’s prevalence dropped by about 1%.
This might seem like a small shift, but it is an indicator of BA.4.6’s capacity to eventually outcompete BA.5—and reinfect people who previously caught a different version of Omicron. BA.4.6 is causing a higher share of cases in the Midwest, specifically in Iowa, Kansas, Missouri, and Nebraska, so those are states to particularly watch for increased COVID-19 spread.
At the same time, the CDC reports that 1% of cases nationwide were caused by BA.2 lineages (not BA.2.12.1) last week. This is likely the work of BA.2.75, another subvariant of concern that the CDC isn’t yet tracking separately. (More on that later in the issue.)
The federal government’s main action to mitigate this probably-coming surge is a new booster campaign, with the Omicron BA.4/BA.5 shots authorized last week. But vaccination numbers have been low so far, with far fewer than 100,000 doses administered each day last week.
-

Reflections and format shifts following the CDD’s first hiatus

Beach selfie from my last week of vacation! This is my first COVID-19 Data Dispatch issue after my August hiatus! Here are a few updates on how that went and changes I’m thinking about for the publication going forward.
First off, I owe a big thank you to everyone who reached out with well wishes on this break. After two years without missing a single week of publication, I was (perhaps irrationally) nervous that some readers would be upset that I was taking off for a bit. But that didn’t happen! I appreciate everyone’s understanding and patience.
Besides a few hours at my part-time job (MuckRock’s Documenting COVID-19 project) and one day of poll working for New York City’s August primary, I didn’t work at all between August 4 and August 29. Here are a few fun things I did instead:
- Spent a lot of time outside (mostly at various beaches and NYC parks);
- Biked in every NYC borough (longest trip: to Van Cortlandt Park and Woodlawn Cemetery in the Bronx);
- Read three books (highly recommend “An Immense World” by Ed Yong!);
- Drafted most of a long fanfiction project;
- Watched a lot of Star Trek: The Original Series.
If you’re curious about the logistics of taking a longer vacation as a freelancer, you can check out this Twitter thread I wrote last week:
The break was really all that I had hoped it would be: a refreshing step away from constant COVID-19 coverage that allowed me to reflect on why I do this job. With the COVID-19 Data Dispatch and my other work, I aim to give readers the information they need to make individual health decisions, while also thinking about how they fit into broader communities. While my work has evolved a lot over the last two years, that basic tenet hasn’t changed.
At the same time, though, my hiatus made me think more about how I can balance the newsletter and blog with other activities that are important for maintaining my mental health: getting off my computer, spending time outside, non-journalism writing, investing in new skills, and so on. I’m probably not unlike other independent creators when I say there are weeks when writing this newsletter/blog feels more like a chore than a useful service; I want to keep it feeling like the latter.
With that in mind, here are a few shifts I’m thinking about for the coming months:
- The “National numbers” and “Sources and updates” sections will stay consistent. In considering this project’s format, I knew that these two sections are particularly valuable for readers (and they tend to be fairly straightforward for me to write). So, don’t expect any big changes here.
- Shorter posts. As any editor who’s worked with me could tell you, I am a writer who constantly goes over my assigned word count. And when I have no set word count, as is the case for these issues… They often get quite long, even though I know that shorter summaries tend to be more helpful for readers. In the future, I’m aiming to keep posts shorter, and only write a longer explainer or commentary when it seems actually necessary.
- More reader engagement. We continue to be in a confusing phase of the pandemic, with less reliable data or reliable guidance. I want to prioritize answering your questions. To that end, I’ve made an anonymous Google form for submitting COVID-19 queries. It’ll be linked in every issue going forward and on the website’s homepage. While you can still reply to emails too, I hope this will be an easier way to send me ideas for topics I should cover.
- Potential events and multimedia: As older readers may remember, in spring 2021, the COVID-19 Data Dispatch ran a series of virtual data workshops— which I really enjoyed putting together! I’m thinking about more possible virtual events for the future, as well as ideas for new content formats (maybe a podcast miniseries? should I do explainers on TikTok?). I’d love to hear from you, readers, if there’s anything in particular you want to see here.
- Expanding beyond COVID-19: Between the continued monkeypox outbreak, the resurgence of polio in New York, and plenty of climate disasters this summer, it’s clear that COVID-19 is far from our only public health concern right now. While my projects in the immediate future are still mostly COVID-focused, you might see some other public health and data information creep into newsletters/blogs going forward. (For example, this week’s “Sources and updates” section includes a couple of non-COVID items.)
- Occasional breaks. While I have no intention of making like the CDC and pausing my newsletter for any federal holiday, you can expect that the COVID-19 Data Dispatch will not run every single weekend going forward. Like, I’ll take Christmas off. Reasonable stuff.
None of these are particularly major changes, but in the spirit of transparency, I wanted to share what I’m thinking about with all of you. As always, comments or questions are very welcome: just shoot me an email or fill out the new anonymous question form.
-
National numbers, September 4

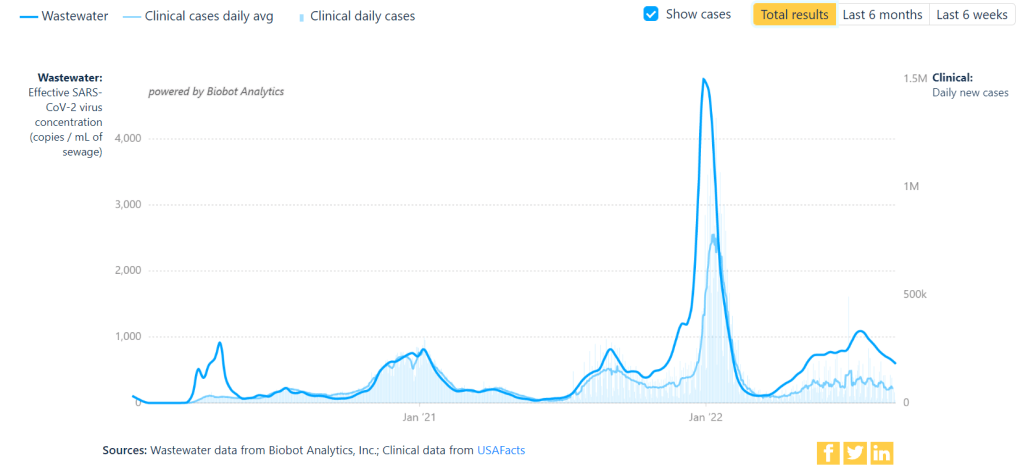
Coronavirus trends in wastewater compared to official case numbers, since spring 2020. Screenshot from Biobot’s dashboard, retrieved September 4. In the past week (August 27 through September 2), the U.S. reported about 590,000 new COVID-19 cases, according to the CDC. This amounts to:
- An average of 80,000 new cases each day
- 179 total new cases for every 100,000 Americans
- 8% fewer new cases than last week (August 20-26)
In the past week, the U.S. also reported about 36,000 new COVID-19 patients admitted to hospitals. This amounts to:
- An average of 5,100 new admissions each day
- 10.8 total admissions for every 100,000 Americans
- 4% fewer new admissions than last week
Additionally, the U.S. reported:
- 2,800 new COVID-19 deaths (0.9 for every 100,000 people)
- 89% of new cases are caused by Omicron BA.5; 8% by BA.4.6 (as of September 3)
- An average of 70,000 vaccinations per day (per Bloomberg)
Over the past month, COVID-19 trends in the U.S. have been fairly consistent: disease spread has declined slowly around the country. Official case counts dropped from about 120,000 a day in the first week of August, to about 80,000 a day last week.
New hospital admissions, a more reliable metric these days, have also declined. A month ago, U.S. hospitals were admitting over 6,000 new COVID-19 patients a day; last week, that number was about 5,000. Wastewater data from Biobot and from the CDC suggest that this trend has been broadly consistent across different regions.
But coronavirus transmission is not currently at low levels by any means. For example, look at Biobot’s national chart showing virus concentration in wastewater compared to officially-reported case numbers. From case numbers alone, you might think that COVID-19 is much less prevalent now than it was in late August or early September last year. But the wastewater data reveal that transmission now is actually pretty close to early-Delta surge levels. (It is, in fact, PCR testing that has declined.)
Similarly, the CDC’s Community Transmission Levels (also known as the older metrics, based on cases and test positivity) show that about 90% of U.S. counties are currently facing high transmission and should require masks indoors. Even the current—and much more lenient—Community Levels suggest that more than half of the country is in a high- or medium-COVID-risk zone.
The summer surge has waned so slowly thanks to the U.S.’s complete abandonment of measures to mitigate COVID-19’s spread, combined with the rise of newer Omicron subvariants. BA.5 continues to dominate here, causing almost 90% of new cases in the week ending September 3, though it’s facing competition from BA.4.6: a version of BA.4 that appears to have a slight advantage.
Most experts agree that we will probably face another surge this fall and winter, as more people gather inside and travel for the holidays. The question is how severe that wave will be, which may be determined via a contest between updated vaccines (more on that later in the issue) and the coronavirus’ continued capacity for mutation.
One potential sign of such a wave: wastewater surveillance in South Africa has picked up an increase in coronavirus concentration, Bloomberg reported yesterday. Also: your usual reminder to be wary of data trends in the days following the holiday weekend.
-
National numbers, July 31

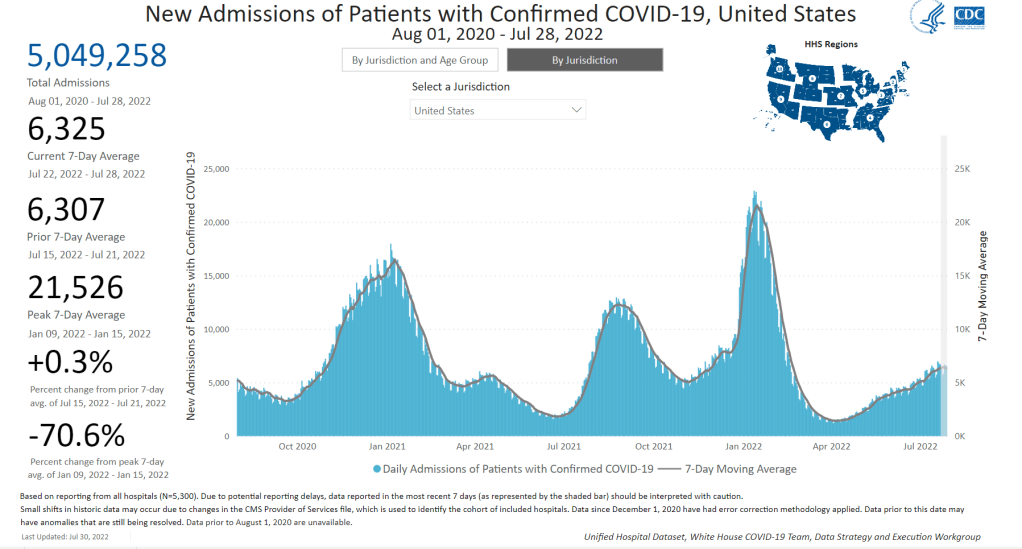
New hospital admissions for COVID-19 are slowing nationwide, a potential sign of the subvariant surge peaking. Chart via the CDC, retrieved on July 31. In the past week (July 23 through 29), the U.S. reported about 880,000 new COVID-19 cases, according to the CDC. This amounts to:
- An average of 130,000 new cases each day
- 269 total new cases for every 100,000 Americans
- 1% fewer new cases than last week (July 16-22)
In the past week, the U.S. also reported about 44,000 new COVID-19 patients admitted to hospitals. This amounts to:
- An average of 6,300 new admissions each day
- 13.5 total admissions for every 100,000 Americans
- 2% more new admissions than last week
Additionally, the U.S. reported:
- 2,500 new COVID-19 deaths (0.8 for every 100,000 people)
- 82% of new cases are caused by Omicron BA.5; 13% by BA.4 (as of July 23)
- An average of 100,000 vaccinations per day (per Bloomberg)
The U.S.’s Omicron BA.5 wave appears to be creeping past its plateau, according to several major indicators. Nationwide, 1% fewer new cases were reported this week compared to last week, the second week in a row of clear deceleration in this metric (with no major holidays interrupting reports).
New hospital admissions are also slowing down: the number of COVID-19 patients newly admitted to hospitals this week was only 2% higher than it was last week. It’s a smaller increase than any reported week-over-week in the last couple of months.
And the plateau is showing up in wastewater, too: data from Biobot Analytics show that the coronavirus concentration in America’s sewers dipped slightly last week in all four regions of the country. About 55% of sewersheds in the CDC’s wastewater surveillance network reported coronavirus decreases or very slight increases in the last week, compared to 45% reporting more significant increases.
To me, these metrics are suggesting that the Omicron subvariant wave may be, finally, running out of people to infect (or reinfect). But the decline is incredibly slow, likely because the U.S. has taken almost no measures to curb transmission.
The CDC’s community transmission guidance (also known as the old guidance, pre-February 2022 switch to “Community Levels”) suggests that Americans in 98% of counties should be masking indoors right now. But almost no state or local public health departments have actually brought back mask requirements. Even Los Angeles County failed to institute its planned indoor mask mandate, due to public pushback at the measure and cases trending down.
Meanwhile, testing indicators continue to suggest that reported case counts are a small fraction of the actual coronavirus infections happening across the country right now. The national PCR test positivity rate was 18% last week, according to the CDC; and almost every state reported a positivity rate over 10%, according to the July 28 Community Profile Report. (Experts consider test positivity over 10% to be evidence of high transmission and insufficient testing.)
As fewer PCR tests are conducted, the companies that process these tests are laying off workers and cutting their capacity, according to the Wall Street Journal. Even some companies that make at-home rapid tests are taking these measures, though rapid test capacity is still much higher than PCR testing capacity right now.
The safety measures that can prevent coronavirus transmission have not changed with BA.5. Individuals and small communities still have the ability to keep using masks, testing, gathering in outdoor spaces, etc., even as our institutions fail to keep us safe.
-
Sources and updates, July 24
- New CDC report on drug overdose deaths during the pandemic: Drug overdose deaths increased by 30% from 2019 to 2020, according to a new CDC report compiling data from 25 states and D.C. But this increase was higher for Black and Native Americans: deaths among these groups increased by 44% and 39%, respectively. The full report includes more details on how overdose deaths disproportionately occurred in Black and Native populations, as well as the need for more easily accessible treatments for substance abuse.
- CDC survey of public health workers: Another CDC report that caught my attention this week presented results from a national survey of state and local public health workers in 2021. Almost three in four of the workers surveyed were involved with COVID-19 response last year. The survey provides further evidence of burnout among public health workers: 40% of those surveyed reported that they intend to leave their jobs within the next five years.
- COVID-19 testing options: COVID-19 Testing Commons is a research group at Arizona State University’s College of Health Solutions that has compiled comprehensive information about COVID-19 tests available worldwide. You can search the database for tests by company, platform, type of specimen collected, regulatory status, and more. The group also recently compiled a report summarizing these testing options in the pandemic to date.
- Congressional hearing on Long COVID: This week, Congress’s Select Subcommittee on the Coronavirus Crisis held a hearing specifically about Long COVID. Congressmembers heard from Long COVID patient advocates and researchers about the impacts of this condition and the urgent need for more research and support. I highly recommend reading or listening to the testimony of Hannah Davis, cofounder of the Patient-Led Research Collaborative, for a powerful summary of these impacts and needs. (If you’re watching the video: her testimony starts at about 28:50.)
- CDC recommends Novavax vaccine: The CDC has officially authorized Novavax’s COVID-19 vaccine, following the FDA authorization that I mentioned in last week’s issue. Novavax’s vaccine is protein-based, which is an older type of vaccine but has been less common for COVID-19; some experts are hopeful that people who have hesitated with the mRNA vaccines may be more likely to get Novavax. Dr. Katelyn Jetelina has a helpful summary of this vaccine’s potential impact at Your Local Epidemiologist.
- NYC prevalence preprint updated: I’ve linked a couple of times to this study from a group at the City University of New York, with the striking finding that an estimated one in five New Yorkers got COVID-19 during a two-week period in the BA.2/BA.2.12.1 surge. The researchers recently revised and updated their study, based on some feedback from the scientific community. Their primary conclusions are unchanged, lead author Denis Nash wrote in a Twitter thread, but the updated study includes some context about population immunity and NYC surveillance.
-
National numbers, July 24

Has the BA.5 surge reached a plateau? Data from wastewater and other sources seem to suggest, maybe. Chart via Biobot Analytics. In the past week (July 16 through 22), the U.S. reported about 880,000 new COVID-19 cases, according to the CDC. This amounts to:
- An average of 130,000 new cases each day
- 268 total new cases for every 100,000 Americans
- 1% more new cases than last week (July 9-15)
In the past week, the U.S. also reported about 43,000 new COVID-19 patients admitted to hospitals. This amounts to:
- An average of 6,200 new admissions each day
- 13.2 total admissions for every 100,000 Americans
- 5% more new admissions than last week
Additionally, the U.S. reported:
- 2,400 new COVID-19 deaths (0.7 for every 100,000 people)
- 78% of new cases are caused by Omicron BA.5; 13% by BA.4 (as of July 16)
- An average of 100,000 vaccinations per day (per Bloomberg)
Reported COVID-19 cases and hospital admissions seem to suggest that maybe the BA.5 surge is slowing down, at the national level. (And it is, definitively, the BA.5 surge, with almost 80% of new cases caused by this subvariant in the week ending July 16). According to CDC data, new cases only increased by 1% this week, compared to the week prior; last week, they increased by 17%.
New hospital admissions, similarly, increased by 5% this week, compared to 15% the week prior. And wastewater data from Biobot are showing a potential national plateau in the last week, with very slight increases or decreases in all four main regions of the country.
The CDC’s wastewater monitoring also shows that “most of the country is reporting moderate to high SARS-CoV-2 levels in wastewater.” About half of the 800 sites in the CDC network reported a decrease in coronavirus levels in the last two weeks, while 43% reported an increase.
These are all good signs. But I’m skeptical that we’re anywhere near the end of this current surge, for a few reasons. First, the continued underreporting of cases makes it difficult to evaluate case data, both nationally and in local settings. (For example, is NYC actually seeing a decline in transmission, or is the recent decline there a result of less PCR testing?) The CDC reported a national PCR test positivity of 17% last week, and it’s even higher in many states.
Second, the declines we’re seeing in hospital admissions and coronavirus levels in wastewater—both more reliable indicators than cases—are very slight. These patterns suggest that, while we may be near the peak of the BA.5 surge, it could take several weeks for it to actually abate. And by the time that happens, another new variant (maybe BA.2.75, maybe something else entirely) could likely come in and bump transmission again.
Finally, the U.S. as a whole is doing very little to manage this surge. I think this subheading from a recent POLITICO Pro article provides a good summary of the situation: “Strategies for managing 130,000 new daily Covid cases are largely the same as they were for managing 30,000 new daily cases four months ago.”
There’s been a slight uptick in second booster shots for Americans over age 50, according to CDC data. And a few, isolated localities are considering new mask mandates. But by and large, most people are heading into potential reinfection from BA.5 with limited protection. Stay safe out there.
-
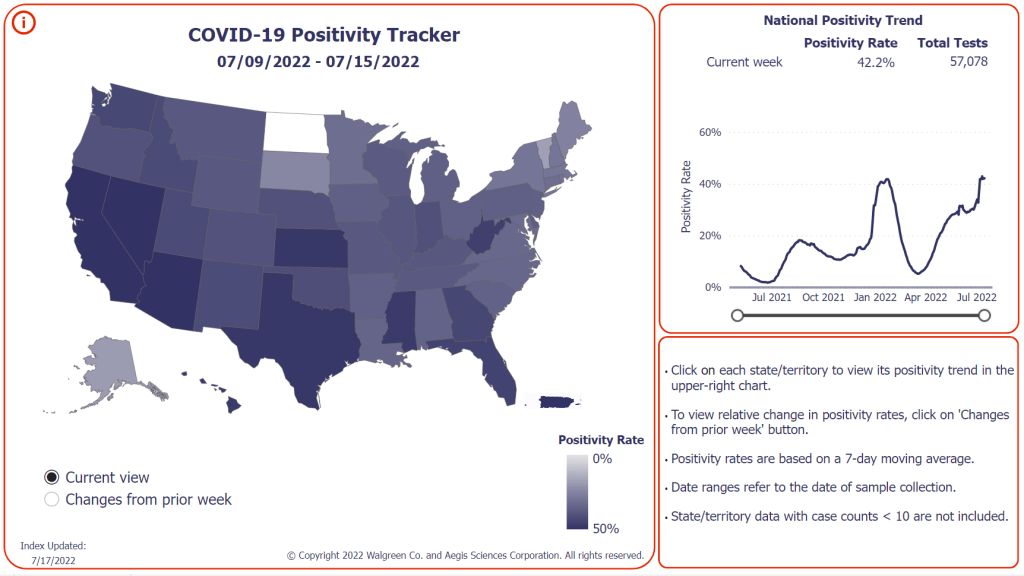
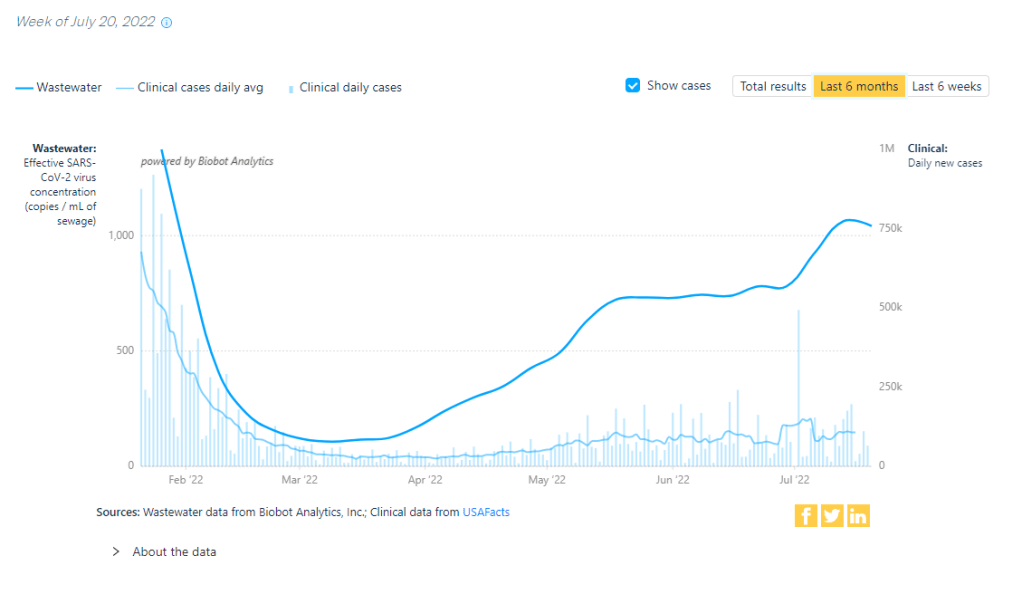
National numbers, July 17

More than 40% of COVID-19 tests conducted at Walgreens pharmacies in the last week came back positive. This is not a good indicator, to put it mildly. In the past week (July 9 through 15), the U.S. reported about 870,000 new COVID-19 cases, according to the CDC. This amounts to:
- An average of 120,000 new cases each day
- 265 total new cases for every 100,000 Americans
- 16% more new cases than last week (July 2-8)
In the past week, the U.S. also reported about 41,000 new COVID-19 patients admitted to hospitals. This amounts to:
- An average of 5,900 new admissions each day
- 12.5 total admissions for every 100,000 Americans
- 14% more new admissions than last week
Additionally, the U.S. reported:
- 2,500 new COVID-19 deaths (0.8 for every 100,000 people)
- 65% of new cases are caused by Omicron BA.5; 16% by BA.4 (as of July 9)
- An average of 80,000 vaccinations per day (per Bloomberg)
As I suspected last week, the small dip in official COVID-19 case numbers was a result of the July 4 holiday, not an actual decline in transmission. This week, cases are up again nationwide, with the highest number reported since early February.
Of course, PCR testing capacity has declined substantially since February. And test positivity rates are high across the country: the CDC reported a nationwide rate of 17.5%, while the Walgreens COVID-19 Index (which compiles data from testing at Walgreens pharmacies) reports a rate of 42%. Such high positivity numbers indicate that our official case data are capturing a small fraction of cases.
And we have other indicators of the substantial COVID-19 spread happening right now. Biobot’s wastewater tracker reports increased transmission nationwide and in all four regions in the last two weeks. Over half of sewershed sites in the CDC’s National Wastewater Surveillance System reported increases in the two weeks ending July 11—and for about one-third of sites, those increases were more than 100%.
New hospital admissions of COVID-19 patients went up by 14% last week, similarly to the highest levels reported since February. Reports of COVID-19 symptoms are also on the upswing, according to survey data collected by the Delphi Group at Carnegie Mellon University.
While some hospitalization metrics and deaths may be low at the moment, remember that these are lagging indicators: they go up a few weeks after cases. And cases are definitely going up right now, driven by the Omicron subvariant BA.5—which is now dominant in the country.
BA.5 and BA.4 together caused more than 80% of new COVID-19 cases in the week ending July 9, according to CDC estimates. BA.5 is pulling ahead, though, readily reinfecting people in a national climate that seems to have largely given up on safety measures.
But measures like masking, testing, and booster shots can still reduce transmission. I was heartened this week to see Los Angeles County preparing for a new indoor mask mandate in response to rising cases; other places should follow this lead.
-
Sources and updates, July 10
- CDC adds (limited) Long COVID data to its dashboard: This week, the CDC’s COVID Data Tracker added a new page, reporting data from a study of “post-COVID conditions” (more colloquially known as Long COVID). The study, called Innovative Support for Patients with SARS-CoV-2 Infections (INSPIRE), follows patients who test positive for up to 18 months and tracks their continued symptoms. Among about 4,100 COVID-positive patients in the study, over 10% still had symptoms at three months after their infections, and over 1% still had symptoms at 12 months. This is just one study among many tracking Long COVID, but it is an important step for the CDC to add these data to their dashboard.
- Air change guidance by state: In recognition of the role ventilation can play in reducing COVID-19 spread, some states have put out recommendations for minimum air changes per hour (ACH), a metric for tracking indoor air quality. Researcher Devabhaktuni Srikrishna has compiled the recommendations on his website, Patient Knowhow, with a map showing ACH guidance by state. (I recently interviewed Srikrishna for an upcoming story about ventilation.)
- COVID-19 is a leading cause of death in the U.S.: A new study from researchers at the National Institutes of Health’s National Cancer Institute confirms that COVID-19 was the third-leading cause of death in the U.S., in both 2020 and 2021. The researchers utilized death records from the CDC in their analysis, comparing COVID-19 to common causes such as cancer and heart disease. COVID-19 was a top cause of death for every age group over age 15, the study found.
- COVID-19 disparities in Louisiana: Another notable study this week: researchers at the University of Maryland, College Park examined the roles of social, economic, and environmental factors in COVID-19 deaths in Louisiana, focusing on Black residents. “We find that Black communities in parishes with both higher and lower population densities experience higher levels of stressors, leading to greater COVID-19 mortality rate,” the researchers wrote. The study’s examination of environmental racism in relation to COVID-19 seems particularly novel to me; I hope to see more research in this area.
- Tracking coronavirus variants in wastewater: And one more new study: a large consortium of researchers, led by scientists at the University of California San Diego, explores the use of wastewater surveillance to track new variants. Variants can show up in wastewater up to two weeks earlier than they show up in samples from clinical (PCR) testing, the researchers found. In addition, some variants identified in wastewater are “not captured by clinical genomic surveillance.”
- Global COVID-19 vaccine and treatment initiative ending: The ACT-Accelerator, a collaboration between the World Health Organization and other health entities and governments, has run out of funding. This is bad news for low- and middle-income countries that relied on the program for COVID-19 vaccines and treatments—many of which are still largely unvaccinated, more than a year after vaccines became widely available in high-income countries. Global health equity initiatives will likely continue in another form, but funding will be a continued challenge.
