Category: Uncategorized

  • National numbers, July 4

    National numbers, July 4

    Cases are rising in unvaccinated areas, such as Las Vegas and parts of Texas. Chart via the July 1 Community Profile Report.

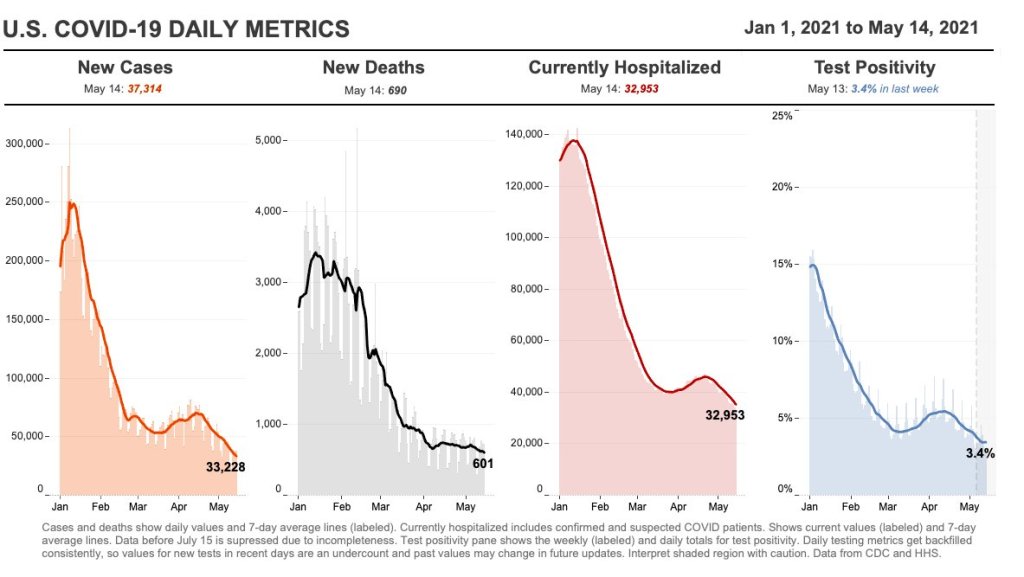
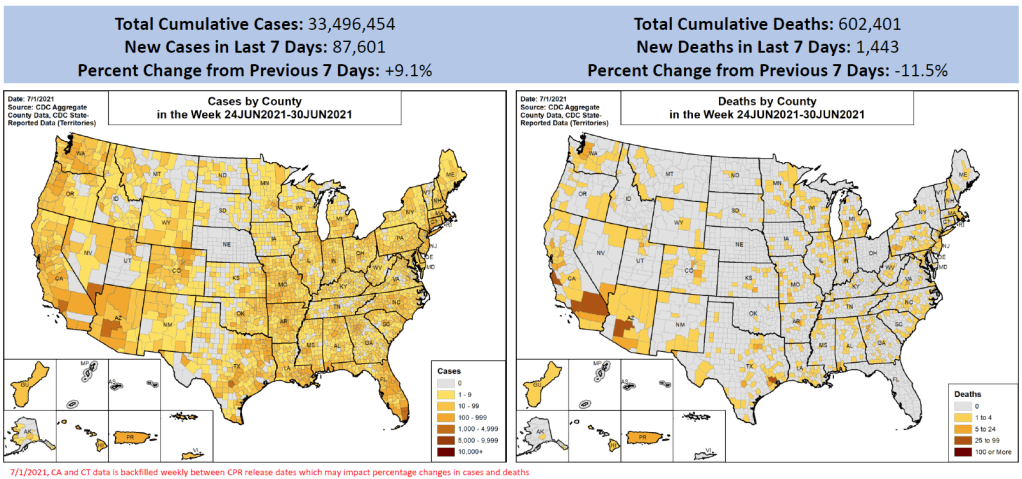
    In the past week (June 26 through July 2), the U.S. reported about 88,000 new cases, according to the CDC. This amounts to:

    • An average of 12,500 new cases each day
    • 27 total new cases for every 100,000 Americans
    • 9.1% more new cases than last week (June 19-25)

    Last week, America also saw:

    • 13,000 new COVID-19 patients admitted to hospitals (4.0 for every 100,000 people)
    • 1,400 new COVID-19 deaths (0.4 for every 100,000 people)
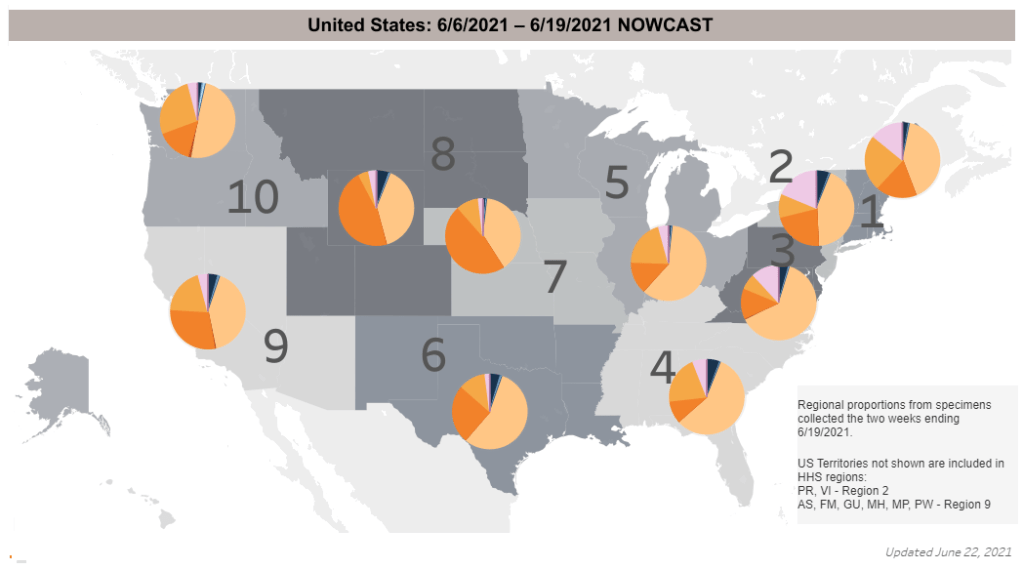
    • 26% of new cases now Delta-caused (as of June 19)
    • An average of 1.1 million vaccinations per day (per Bloomberg)

    This is the first week since April that we’ve seen new COVID-19 case numbers go up in the U.S. It’s nominally a small bump—about 7,300 more cases than last week—but represents a 9% increase, and may be the beginning of a summer surge. (Even if we see a dip in the numbers this week due to the July 4 holiday.)

    The culprit for this case rise is, of course, the Delta variant (B.1.617.2). According to CDC estimates, the variant makes up about 26% of new cases in the country. But, as I have explained in previous issues, the CDC data are old—that 26% estimate is as of June 19, about two weeks ago.

    The Delta variant is doubling every two weeks, so we can assume that the variant now causes at least half of new cases in the U.S. Estimates from other genomic sequencing sources (which are more up-to-date than the CDC, though less comprehensive) indicate that the variant may now be causing up to 60% of new cases.

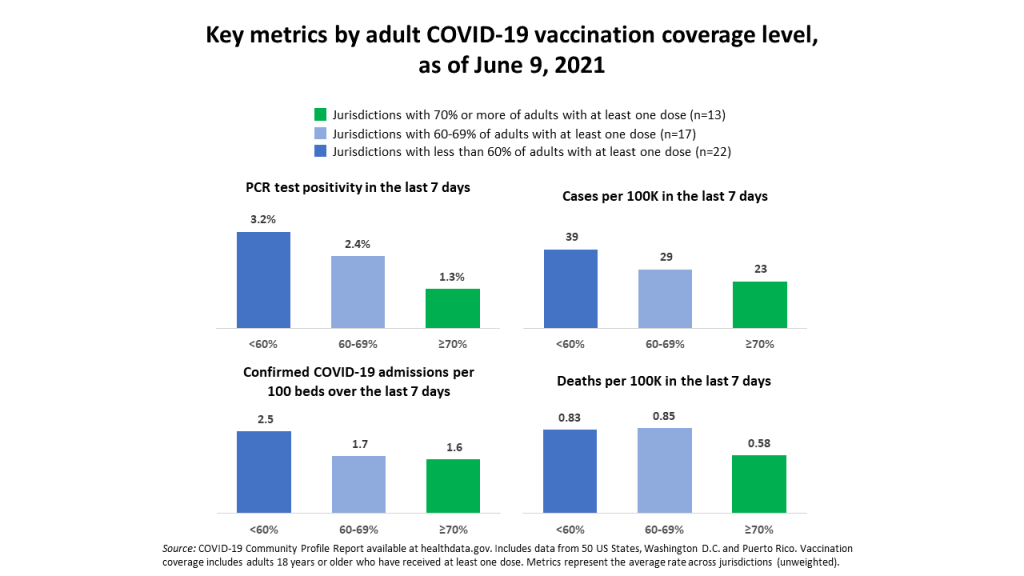
    This variant poses the most danger to unvaccinated people; many of the current Delta outbreaks are happening in regions with lower vaccination rates. Nevada and Missouri, the two states with the highest new case counts last week, have about 42% and 39% of their populations fully vaccinated, respectively.

    Some metropolitan areas in Missouri, Texas, and other parts of the Midwest have less than one-third of their populations fully vaccinated—and saw more than 200 new cases for every 100,000 people last week. That’s about seven times the national average for new cases. 

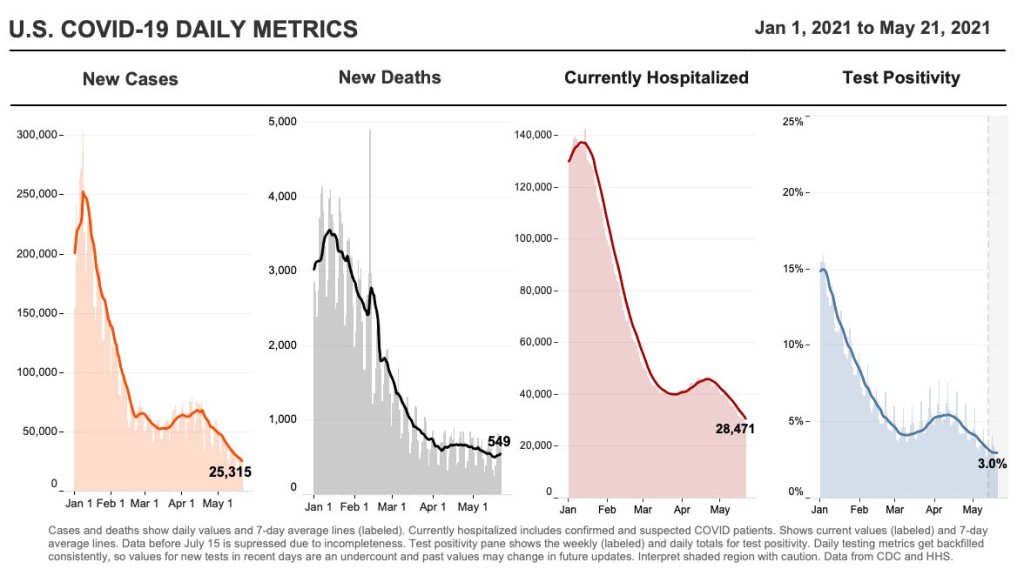
    Nationally, hospitalizations also rose very slightly this week, while deaths remained low, at about 200 new COVID-19 deaths each day. The vaccines continue to protect seniors and other more vulnerable people from severe disease. But it is likely that, in the coming weeks, these numbers will start to rise in the areas seeing Delta outbreaks. Many Midwest hospitals are already filling up.

    More on vulnerable, non-vaccinated pockets later in this issue.

  • Featured sources, June 27

    • Vaccine hesitancy by ZIP code: A new data visualization tool from the Institute for Health Metrics and Evaluation provides details on which parts of the U.S. would most benefit from vaccination campaigns. The underlying data come from a survey run by the Delphi Research Group at Carnegie Mellon, conducted between June 4 and June 10.
    • OIG report on nursing homes: The HHS Office of Inspector General published a new report this week evaluating COVID-19 outbreaks in nursing homes. The report found that two in five Medicare beneficiaries living in nursing homes were diagnosed with COVID-19 (confirmed or probable cases) in 2020, and almost 1,000 more seniors died per day in April 2020 compared to April 2019.
    • The State of the Nation’s Housing, 2021: This comprehensive report from the Joint Center for Housing Studies at Harvard provides data on home prices, rents, and other related metrics for the past year. The report shows that many households—especially those who are Black and Hispanic—are still behind on housing payments, and could benefit from continued assistance (such as the CDC eviction moratorium extended this week).

  • National numbers, June 27

    National numbers, June 27

    In the past week (June 19 through 25), the U.S. reported about 79,000 new cases, according to the CDC. This amounts to:

    • An average of 11,000 new cases each day
    • 24 total new cases for every 100,000 Americans
    • 4% fewer new cases than last week (June 12-18)

    Last week, America also saw:

    • 12,900 new COVID-19 patients admitted to hospitals (3.9 for every 100,000 people)
    • 2,000 new COVID-19 deaths (0.6 for every 100,000 people)
    • 52% of new cases in the country now Alpha-caused (as of June 19)
    • 21% of new cases now Delta-caused (as of June 19)
    • An average of 0.75 million vaccinations per day (per Bloomberg)
    CDC map showing estimated variant prevalence by region. The Delta variant, shown in orange here, is most common in the Midwest, where many are unvaccinated.

    Cases have continued to plateau this week, with less than a 5% drop in the daily average. As I’ve said in previous weeks, this is partially due to slowing vaccinations—the White House admitted last week that the U.S. won’t meet Biden’s July 4 goal—and partially due to the Delta variant, which now causes at least 20% of new cases in the country. (More on Delta later.)

    While those parts of the country that are widely vaccinated are still seeing low case numbers, others may need to prepare for another surge. A few Midwest states, in particular, have seen case jumps in recent weeks; the Delta variant is more prevalent in this region than others, per CDC data. (See the orange pie chart slices on the map above.)

    Missouri now has the highest rate of new COVID-19 cases per capita: 87 cases for every 100,000 people during the week ending June 23, more than three times higher than the national average. The state has seen a sharp increase in COVID-19 patients requiring hospital care, including younger adults who may be less likely to get vaccinated. Experts in the state worry that this may be “a preview of what is to come in other parts of the country that don’t have higher vaccination rates.”

    Just under 300 Americans are now dying from COVID-19 every day. A new analysis from the Associated Press confirms what many public health experts have expected: the vast majority of those deaths have occured in unvaccinated people. In May, only 150 out of over 18,000 COVID-19 deaths were in fully vaccinated Americans, the AP analysis found.

    This is why CDC Director Dr. Rochelle Walensky recently said that “nearly every death, especially among adults, due to COVID-19, is, at this point, entirely preventable.”

  • National numbers, June 13

    National numbers, June 13

    Vaccines are protecting many communities in the U.S., but those not yet vaccinated remain vulnerable. Posted on Twitter by Cyrus Shahpar.

    In the past week (June 5 through 11), the U.S. reported about 98,000 new cases, according to the CDC. This amounts to:

    • An average of 14,000 new cases each day
    • 30 total new cases for every 100,000 Americans
    • 6% fewer new cases than last week (May 29-June 4)

    Last week, America also saw:

    • 15,700 new COVID-19 patients admitted to hospitals (4.8 for every 100,000 people)
    • 2,400 new COVID-19 deaths (0.7 for every 100,000 people)
    • 69% of new cases in the country now Alpha-caused (as of June 5)
    • 6% of new cases now Delta-caused (as of June 5)
    • An average of 1.1 million vaccinations per day (per Bloomberg)

    After several weeks of sharp declines, new COVID-19 cases in the U.S. now appear to be in a plateau. There are a few factors likely influencing this shift.

    First, the nation’s public health agencies (and data reporting systems) are making up for the reporting lags caused by Memorial Day weekend. As we’ve discussed in the CDD before, holidays always lead to low case numbers immediately after, followed by slight bumps in the following week.

    Second, vaccinations are still progressing at a slow pace—and the unvaccinated remain vulnerable. Jurisdictions with fewer vaccinated adults are seeing more cases, more hospital admissions, and higher PCR test positivity, as Cyrus Shahpar, the White House COVID-19 Director, pointed out on Twitter this week.

    Third, the Delta variant (a.k.a. B.1.617.2, a.k.a. the variant first discovered in India) is rapidly spreading in the U.S.—making the unvaccinated even more vulnerable. (More on that later in the issue.)

    Still, the vaccines are protecting many of the most vulnerable, leading to continued low hospitalization and death numbers. Total confirmed and suspected COVID-19 hospitalizations for the country are below 20,000 for the first time since HHS started tracking this metric.

    Meanwhile, the U.S. is responding to global vaccination needs by pledging to send 500 million doses abroad by the end of 2022. Many of those doses won’t go out until next year, and the world does need faster distribution in order to prevent further variant evolution. But it’s a decent start.

  • Featured sources, June 6

    • COVID-19 Vaccine Incentives: So many companies are now offering rewards to inspire vaccinations in their customers and employees, it might be hard to keep track. Luckily, the federal government is keeping track for you; this page on Vaccines.gov provides a comprehensive list. (I am particularly excited about the United Airlines “Your Shot to Fly” Sweepstakes.) (H/T Chelsea Cirruzzo.)
    • Health Equity Data (from the CDC): The CDC has reorganized its COVID Data Tracker to include a new dashboard section specifically focused on health equity. The section includes demographic trends for cases, deaths, and vaccinations, with breakdowns for race and ethnicity, urban/rural status, disabilities, incarcerated people, and more.
    • Community health center vaccinations (from KFF): A new brief from the Kaiser Family Foundation demonstrates the value of community health centers in vaccinating vulnerable populations. From January through May, people of color made up nearly two-thirds of those receiving their first doses at these centers, KFF reports.
    • Dr. Fauci’s emails: This week, the federal government put out one of its most vital information releases of the pandemic thus far: a trove of Dr. Anthony Fauci’s emails. The emails, requested by journalists at BuzzFeed and the Washington Post via public records requests, cover hundreds of messages sent to or from the esteemed infectious disease expert in the early months of the pandemic. BuzzFeed has published about 3,200 emails in raw, unfiltered form, and you can read recaps of the emails at both BuzzFeed and WaPo.

  • National numbers, June 6

    National numbers, June 6

    In the past week (May 29 through June 4), the U.S. reported about 100,000 new cases, according to the CDC. This amounts to:

    • An average of 14,000 new cases each day
    • 31 total new cases for every 100,000 Americans
    • 35% fewer new cases than last week (May 22-28)

    Last week, America also saw:

    • 18,000 new COVID-19 patients admitted to hospitals (5.5 for every 100,000 people)
    • 2,300 new COVID-19 deaths (0.7 for every 100,000 people)
    • 70% of new cases in the country now B.1.1.7-caused (as of May 8)
    • An average of 1 million vaccinations per day (per Bloomberg)

    Cases continued to fall this week, with a seven-day average now under 20,000 new cases a day. This is basically the lowest number we’ve seen in the U.S. since spring 2020—though it’s important to note that the U.S. was doing minimal testing at that time, so the true case numbers in March 2020 were likely much higher than what was reported.

    Also, last weekend’s holiday—like past holidays—likely resulted in fewer cases being reported early this week. Many testing sites and public health departments close for holidays, and it’s hard to imagine who might want to go get a nose swab on Memorial Day. Fewer than 10,000 new cases were reported last Monday and Tuesday, according to the CDC, followed by double that number each day for the rest of the week.

    Despite such low overall case numbers, infection rates remain high for the unvaccinated. A recent Washington Post analysis adjusted COVID-19 infection rates by subtracting vaccinated residents from state populations. In Washington state, for example, the case rate among unvaccinated residents is “as high as it was in late January.”

    Also, as policy researcher Julia Raifman pointed out on Twitter, fewer than half of the lowest income workers with kids are vaccinated—likely because of vaccine accessibility issues. Workers in this income bracket are also more likely to report that they had to miss work due to a COVID-19 infection, compared to higher-income Americans. 

    Nationwide, about half of the U.S. population has had at least one dose, including 63% of adults and 86% of seniors. The rate of vaccinations has slowed this past week (now only one million doses administered a day)—though this may in part be a holiday reporting lag as well. Biden’s administration continues throwing incentives at the problem in the hopes of meeting his July 4 goal.

    Testing numbers have also fallen in recent weeks, likely because vaccinated Americans have few reasons to need a test. Data watcher (and former COVID Tracking Project volunteer) Conor Kelly noted that we’re averaging under 1 million tests a day for the first time since fall 2020. At the same time, though, the national positivity rate for PCR tests is lower than ever—it hit 2.2% on June 1.

    Things are looking pretty good here in the U.S., though some experts say a summer or fall surge could still be possible if we relax restrictions too much. Other countries without vaccine access are not nearly so lucky.

  • Featured sources, May 30

    • Cases and deaths among healthcare workers: A new addition to the CDC COVID Data Tracker this week: a tab reporting cases and deaths in doctors, nurses, and other healthcare personnel. The CDC is reporting both totals and new cases/deaths by week, though the data here likely represent only a fraction of the true counts of healthcare workers infected during the pandemic. Notably, the total death toll is only about 1,600—less than half of the healthcare worker deaths reported by The Guardian and KHN’s “Lost on the Frontline” project.
    • Health Equity Tracker: When the COVID Tracking Project (including the COVID Racial Data Tracker) ceased data collection in March, it became much more difficult to compare COVID-19 case counts by race and ethnicity across states. A new project from the Morehouse School of Medicine fills that gap—and does much more. The Tracker incorporates data from the CDC, the Census, and other sources to provide comprehensive information on which communities have been hardest hit by the COVID-19 pandemic. Read more about it in this STAT article.
    • Coronavirus variant lineages: I came across this source a few days ago while researching variant lineages, prompted by a question on Twitter. Phylogenetic Assignment of Named Global Outbreak Lineages (or PANGO Lineages, for short) is a software tool developed by a lab in the U.K. that allows users to submit and analyze coronavirus sequences. The specific page I’ve linked here provides a comprehensive, searchable list of all the coronavirus variants that scientists have identified. Very useful if you need to search up an older or less-well-known variant.
    • Unemployment Insurance Data Explorer: This tool from progressive think tank The Century Foundation allows users to explore, visualize, and download data on unemployment insurance distributed during the pandemic. The tool includes data broken out by state and goes back in time to 1971—valuable for historical analysis.

  • Featured sources, May 23

    • GAO analysis of COVID-19 in nursing homes: The Government Accountability Office, an organization that does research and audits on behalf of Congress, has a new report out this week on the devastating COVID-19 outbreaks that took place in nursing homes. The GAO researched about 13,000 facilities, using CDC data from May 2020 to January 2021. 94% of the nursing homes in the study faced at least one COVID-19 outbreak, with the majority of outbreaks (85%) lasting five weeks or more.
    • Johns Hopkins Pandemic Data Initiative: The Johns Hopkins Coronavirus Resource Center is one of the most widely-cited sources of COVID-19 data, providing detailed and up-to-date information for both the U.S. and the world. But the resource center’s scientists “have struggled to work with COVID-19 data that is inconsistent, incomplete, and insufficient,” writes JHU data lead Beth Blauer in a blog post. A new section of the resource center will explore data inconsistencies and highlight possible solutions.
    • Excess deaths by U.S. county: Excess deaths, or those deaths that occur above a region’s past baseline, are a common metric for examining the true toll of COVID-19. In addition to reporting excess deaths by U.S. states and demographic categories, the CDC’s National Center for Health Statistics (NCHS) also reports this information by county. A group of researchers (Stokes et al.) recently analyzed these county-level data and found that U.S. COVID-19 deaths may be underestimated by about 20%; their findings were published this week in PLOS Medicine.
    • Vaccine consent laws by state: As the Pfizer vaccine is now available to children ages 12 to 15, a lot of teenagers out there may want to know if they can get vaccinated without parental permission. The site VaxTeen provides these kids with information on the consent laws in every state, as well as a guide for talking to your parents about vaccines and other resources. (H/T Robin Lloyd.)

  • National numbers, May 23

    National numbers, May 23

    In the past week (May 15 through 21), the U.S. reported about 195,000 new cases, according to the CDC. This amounts to:

    • An average of 28,000 new cases each day
    • 59 total new cases for every 100,000 Americans
    • 19% fewer new cases than last week (May 8-14)
    Nationwide COVID-19 metrics as of May 21, sourcing data from the CDC and HHS. Posted on Twitter by Conor Kelly.

    Last week, America also saw:

    • 24,000 new COVID-19 patients admitted to hospitals (7.3 for every 100,000 people)
    • 3,500 new COVID-19 deaths (1.1 for every 100,000 people)
    • 66% of new cases in the country now B.1.1.7-caused (as of April 24)
    • An average of 1.9 million vaccinations per day (per Bloomberg)

    I’m starting to feel like a broken record in these updates—but in a good way. U.S. cases continue falling, with our seven-day average now at a level not seen since May 2020.

    Trends in COVID-19 deaths usually echo trends in cases with about a month’s delay. After several weeks of falling cases, the U.S. is now seeing fewer than 500 new COVID-19 deaths a day. This week, 24 states averaged fewer than one new death a day for every 100,000 residents.

    These states include California, Arizona, the Dakotas, and other states that made headlines in past months for their concerning outbreaks—yet another indication that the vaccines are working. Only three states (Michigan, Pennsylvania, and Alaska) saw over two deaths a day for every 100,000 people.

    Vaccinations continue at the slow, steady, 1.5-to-2 million a day pace we’ve seen for the past couple of weeks. About 61% of adults have had at least one dose, and almost half of adults are now fully vaccinated. Meanwhile, many kids in the 12 to 15 age range are taking advantage of their new eligibility: about 1.6 million have received at least one dose so far. 16% of the first doses administered in the last two weeks went to this population.

    Variant numbers haven’t been updated since last week. B.1.1.7 continues to be the dominant variant in the U.S., and other concerning variants (such as B.1.617 from India) continue to spread. But accumulating evidence suggests that the vaccines work well against all variants. Just yesterday, researchers in the U.K. reported 81% effectiveness against B.1.617, according to the Financial Times.

  • National numbers, May 16

    National numbers, May 16

    In the past week (May 8 through 14), the U.S. reported about 248,000 new cases, according to the CDC. This amounts to:

    • An average of 35,000 new cases each day
    • 76 total new cases for every 100,000 Americans
    • 24% fewer new cases than last week (May 1-7)
    Nationwide COVID-19 metrics as of May 14, sourcing data from the CDC and HHS. Posted on Twitter by Conor Kelly.

    Last week, America also saw:

    • 28,300 new COVID-19 patients admitted to hospitals (8.6 for every 100,000 people)
    • 4,100 new COVID-19 deaths (1.3 for every 100,000 people)
    • 66% of new cases in the country now B.1.1.7-caused (as of April 24)
    • An average of 1.9 million vaccinations per day (per Bloomberg)

    COVID-19 case numbers continue to drop this week: the current U.S. average is about 35,000 new cases a day, a 50% drop from where we were a month ago. (We saw 70,000 new daily cases in the week ending April 16.) Daily cases have not been this low since early September, between the summer and fall/winter surges.

    Hospitalizations are also down: about 4,000 new COVID-19 patients were admitted each day this week, compared to about 5,500 a month ago. While this drop is not as dramatic as the drop in cases, it may actually be an indicator that hospitals are admitting and caring for patients with less severe illness—who may not have been admitted in, say, January. Regardless, the more beds a hospital has to spare, the better care it can provide. All states have inpatient bed occupancy rates at 80% or below except for Massachusetss and Rhode Island.

    The CDC updated its variant data this week with figures as of April 24. B.1.1.7 is causing two out of every three COVID-19 cases in the country, according to these data. After B.1.1.7, the most prevalent variant is B.1.526 (14%); this variant, first discovered in NYC, is still classified as a “variant of interest,” so state-by-state data are not available. P.1 also gaining ground: it now causes 5% of U.S. cases, with much higher values in some states (20% of Illinois cases, 11% of Massachusetts cases).

    Though these variants may be worrying, our continued case drop shows that the vaccines are beating them—more on that later. 37% of the overall U.S. population is now fully vaccinated, and 47% has had at least one dose. 

    But some states are doing much better than others. Only 26% of Mississippi’s population is fully vaccinated, compared to almost 50% in Connecticut and Maine. Racial inequities persist as well: Bloomberg reports that only 10 states have vaccinated at least a third of their Black and Hispanic populations, while over 30 states have vaccinated this share of their White and Asian populations.

    As the pace of vaccinations continues to slow (1.9 million per day, as of yesterday), these disparities must be addressed.