Category: Uncategorized

  • National numbers, October 31

    National numbers, October 31

    Nationwide COVID-19 hospitalizations have fallen below 50,000 for the first time since July. Chart via Conor Kelly, posted on Twitter on October 30.

    In the past week (October 23 through 29), the U.S. reported about 480,000 new cases, according to the CDC.* This amounts to:

    • An average of 69,000 new cases each day
    • 147 total new cases for every 100,000 Americans
    • 7% fewer new cases than last week (October 16-22)

    Last week, America also saw:

    • 38,000 new COVID-19 patients admitted to hospitals (12 for every 100,000 people)
    • 8,000 new COVID-19 deaths (2.4 for every 100,000 people)
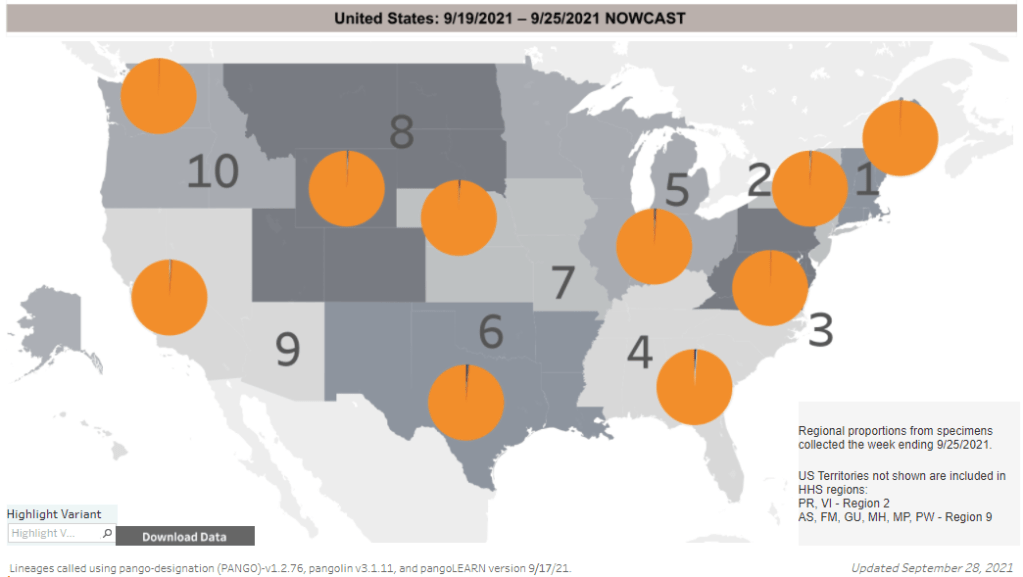
    • 100% of new cases are Delta-caused (as of October 23)
    • An average of 900,000 vaccinations per day (including booster shots; per Bloomberg)

    *Note: we are back to our usual schedule (utilizing data as of Friday) after last week’s hiccup.

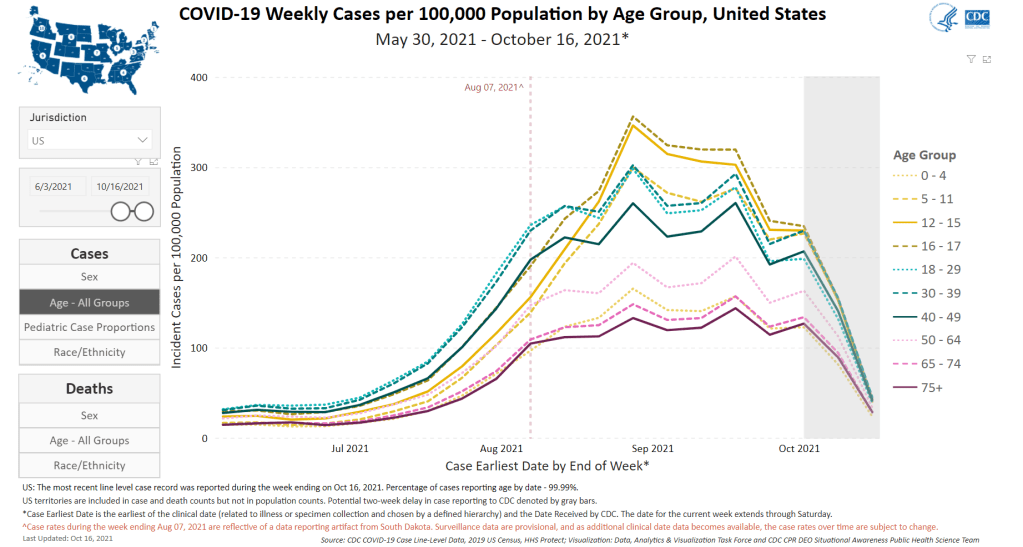
    Nationally, new COVID-19 cases continue to drop—though the decrease is slowing a bit from previous weeks. The number of new cases fell by about 7% this week, after falling by about 12% for the two weeks prior.

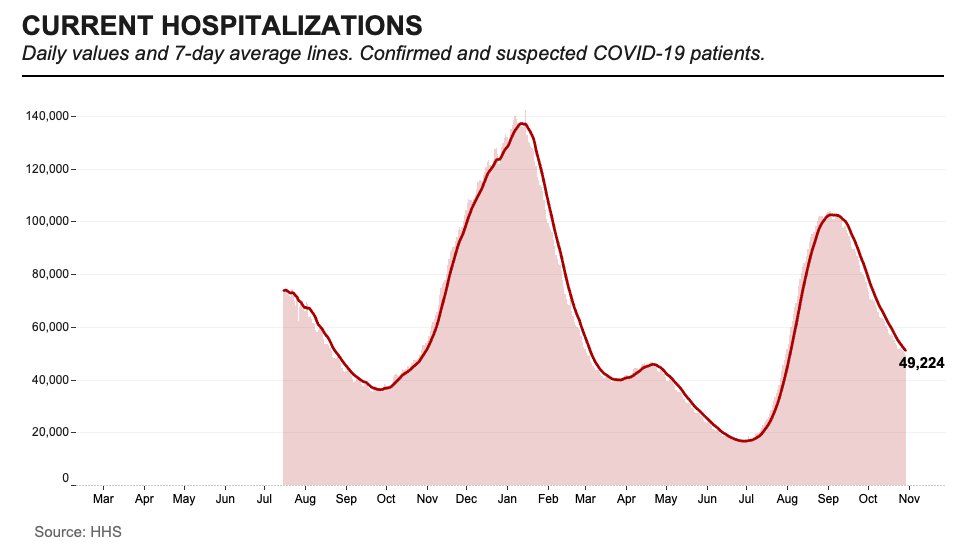
    Still, a downward trend is a positive trend. The U.S. now has fewer than 50,000 COVID-19 patients in hospitals nationwide, for the first time since July—before the Delta surge started. The number of new deaths is also slowly falling, though the country is still seeing over 1,000 people die from COVID-19 each day.

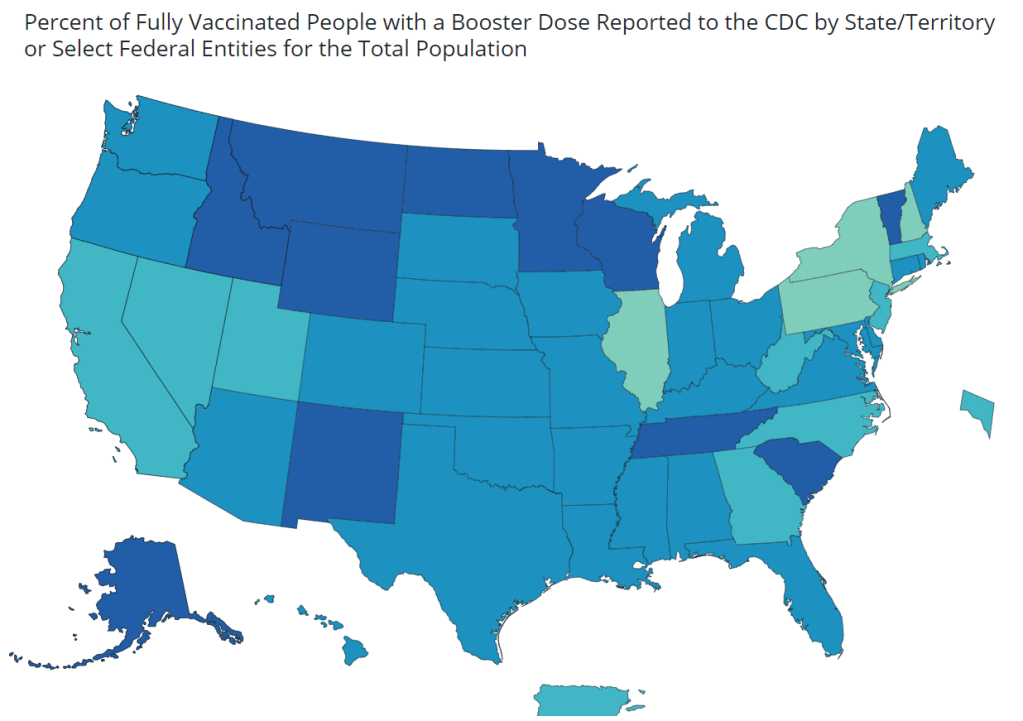
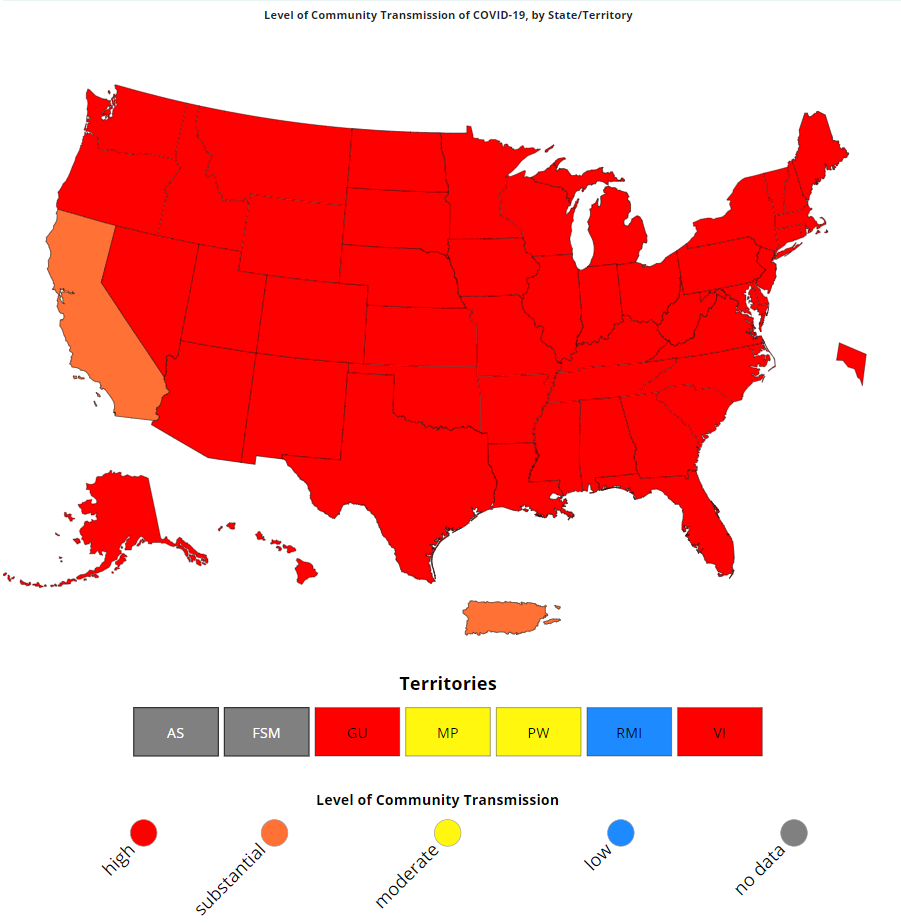
    The country’s current hotspots continue to be the same group of colder-weather states I called out last week: Alaska, Montana, Wyoming, North Dakota, and Idaho. All five have recorded over 400 new cases for every 100,000 people in the last week, per the latest Community Profile Report, with Alaska at the top (657 cases per 100,000).

    It’s hard to say whether these high numbers are a product of cold weather driving people inside, low vaccination rates—all five states have about half or less of their populations fully vaccinated—or both. Continuing trends in these states may provide an indicator of how other parts of the country may fare this winter.

    Meanwhile, more states are seeing their COVID-19 numbers drop below “high transmission” levels, including Louisiana, D.C., Georgia, Maryland, Texas, and New Jersey. In New Orleans, a Delta epicenter in the summer, case numbers are low enough that the mayor has loosened the city’s mask mandate and other COVID-19 restrictions.

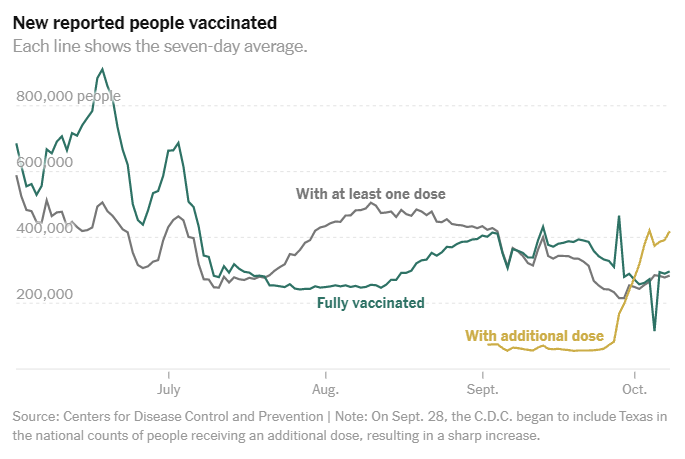
    Vaccinations are up nationally, but booster shots—not previously unvaccinated Americans getting their first doses—are comprising the bulk of the trend. Yesterday, out of 1.6 million doses reported by the CDC, a record one million were booster shots. Just 361,000 were new first doses.

  • Featured sources, October 24

    • More booster shot data from the CDC: The CDC has added more data on additional vaccine doses to its COVID-19 dashboard. Specifically, we can now analyze booster shots by state: raw numbers, share of the fully vaccinated population with a booster, and limited age data (18+, 50+, 65+). If anyone from the CDC is reading this: I would love to see some race/ethnicity data next!
    • Racial and ethnic disparities in COVID-19 hospitalization: A new CDC study published this week in JAMA Open Network presents analysis of data from COVID-NET, the national agency’s surveillance system for COVID-19 hospitalizations. The study, like other research on this topic, found that non-white Americans were far more likely to be hospitalized with COVID-19 or die from the disease in the first year of the pandemic than their white neighbors. Supplemental tables for the study include breakdowns of COVID-19 hospitalizations by different demographic groups, by underlying medical conditions, and over time.
    • The COVID States Project: In this polling project, researchers surveyed people in all 50 U.S. states to ask whether they approve of the president and of their governors. The survey is jointly run by researchers at Harvard, Northeastern, Northwestern, and Rutgers Universities. This latest report, released in October, includes executive approval data stratified by political party and vaccination status.
    • COVID-19, compared to other leading causes of death: COVID-19 was the number two cause of death in the U.S. in September 2021—after heart disease—according to this report from the Peterson Center on Healthcare and the Kaiser Family Foundation. The report compares COVID-19 to other top causes of death in the country, including data over time and by age group.

  • National numbers, October 24

    National numbers, October 24

    As of October 22, the CDC is reporting booster doses administered by state. Darker blue corresponds to a higher share of the fully vaccinated population in the state that has received a booster; lighter blue/green corresponds to a lower share of the population.

    In the past week (October 15 through 21), the U.S. reported about 510,000 new cases, according to the CDC.* This amounts to:

    • An average of 73,000 new cases each day
    • 156 total new cases for every 100,000 Americans
    • 14% fewer new cases than last week (October 9-15)

    Last week, America also saw:

    • 42,000 new COVID-19 patients admitted to hospitals (13 for every 100,000 people)
    • 9,000 new COVID-19 deaths (2.7 for every 100,000 people)
    • 100% of new cases are Delta-caused (as of October 16)
    • An average of 800,000 vaccinations per day (including booster shots; per Bloomberg)

    *Note: This week’s update relies on data as of Thursday, October 21. I usually use Friday data (via the COVID Data Tracker Weekly Review), but was unable to do so this week because I headed offline for a hiking trip before the Friday data were posted. We’ll be back to the usual sourcing next week!

    Nationwide, COVID-19 cases continue to go down—slowly but surely. We’re now seeing roughly 70,000 new cases a day, comparable to case counts when the Delta surge started to really pick up at the end of July. It’s worth noting, though, that this is still higher than the peaks of both the spring and summer 2020 surges.

    At the state level, more parts of the country are approaching lower coronavirus transmission levels. As of Thursday, eight jurisdictions have dropped below 100 new cases per 100,000 people in the past week. From lowest case counts to highest, these are: California, Hawaii, Florida, Louisiana, Washington D.C., New Jersey, Maryland, and Mississippi.

    Alaska, Montana, and Wyoming remain the states with the highest COVID-19 rates, followed by Idaho and North Dakota. These states are all in northern parts of the U.S.—and their recent case increases have coincided with cold weather—the Washington Post and other outlets have noted. Other states may see similar COVID-19 upticks as it becomes too cold to socialize outdoors.

    Booster shots continue to inflate vaccination numbers, as these third doses comprise between one-third and one-half of doses administered in the U.S. each day. Over 11 million people have already received a booster dose—more than the total doses administered in a number of low-income countries.

  • National numbers, October 17

    National numbers, October 17

    Cases are going down for all age groups, but children continue to have high COVID-19 rates. Chart from the CDC.

    In the past week (October 9 through 15), the U.S. reported about 600,000 new cases, according to the CDC. This amounts to:

    • An average of 85,000 new cases each day
    • 180 total new cases for every 100,000 Americans
    • 13% fewer new cases than last week (October 2-8)

    Last week, America also saw:

    • 47,000 new COVID-19 patients admitted to hospitals (14 for every 100,000 people)
    • 9,000 new COVID-19 deaths (2.7 for every 100,000 people)
    • 100% of new cases are Delta-caused (as of October 9)
    • An average of 700,000 vaccinations per day (including booster shots; per Bloomberg)

    COVID-19 cases continue to drop across the U.S., slowly but surely. We’re now reporting about 85,000 new cases a day, down from 97,000 new cases a day last week, down from 108,000 new cases a day the week before last.

    Hospitalizations and deaths are falling nationwide as well. About 57,000 Americans are currently hospitalized with COVID-19, down 12% from last week. And about 1,200 people are dying from the disease each day, the vast majority of them unvaccinated.

    Still, most states continue to experience “high transmission,” per the CDC’s categories. Hawaii, Florida, and Alabama, three states that saw intense Delta surges in recent months, have now joined California and Connecticut in crossing the threshold to “substantial transmission”—with under 100 new cases for every 100,000 people in the past week, according to the latest Community Profile Report.

    Alaska, Montana, and Wyoming remain the most intense hotspots, with over 500 new cases for every 100,000 people in the past week. In Alaska, hospitals are still in crisis mode, with doctors forced to choose which patients they must prioritize for care. All three states are seeing case rates decrease, though, indicating that they may be past the peak of their surges.

    While cases among children are trending slightly downward as well, the number remains much higher than at other points in the pandemic. In the week ending October 7, cases among children represented about one in four COVID-19 cases reported in the U.S., according to the American Academy of Pediatrics.

    Vaccinations continue to be dominated by booster shots, with boosters making up between one-third and half of the doses administered each day this week. Already, 14% of U.S. seniors have received a booster dose, according to the CDC. 5% of the US population overall has received a booster dose. These numbers will only increase as Moderna and J&J boosters are authorized, following FDA advisory committee recommendations. (More on that later in today’s issue.)

  • Featured sources, October 10

    • COVID-19 Vaccine Effectiveness (CDC): The CDC has added a new page to its COVID Data Tracker, focused on visualizing how well the vaccines work. This page includes data from several ongoing studies used by the CDC to monitor vaccine effectiveness: one tracks COVID-19 infection in long-term care facility residents, another tracks hospitalization in veterans, and so on. “This is not a comprehensive representation of all data sets, but the populations being followed are large and well described (if limited),” said science writer Katherine Wu, sharing the new page on Twitter.
    • COVID-19-Associated Orphanhood in the U.S.: Over 140,000 American children lost a parent or a caregiver during the pandemic, according to a new study from the CDC, Imperial College London, and other collaborators. This study follows another study from Imperial College London that took a global focus (which I featured in the July 25 issue); this new paper includes data broken out by state and by race and ethnicity. Black children were more than twice as likely to lose a parent or caregiver as white children, and Native American children were more than four times as likely.

  • National numbers, October 10

    National numbers, October 10

    The U.S. is now administering about one million vaccine doses a day, largely thanks to eligible Americans receiving their booster shots. Chart via the New York Times.

    In the past week (October 2 through 8), the U.S. reported about 670,000 new cases, according to the CDC. This amounts to:

    • An average of 95,000 new cases each day
    • 204 total new cases for every 100,000 Americans
    • 12% fewer new cases than last week (September 25-October 1)

    Last week, America also saw:

    • 52,000 new COVID-19 patients admitted to hospitals (16 for every 100,000 people)
    • 10,000 new COVID-19 deaths (3.1 for every 100,000 people)
    • 100% of new cases are Delta-caused (as of October 2)
    • An average of one million vaccinations per day (including booster shots; per Bloomberg)

    At the national level, COVID-19 cases continue to go down. The U.S. is now seeing fewer than 100,000 new cases a day, and about 62,000 Americans are currently hospitalized with COVID-19—a 14% drop from last week. 

    It may feel like the Delta surge is now “over,” but case rates are still incredibly high across the country compared to what we saw earlier this summer. California and Connecticut continue to be the only two states with “substantial” transmission, according to the CDC. Every other state has “high” transmission, meaning over 100 new cases for every 100,000 people in the past week.

    Alaska remains the country’s biggest hotspot, with over 800 new cases for every 100,000 people in the past week, per the latest Community Profile Report. Case numbers have dropped a bit since last week—when Alaska hit the highest per-capita COVID-19 case rate of any state during the entire pandemic thus far—but the state’s hospitals are still incredibly overwhelmed. Doctors are rationing care, unable to send most patients on hours-long trips to Washington state.

    Other Midwestern states continue to face Delta surges, including Montana, North Dakota, Wyoming, West Virginia, and Idaho. All five states have COVID-19 case rates over 500 new cases per 100,000 people in the past week.

    Vaccination numbers are going up nationwide, with over one million doses administered each day in the past week. But there’s a key caveat here: many of these doses are booster shots. On Saturday, for example, the CDC reported 1.15 million new doses—including over 500,000 booster shots. The number of people receiving their first doses is the lowest it’s been in months.

  • National numbers, October 3

    National numbers, October 3

    Delta dominates throughout the U.S. The CDC’s variant map has looked like this for a few weeks now.

    In the past week (September 25 through October 1), the U.S. reported about 750,000 new cases, according to the CDC. This amounts to:

    • An average of 106,000 new cases each day
    • 227 total new cases for every 100,000 Americans
    • 13% fewer new cases than last week (September 18-24)

    Last week, America also saw:

    • 58,000 new COVID-19 patients admitted to hospitals (18 for every 100,000 people)
    • 10,000 new COVID-19 deaths (3.2 for every 100,000 people)
    • 99% of new cases are Delta-caused (as of September 25)
    • An average of 800,000 vaccinations per day (including booster shots; per Bloomberg)

    COVID-19 cases continue to go down in the U.S.; by next week, the country will likely be back under 100,000 new cases a day. Hospitalizations are also dropping: this week, the number of COVID-19 patients currently hospitalized across the U.S. dropped about 12%, to 72,000.

    But over 10,000 COVID-19 deaths were reported this week, for the third week in a row. Many of these deaths likely occurred earlier in the Delta surge, but showed up in the numbers more recently due to reporting lags.

    The U.S. passed 700,000 COVID-19 deaths this week, many of them unvaccinated. To quote Ed Yong’s latest feature: “Every adult in the U.S. has been eligible for vaccines since mid-April; in that time, more Americans have died of COVID-19 per capita than people in Germany, Canada, Rwanda, Vietnam, or more than 130 other countries did in the pre-vaccine era.”

    Alaska is now the number one COVID-19 hotspot in the country. According to Friday’s Community Profile Report, the state saw almost 1,200 new COVID-19 cases for every 100,000 residents in the week ending September 29. That’s twelve times higher than the CDC’s threshold for “high transmission,” 100 new cases for every 100,000 people in a week.

    Hospitals in Alaska are completely overwhelmed. The state currently has about 40% more COVID-19 patients in hospitals than it did at the peak of the winter surge. In a recent video posted to Facebook and shared with local leaders, a nurse at Fairbanks Medical Hospital describes the dire process of dying from COVID-19—something that has become incredibly common in her workplace. About 50% of Alaska’s population is fully vaccinated.

    On the other side of the spectrum, Connecticut has joined California in the “substantial transmission” range. Connecticut saw 98 new cases for every 100,000 people in the past week, while California saw 73 new cases for every 100,000.

    Over 99% of new cases in the U.S. are caused by Delta, as has been the case for over a month. Delta has solidly outcompeted the Mu variant, and remains dominant across the country. Will this variant peter out as the surge slowly wanes, or will Delta evolve into another more-dangerous variant? The CDC’s current data makes it hard to look for signals.

  • Survey: Looking forward to 2022

    Survey: Looking forward to 2022

    I recently wrapped up a big project over here at the COVID-19 Data Dispatch. (In case you missed it: I profiled five school communities that had successful reopenings in 2020-2021. Check out the project here!) Now that it’s done, I’ve been doing a bit of reflecting on the next steps for this publication—specifically, what I’d like it to look like one year from now.  

    My mission here is to provide you, my readers, with the information you need to understand what’s going on with COVID-19 in your community. I’m committed to covering the pandemic, for as long as it remains the number one health and science story in America.

    But what happens when COVID-19 is no longer the number one health and science story in America? I started to consider this question early in summer 2021, before Delta came roaring in—and made many people realize that we were still pretty far away from the “end of the pandemic.” Delta allowed me to procrastinate, basically. But this is the kind of question one can only put off for so long, so here I am, considering it again.

    As I think about the COVID-19 Data Dispatch’s future, I’m thinking about everything that this country needs to do in preparation for the next public health crisis. Because there will be a next public health crisis—in fact, climate change is already producing a never-ending stream of crises all around us. What information do we need, and what data-driven stories can we tell, to get ready? How can I serve my fellow journalists, scientists, health experts, and the other people in my community?

    To help me figure this out, I’ve put together a survey for you, dear readers! It should be easy to fill out: 10 questions, mostly multiple choice. It can be done on a computer or a phone, and shouldn’t take you more than five minutes.

    //embed.typeform.com/next/embed.js

    If the widget above doesn’t load, go to this link to fill out the survey: https://form.typeform.com/to/YOlZ2zB4

  • National numbers, September 26

    National numbers, September 26

    California dropped to “substantial” transmission this week, while other states remained in “high” transmission.

    In the past week (September 18 through 24), the U.S. reported about 850,000 new cases, according to the CDC. This amounts to:

    • An average of 122,000 new cases each day
    • 259 total new cases for every 100,000 Americans
    • 17% fewer new cases than last week (September 11-17)

    Last week, America also saw:

    • 67,000 new COVID-19 patients admitted to hospitals (21 for every 100,000 people)
    • 11,000 new COVID-19 deaths (3.3 for every 100,000 people)
    • 99% of new cases are Delta-caused (as of September 18)
    • An average of 700,000 vaccinations per day (per Bloomberg)

    Following the Labor Day reporting blips of the past two weeks, COVID-19 cases are now clearly trending down in the U.S. The daily new case average is close to what we saw in early August, at the start of the Delta surge.

    The U.S. can’t let its guard down yet, though. Almost every state still reported over 100 new cases for every 100,000 people in the past week, putting the vast majority of the country into a high coronavirus transmission zone, per the CDC’s categories. The only state to drop below this “high transmission” threshold is California, which reported 86 new cases per 100,000 in the week ending September 23.

    Alaska, West Virginia, Wyoming, and Montana are all far past that “high transmission” threshold, at over 600 new cases per 100,000 in the past week. Alaska appears to be the nation’s newest Delta hotspot. The state reported a record 1,735 COVID-19 cases on Friday, though some of those cases were part of a reporting backlog (meaning they occurred earlier).

    Nationwide, hospitalizations are also continuing to come down. The country recorded fewer than 10,000 new patients a day last week, for the first time since early August. But the current numbers are still far higher than what we saw in June and early July.

    Deaths—the slowest-moving pandemic metric—continue rising, with about 11,000 new deaths a day. It bears repeating: the vast majority of these deaths occur in unvaccinated Americans. The U.S. has now passed 675,000 deaths, meaning that COVID-19 has killed more Americans than the 1918 Spanish flu pandemic did over a century ago.

    Despite the continued dangers of being unvaccinated, dose numbers are now also dropping in the U.S. After a couple of weeks approaching one million doses a day, we’re now back down at 700,000 doses a day, per Bloomberg’s dashboard. And the upcoming booster shot rollout is certain to confuse these data; already, 2.4 million Americans have received an additional dose, per the CDC.

  • Featured sources, September 19

    • COVID Behaviors Dashboard from Johns Hopkins: John Hopkins University maintains one of the oldest and best-known COVID-19 dashboards of the pandemic. The team recently expanded its data offerings with a new dashboard focused on pandemic attitudes and practices around the world. This dashboard draws from surveys conducted in over 100 countries, in collaboration with the WHO; read more about it here.
    • COVID-19 K-12 School Testing Impact Estimator: What COVID-19 testing strategy would make the most sense for your local K-12 school? This dashboard, by the Rockefeller Foundation and Mathematica (the data research organization), is designed to help stakeholders find out. Simply plug in the school’s characteristics and COVID-19 safety goals, and the dashboard will tell you how different testing strategies may measure up.
    • Vaccine hesitancy roundup from the Journalist’s Resource: This resource page includes a wealth of data and insights on vaccine hesitancy in the U.S., drawing from a variety of surveys and research papers on the topic. As of early September, author Naseem Miller writes, the PubMed research database included over 750 studies on COVID-19 vaccine hesitancy, signifying growing academic interest in this topic.
    • Hospital challenges to public health reporting: A new report from the National Coordinator for Health Information Technology explores the challenges that non-government hospitals have faced in electronically exchanging information with public health agencies. One major finding: in both 2018 and 2019, half of all hospitals lacked the capacity for this data exchange. No wonder electronic reporting has been such a challenge during the pandemic.
    • NIH Long COVID initiative revs up: This isn’t an actual data source, more of an update: the National Institutes of Health (NIH)’s RECOVER Initiative to study Long COVID awarded a major research grant this week. About $470 million goes to New York University’s Langone Medical Center, which will serve as a national hub for Long COVID research and award sub-grants to other institutions. The NIH’s RECOVER website currently reports that between 10% and 30% of people infected with the coronavirus will go on to develop Long COVID; hopefully research at NYU and elsewhere will lead to some more precise numbers.