Category: Testing

  • The U.S.’s flu and RSV surveillance is insufficient for tracking this fall’s outbreaks

    The U.S.’s flu and RSV surveillance is insufficient for tracking this fall’s outbreaks

    The CDC’s FluView dashboard does not provide precise case numbers, only an approximation of “activity level.”

    I recently received a question from a reader, asking how to follow both COVID-19 and the flu in the county where she lives. For COVID-19, county-level data sources aren’t too hard to find: the CDC still provides some clinical data—though case numbers are now updated weekly, instead of daily—and many counties have wastewater surveillance available. (See last week’s post for more details.)

    But following flu transmission is much harder: there’s no county-level tracking of this virus. The same thing goes for respiratory syncytial virus (RSV), a virus currently sending record cases to children’s hospitals across the country. There are a few data sources available, which I’ll list later in this post, though nothing as comprehensive as what we’ve come to expect for COVID-19.

    As I’ve previously written, the COVID-19 pandemic inspired nationwide disease surveillance at a level the U.S. has never seen before. The healthcare and public health systems had not previously attempted to count up every case of a widely-spreading virus and share that information back to the public in close-to-real-time.

    It’s unlikely that flu, RSV, and other diseases will get the same resources as COVID-19 did for intensive tracking—at least not in the near future. But the scale of data we’ve had during the pandemic reveals that our current surveillance for these diseases is pretty inadequate, even for such basic purposes as giving hospitals advanced warning about new surges. 

    Insufficient RSV data

    A recent CNN story by Deidre McPhillips and Jacqueline Howard explains how data gaps have hindered preparation for the current RSV surge. The reporters explain that the CDC’s RSV data are “based on voluntary reporting from a few dozen labs that represent about a tenth of the population.” The CDC uses these reports to provide weekly estimates about RSV cases, though recent data tend to be incomplete due to reporting delays.

    Here’s a helpful quote from the story (though I recommend reading the whole piece):

    “For hospitals [using CDC data], it’s a little like looking through the rearview mirror. They’ve already begun to experience that uptick in cases themselves before it’s noticeable in the federal data,” said Nancy Foster, vice president for quality and patient safety with the American Hospital Association.

    “We’re talking about data that are collected inside hospitals, transmitted through a data trail to get to the federal government, analyzed there and then fed back to hospitals.”

    In other words, it’s not surprising that we saw plenty of stories about higher-than-normal RSV cases in children’s hospitals before national data actually picked up the surge. For more details on why RSV is spreading this fall and how it’s impacting children’s hospitals, I recommend this piece by Jonathan Lambert at Grid.

    Insufficient flu data

    Meanwhile, this year’s flu season is clearly starting earlier than normal; but current data aren’t able to tell us how severe the season might get or who, exactly, is being hit the hardest. According to the CDC’s flu surveillance report for this week, the agency estimates that the U.S. has seen “at least 880,000 flu illnesses, 6,900 hospitalizations, and 360 deaths from flu” so far this fall.

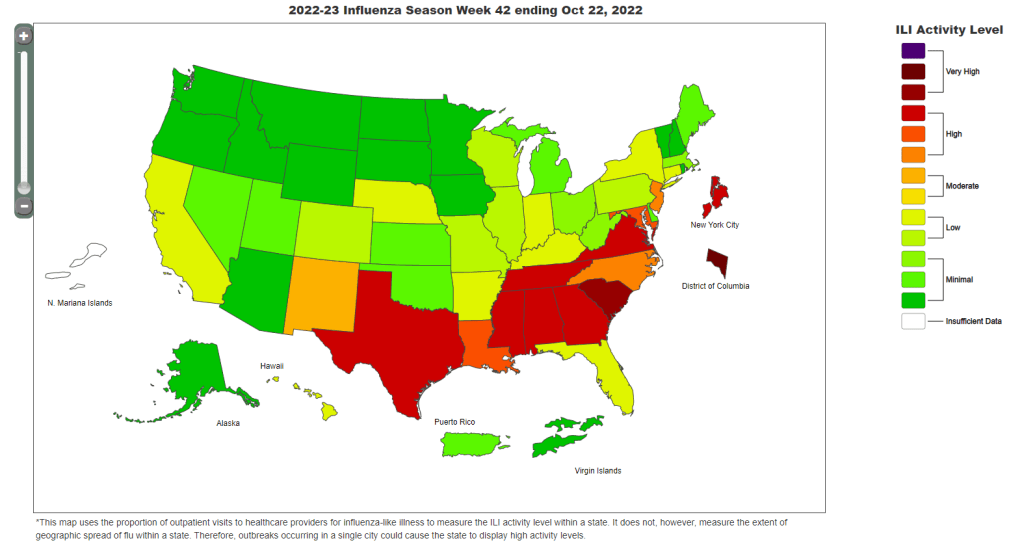
    The CDC’s estimates come from networks of testing labs, hospitals, and outpatient healthcare providers that participate in the agency’s flu surveillance networks. National flu data tend to be imprecise estimates, clearly labeled as “preliminary” by the CDC, while state-by-state data are estimates reported with delays. Note, for example, that the CDC’s map of “influenza-like-activity” by state and by metro area provides only general categories of activity (ranging from “minimal” to “very high”) rather than actual case numbers.

    The flu data we have so far aren’t sufficient for making predictions about how the rest of this fall and winter will go, explains STAT’s Helen Branswell in a recent story. “The virus is maddeningly unpredictable,” she writes. U.S. experts often look to the flu season in the Southern Hemisphere, which precedes ours, for clues, but this can be unreliable (just as the U.S. shouldn’t rely on other countries for all its vaccine effectiveness data).

    For both flu and RSV, one major problem with our surveillance methods is that our systems overly rely on healthcare centers. When public health agencies have to wait for hospitals and clinics to report cases of these viruses before starting to analyze data, they miss the opportunity to warn healthcare providers at the very beginning of a surge—and give them time to prepare.

    In the future, expanding non-clinical surveillance methods like wastewater and population surveys to these diseases would provide more data, more quickly; both for healthcare providers and for the general public. (I provided some more specific ideas here.)

    Existing sources

    With all the above caveats in mind, here are a few sources you can look at to track flu and RSV:

    • CDC’s weekly flu surveillance report: This page is updated once a week with national estimates of flu activity, hospitalizations, flu virus variants, and more. Data tend to be preliminary.
    • CDC’s FluView dashboard: Information from the CDC’s flu surveillance system also appears on this dashboard in a more interactive format; for example, you can see how flu activity by state has changed over time.
    • CDC’s RSV trends report: Similar to its flu reports, the CDC provides weekly updates of estimated RSV tests and cases, including national, regional, and state-by-state trends.
    • Walgreens flu index: Walgreens tracks prescriptions for antiviral medications at its pharmacies as a proxy for flu activity, by state and for select metro areas. For more information on the index, see this press release.
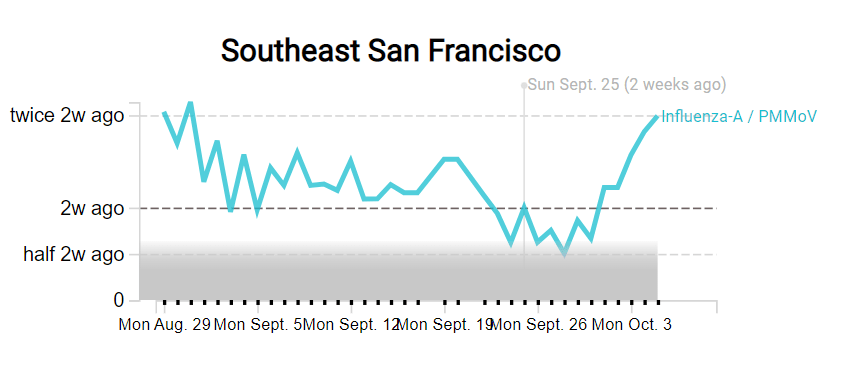
    • WastewaterSCAN: The SCAN network, run by researchers at Stanford University and Emory University, tests wastewater for flu, RSV, and monkeypox in addition to COVID-19 in select counties across the U.S. So far, this network is the first I know of to publicly share flu and RSV wastewater data, though other researchers are working in this area.

    Please let me know if I missed any data sources! (You can email me or comment below.)

    More federal data

  • Sources and updates, October 16

    • New paper outlines the CDC’s COVID-19 data failures: A new study by researchers at Johns Hopkins and Stanford, published this week in PLOS One, outlines missing and poor-quality epidemiological data that hindered the U.S.’s response to COVID-19. The researchers reviewed hundreds of reports by the CDC and other health agencies, finding that public data couldn’t answer key questions ranging from how long immune system protection lasts after an infection to which occupations and settings face the highest COVID-19 risk. (H/t Amy Maxmen.)
    • White House pushes for improvements to indoor air quality: This week, the White House hosted a summit event on indoor air quality while launching new resources to help building owners improve their air. The summit featured talks by government officials and leading experts, discussing why indoor air quality is important—especially in public facilities like schools—and providing recommendations. (For more details, see this Twitter thread by Jon Levy.) Biden officials are calling on building owners to participate in the “Clean Air in Buildings Challenge,” which includes bringing in more clean outdoor air and enhancing filtration. While these are important steps for health improvements, some experts would like to see the federal government go further by mandating clean air.
    • Voters do actually support safety measures, poll shows: New polling data from the left-wing think tank Data for Progress suggests that, contrary to popular narratives, a majority of Americans understand that COVID-19 still poses risks and support safety measures. For example, 74% of likely voters support the federal government requiring schools and workplaces to improve indoor air quality, and 70% of likely voters understand that certain groups (disabled people, seniors, etc.) remain at high risk from COVID-19.
    • New study demonstrates long-term risks of infection: Another notable new paper from this week: researchers in Scotland used health records and surveys to follow about 33,000 people who tested positive for COVID-19, compared to 63,000 who did not. The patients were all surveyed at six, 12, and 18 months post-infection; between the six- and 18-month surveys, about 6% of the cohort had not recovered while 42% reported only partial recovery. As one of the biggest studies to date that doesn’t rely solely on health records, this paper shows how Long COVID can be devastating long-term for patients.
    • Further research backs up testing out of isolation: And one more study I wanted to highlight this week: researchers at the University of California San Francisco examined how long people remained contagious after a coronavirus infection. The study included over 60,000 people who were tested at community sites in San Francisco. Five days after symptoms started, the researchers found, about 80% of patients infected during the Omicron BA.1 period were still positive on rapid tests—suggesting that, as other studies have found in the past, five days is an inadequate isolation period. Rapid testing out of isolation is the way to go.

  • Several respiratory viruses might spread widely this fall; here’s how we should track them

    Several respiratory viruses might spread widely this fall; here’s how we should track them

    The SCAN wastewater network is tracking flu, RSV, and other viruses in wastewater along with the coronavirus.

    As you might have guessed from the last couple weeks of National numbers posts, I am anticipating that the U.S. will see a new COVID-19 surge this fall, along with potential surges of the flu and other respiratory diseases. And I’m not the only person making this prediction: in the last couple of weeks, this potential surge has been a major theme in news publications and health experts’ Twitter threads.

    Yes, most of the U.S.’s major COVID-19 indicators appear to be at low levels right now (at least compared to earlier in the Omicron era). But rising numbers in Europe, as well as trends from some parts of the Northeast, provide reasons to worry. Here’s why it’s worth worrying, and some thoughts on better tracking these viruses in the future.

    Why experts anticipate a fall surge

    One likely reason for a fall surge, as writer Ewen Callaway explains in Nature, is an influx of new subvariants that have continued to evolve off of Omicron. While there are several lineages on the rise in various countries, researchers are finding that they tend to have similar mutations and capacities for reinfecting people, Callaway reports. Scientists call this “convergent evolution.”

    From the story:

    SARS-CoV-2-watchers are tracking an unprecedented menagerie of variants from a number of branches of the Omicron family tree, says Tom Peacock, a virologist at Imperial College London. Despite these variants’ distinct ancestries, they carry many of the same mutations to the SARS-CoV-2 spike protein (the part of the virus that immune systems target). “Clearly, there’s an optimal way for a variant to look going into this season,” says Peacock.

    The new bivalent booster shots will help reduce severe disease from these newer Omicron iterations. But Americans are currently getting boosted in such small numbers that the shots might not help alleviate healthcare systems as much as experts might’ve hoped. And that brings me to another surge driver: behavior.

    More than at any point in the pandemic, Americans are acting like COVID-19 is not worth a simple mask in public or test before a gathering—even though the coronavirus is still very capable of sending people to the hospital or giving them long-term symptoms. Indoor gatherings, holiday travel, fully opened schools, and all the behaviors that come with them will inevitably lead to outbreaks that are poorly tracked by our increasingly-less-resourced public health system (and that are largely ignored by leaders who encouraged the unsafe behavior).

    Katherine Wu summarized this situation well in a recent article for the Atlantic, writing: 

    So we can call this winter “post-pandemic” if we want. But given the policy failures and institutional dysfunctions that have accumulated over the past three years, it won’t be anything like a pre-pandemic winter, either. The more we resist that reality, the worse it will become. If we treat this winter as normal, it will be anything but.

    At the same time, the behaviors contributing to more COVID-19 spread will also help other respiratory viruses. Experts are anticipating that the U.S. could have a bad flu winter, based on trends from the Southern hemisphere—which faces the flu a few months before we do. (For journalists interested in following flu patterns this fall and winter, the Association of Health Care Journalists has a new tipsheet on the subject.)

    In addition to COVID-19 and the flu, the U.S. is seeing increased transmission of other respiratory viruses particularly primed to spread among children, such as RSV, rhinoviruses and enteroviruses. Pediatricians and hospital directors told USA TODAY’s Adrianna Rodriguez that they’re seeing more sick kids, earlier in the school year than they would typically expect. Kids have less immunity to these viruses after limited spread in the last two winters, while minimal health precautions are making it easier for the viruses to infect more people.

    Expanding COVID-19 surveillance to other viruses

    In short, we could see a lot of respiratory virus cases in the next few months. These trends have got me thinking about how, in an ideal world, the U.S. public health system might expand our existing COVID-19 surveillance to better track all of the viruses that wreak havoc on our bodies during colder weather. (As I pointed out last month, our flu tracking is pretty terrible right now.)

    Here are a few suggestions:

    • Expand wastewater surveillance to other respiratory viruses. Some pilot programs, such as the SCAN network based at Stanford and Emory Universities, have already started to monitor the flu, RSV, and other viruses in wastewater. But we need this type of tracking on a much broader scale, and we need it to be funded by the CDC and other major health institutions. (Biobot and the CDC’s expansion into monkeypox surveillance is a good first step here.)
    • Make multipurpose PCR tests widely available. My favorite place to get a COVID-19 test is one of the NYC health department’s express PCR sites. These public labs conduct PCR analysis on-site, so I get my test results in a few hours. And the results don’t just include COVID-19: the lab also tests for flu and RSV, so I can immediately rule out several explanations as to why my throat might be sore. We need many more labs doing this type of multi-virus testing.
    • Conduct population surveys for multiple respiratory diseases. I frequently reference the work of epidemiologist Denis Nash and his team at the City University of New York, who have surveyed New Yorkers and nationally to understand true COVID-19 infection rates. This type of work should be expanded to other diseases, in order to develop better, closer-to-real-time estimates of multiple conditions.
    • Add more diseases to hospital surveillance systems. Did you know that the HHS’s hospital utilization dataset includes hospitalizations for flu? While facilities have the opportunity to submit their flu patient numbers through the same system that they report on COVID-19 patients, flu reporting is optional—and therefore not very useful for analysis. A future iteration of the HHS’s hospital surveillance system should include mandatory flu reporting as well as other diseases, so that we can track severe cases more closely.
    • Incorporate respiratory virus tracking into school systems. For the first couple of pandemic-era semesters, many K-12 school systems maintained detailed records of their COVID-19 cases. This process has largely disappeared along with other COVID-19 measures—and while it lasted, it was incredibly burdensome for the school officials doing the tracking (many of them already-overworked school nurses). Still, in a future with more resources devoted to health in public schools, I’d like to see them become sites for tracking a variety of diseases and health conditions. The more collaboration between public schools and public health, the better.

    If you know of researchers or organizations working on any of these surveillance mechanisms—or anything I haven’t included on this list—please reach out! I am always on the lookout for solutions story ideas.

    More on testing

  • Orders of free at-home COVID-19 tests varied widely by state

    Orders of free at-home COVID-19 tests varied widely by state

    On September 2, 2022, the federal government stopped taking orders for free at-home COVID-19 tests. The distribution program, which launched during the first Omicron surge in early 2022, allowed households to order free tests up to three times, with either four or eight tests in each order.

    The day this program ended, I sent a public records request to the federal government asking for data on how many tests were distributed. I filed it through MuckRock’s portal, so both the original request and my correspondence with the U.S. Postal Service’s records office are publicly available.

    Last week, the USPS fulfilled my request. While I’d requested data by state, county, and/or ZIP code, the agency only sent over at-home test orders and distribution numbers by state. According to the formal response letter they sent, more granular data would (somehow) count as “commercial information” and is therefore exempt from FOIA.

    Now, obviously, I think that far more data on the test distribution program should be publicly available. As I wrote back in January when the program started, in order to truly evaluate the success of this program, we need test distribution numbers by more specific geographies and demographic groups.

    Still, the state-by-state data are better than nothing. With these data, we can see that states with the highest volume of at-home test orders fall on the East and West coasts, with people living in the South and Midwest less likely to use the program.

    (The population data that I used to calculate these per capita rates are from the HHS Community Profile Report.)

    With the data from my FOIA request, we can see that states with higher vaccination rates also had more people taking advantage of the free COVID-19 test program. States like Vermont and Hawaii rank high up for both metrics, while states like North Dakota and Wyoming are on the lower end for both.

    At the same time, many of the states where fewer people ordered the free tests are also states that saw higher COVID-19 death rates in 2022. In Mississippi, for example, about 433 people died of COVID-19 for every 100,000 residents since the year started—the highest death rate of any state. But people in the state ordered free tests at a rate under 0.3 per capita.

    These charts basically confirm what many public health experts suspected about the free COVID-19 test program: Americans who already were more protected against COVID-19 (thanks to vaccination) were most likely to order tests. Just as we’re seeing now with the Omicron-specific booster shots, a valuable public health measure went under-utilized here.

    I invite other journalists to report on these data; if you do, please link back to my original FOIA request on MuckRock!

    More testing data

  • Sources and updates, September 25

    • CDC adds data on new booster shots: The latest addition to the CDC’s COVID Data Tracker is the Omicron-specific, bivalent booster shots, authorized a couple of weeks ago. So far, the CDC has only provided a total count of Omicron booster recipients (4.4 million, as of September 21) and incorporated these boosters into total counts of Americans who’ve received “first” and “second boosters. A note at the top of the dashboard explains the CDC is working to provide more granular data about the new boosters as separated out from past boosters.
    • Evidence Commons (ASU): Researchers at Arizona State University’s College of Health Solutions have compiled this detailed dashboard of scientific publications related to COVID-19 tests, supported with funding from the Rockefeller Foundation. The dashboard incorporates information from over 3,000 papers, sorted by the type of test under study, methodology, analysis location, and more. It’s a helpful tool to sort through diagnostic details that are often buried in technical documents.
    • Helix announces new CDC partnership: Speaking of testing, the viral sequencing and population genomics company Helix announced this week that it has an “extended agreement” with the CDC to sequence coronavirus samples for the agency’s analysis. While Helix has been working with the CDC on variant tracking for some time, the new partnership extends this important effort: Helix (and research partners) will sequence over 3,000 coronavirus samples per week for the next year, “with the option to double the number of samples during surge moments,” according to the company’s press release.
    • Pathogen Genomics Centers of Excellence: The CDC has also directed new surveillance funding to five state health departments that will test out new genomics technologies and respond to infectious disease outbreaks. These five departments—Georgia, Massachusetts, Minnesota, Virginia, and Washington—are receiving $90 million over the next five years; the funding came out of $1.7 billion allocated for genomic surveillance in the American Rescue Plan. I’m glad to see this sustained funding going beyond COVID-19, though I wish more than five states were getting the money!
    • Long-term nervous system damage from COVID-19: Ziyad Al-Aly and his team at the Veterans Affairs St. Louis Healthcare System have published a new paper on long-term impacts from a COVID-19 infection. The study used a large dataset of electronic health records from a national VA database, including 154,000 people with COVID-19 and over five million controls. COVID-19 patients had an elevated risk of strokes, cognition and memory problems, seizures, mental health disorders, encephalitis, and more. While the VA population isn’t the best representation for the U.S. population as a whole (it skews older and male), the study still provides evidence for long-term neurological complications from COVID-19.
    • Long COVID estimates in Europe: And one more piece of Long COVID news for this week: the World Health Organization’s European division has produced new estimates on Long COVID for the continent. Between 10% and 20% of COVID-19 cases in Europe have led to mid- or long-term symptoms, the WHO found, impacting up to 17 million people. The study also found women are more likely to develop Long COVID.

  • Sources and updates, July 17

    • COVID-19 and antimicrobial resistance: The pandemic resulted in major losses for the fight against antimicrobial resistance, according to a new CDC report published last week. Antimicrobial resistance (AMR), in which bacteria evolve the ability to bypass commonly-used antibiotics, is a significant public health concern in the U.S. and globally. The CDC is still missing data for several major AMR threats during the pandemic, but data the agency was able to compile present a concerning picture about resistant infections in U.S. hospitals during the pandemic.
    • CDC’s air travel contact tracing needs work: And now, a report about the CDC: the U.S. Government Accountability Office found that the agency’s data system for contact tracing on flights “needs substantial improvement.” Without a comprehensive, singular data source for airplane passenger contact information, the CDC has to do extra research and extend contact tracing time after a passenger tests positive for COVID-19.
    • State COVID-19 data reporting continues slowing: New York Times reporter Adeel Hassan and colleagues described how states are reporting their COVID-19 data less frequently and closing public testing sites, leaving more gaps and delays in their numbers. This article provides a helpful summary of a trend I’ve alluded to in various blog posts for the last few weeks.
    • Private companies step up to assist with PCR testing: Two major testing companies, Quest Diagnostics and Color Health, announced this week that they will provide free COVID-19 testing to some Americans without health insurance at hundreds of sites across the country; these site locations will be determined by the CDC’s Social Vulnerability Index. The CDC is picking up the tab for these testing costs, according to press releases. (H/t the COVID Weekly Testing Newsletter.)
    • FDA authorization for Novavax vaccine: Novavax’s protein-based COVID-19 vaccine has been granted Emergency Use Authorization by the FDA. While this vaccine option is unlikely to substantially increase uptake in the U.S., the FDA’s authorization opens the door for Novavax shots to be used as fall booster shots—an idea that seemed promising to some members of the agency’s advisory committee in a recent meeting.

  • FAQ: PCR testing is still important, but it’s become harder to access

    FAQ: PCR testing is still important, but it’s become harder to access

    NYC has closed public testing sites and reduced hours this spring. For full, interactive charts, see the Gothamist story.

    New York City has been closing PCR testing sites, even as the city faced a major Omicron resurgence this spring. This was the main finding from a story I wrote for Gothamist and WNYC (New York Public Radio), based on my analysis of public information on city-run testing sites.

    While this was a local story, I think the trends I found—and the pushback that the piece received from city health officials—are pretty indicative of the national state of COVID-19 testing right now. Since the federal government ran out of funding to cover testing for Americans without health insurance in late March, private testing companies have started requiring insurance information and, in many cases, raising their prices.

    At the same time, state and local health departments have closed their public PCR testing sites and directed people to use at-home rapid tests instead. New York City still has more accessible testing than most of the country, but my story showed how even here, getting tested is becoming more difficult—and less popular.

    Here are a few key statistics from the piece:

    • The number of public PCR testing sites run by NYC Health + Hospitals was cut in half between mid-February and mid-April.
    • The total hours that public testing sites were open decreased from over 10,000 during a week in February, to 8,500 during a week in April, to 7,500 in the last week of June.
    • Manhattan testing hours remained relatively constant (about 1,500 in each of the weeks I analyzed), while hours were cut in other boroughs.
    • The numbers of New Yorkers getting tested on a daily basis were similar in June 2021 and June 2022—even though reported case rates were about ten times higher this year.
    • New York City’s test positivity rate recently shot above 10%, and is now over 15%. It was closer to 1% at this time last year.

    The NYC health department had some issues with my story. In fact, city health commissioner Dr. Ashwin Vasan posted a Twitter thread stating that it was “missing key information” and that the city actually has “more testing resources than ever.” But the “testing resources” he cites here are mostly at-home tests; PCR testing in NYC is both less accessible and less popular. A follow-up story that I coauthored with Nsikan Akpan, my editor at Gothamist/WNYC, further explains the situation in the city.

    The decline in PCR testing is making it harder to understand where and how fast the coronavirus is spreading, both in the city and around the U.S. To explain the implications of this trend, here’s a short FAQ on how to think about testing during our current surge.

    Why is PCR testing still important for individuals?

    One of the city officials’ main responses to my story was that NYC has made it easy for people to get free at-home rapid tests, in place of PCR testing. The city has distributed more than 35 million at-home tests at hundreds of libraries and other community sites.

    At-home tests certainly have advantages: they’re more convenient, with results back in 15 minutes. Turnaround times for PCR tests are generally pretty fast right now thanks to limited demand (usually under 48 hours, if not under 24 hours, in NYC), but that’s still a long wait compared to a rapid test. Rapid, at-home tests also provide a better indicator of contagiousness.

    Still, PCR tests have continued utility because they remain the gold standard of accuracy: they’re able to identify a COVID-19 case with much smaller amounts of coronavirus present in someone’s respiratory tract than a rapid test. As a result, if you were recently exposed or are showing some mild symptoms—but testing negative on rapid tests—a PCR test could be valuable to provide a more reliable COVID-19 status.

    PCR tests can also be helpful for documenting a COVID-19 case. While many doctors will take a rapid test positive as a clear indicator of an infection, some settings may require a PCR test—in which results are verified by the lab that processes the test. This can be particularly true for Long COVID clinics, health advocate JD Davids told me. So, if you tested positive on a rapid test but are concerned about Long COVID symptoms, a PCR test may be a helpful verification step.

    Why is PCR testing still important for communities?

    Rapid, at-home test results generally do not travel further than your trashcan, or maybe your phone camera. They don’t get reported to testing companies, or local public health departments, or the CDC—unlike PCR tests, which have established data pipelines for such reporting. Some jurisdictions do have options for residents to self-report rapid test results, but this self-reporting is generally a small fraction of the total tests conducted.

    As a result, public health experts generally rely upon PCR testing data to understand patterns in COVID-19 spread. When less PCR testing takes place, these patterns become more difficult to interpret. For example, in the U.S. as a whole, around 100,000 new cases a day have been reported for the last several weeks; but we know that the true trend would likely be a lot more variable if we had data from rapid tests.

    Also, as Brown University epidemiologist Dr. Jennifer Nuzzo pointed out when my editor Nsikan interviewed her for our follow-up story, PCR tests are necessary for tracking variants. A selection of PCR test samples get genetically sequenced; this doesn’t happen for rapid tests.

    “It’s really important for us to stay ahead of what variants are circulating in our communities,” Nuzzo said, citing what society has already learned about different variants to date. “Some are more transmissible. Some have been more severe. We need to stay ahead of the virus, so that we can know when and how and if to change our strategy about how to control it.”

    What’s the value of abundant local testing sites?

    If PCR testing is less popular in this current phase of the pandemic, you might ask, why not just have a few central testing hubs in a place like NYC, and maintain testing capacity in a more efficient way? This seems to be the city’s response, to some extent: officials explained that some brick-and-mortar testing sites (mostly at NYC hospitals) are staying open, while the city’s fleet of mobile testing vans can move around as needed.

    But for a lot of people, traveling outside their neighborhood to get a test or tracking down the right mobile van can be a major barrier to getting tested. This is especially true for essential workers and low-income New Yorkers—who are the people most in need of testing. Maintaining public testing throughout the city is a health equity issue.

    To quote again from the follow-up story:

    And even if the testing capacity is technically maintained, location is important. Consider a region like South Brooklyn: Four brick-and-mortar testing sites scheduled to close in mid-July are all located in this area: 4002 Fort Hamilton, Bay Ridge, Bensonhurst and Midwood Pre-K.

    It’s unclear whether mobile sites will move to South Brooklyn in response. Shrier said each closing site has “dedicated at-home test distribution sites” within one mile. But residents of Bay Ridge, Bensonhurst and other nearby neighborhoods may need to travel further to get a PCR test — or face high costs at private sites.

    What data sources could replace information from PCR tests?

    Dr. Denis Nash, an epidemiologist at the City University of New York whom I interviewed for the first NYC story, talked about two types of data that may be collected by a health agency tracking disease spread.

    “There’s active surveillance and passive surveillance,” he said. “In active surveillance, the health department staff are actively going out and trying to ascertain how many cases there might be. They’re going to hospitals and to homes, looking for cases. And when you do that, you’re more likely to exhaustively find a high proportion of cases.” One example of active surveillance: a survey conducted by Nash and his team at CUNY in April and May, which indicated about 20% of New Yorkers may have had COVID-19 within a two-week period.

    Meanwhile, passive surveillance “relies on healthcare providers and laboratories to voluntarily report their tests and cases to the health department,” Nash said. NYC and other health departments which receive much of their COVID-19 data—PCR test results, hospital admissions, etc.—from healthcare providers are exemplifying this passive approach.

    As COVID-19 becomes less of a public concern and testing is less popular, health agencies should step up their active surveillance, Nash said. Wastewater can be another source of data that’s more active than PCR test results, since it reflects COVID-19 spread across a large population. (Unfortunately, in NYC, wastewater data is pretty inaccessible; that’s a topic for another time.)

    What’s the best way to use at-home rapid tests?

    Rapid test use can fall into three different categories. First, if you are trying to determine whether you’re actively contagious right before a gathering or seeing a high-risk person: take one test, as close in time to the event as possible. (For example, if I’m going to a large march in NYC, I plan to test myself a few minutes before heading to the subway.)

    Second, if you had a recent COVID-19 exposure (or attended a high-risk event), test multiple times in succession—ideally at least twice in 48 hours. This testing process should start a couple of days after the exposure, because rapid tests aren’t accurate enough to pick up the infection right away. You could also use a single PCR test to serve the same purpose as multiple rapid tests.

    And third, if you are isolating after a positive COVID-19 test, rapid tests can help identify when you’re no longer contagious and able to return to society. As I wrote in an earlier post, the CDC’s five-day isolation guidance is not actually backed up by data; testing out of isolation is much safer.

    As always, if you have questions about testing or any other COVID-19 topic, my inbox is open.

    More testing coverage

  • Nine areas of data we need to manage the pandemic

    Nine areas of data we need to manage the pandemic

    PCR testing has greatly declined in recent months; we need new data sources to help replace the information we got from it. Chart via the CDC.

    Last week, I received a question from my grandmother. She had just read my TIME story about BA.4 and BA.5, and was feeling pessimistic about the future. “Do you think we’ll ever get control of this pandemic?” she asked.

    This is a complicated question. And it’s one that I’ve been reflecting on as well, as I approach the two-year anniversary of the COVID-19 Data Dispatch and consider how this publication might shift to meet the current phase of the pandemic. I am not an infectious disease or public health expert, but I wanted to share a few thoughts on this; to stay in my data lane, I’m focusing on data that could help the U.S. better manage COVID-19.

    The coronavirus is going to continue mutating, evolving past immune system defenses built by prior infection and vaccination. Scientists will need to continue updating vaccines and treatments to match the virus, or we’ll need a next-generation vaccine that can protect against all coronavirus variants.

    Candidates for such a vaccine, called a “pan-coronavirus vaccine,” are under development by the U.S. Army and at several other academic labs and pharmaceutical companies. But until a pan-coronavirus vaccine becomes available, we’ll need to continue tracking new variants and the surges they produce. We also need to better track Long COVID, a condition that our current vaccines do not protect well against.

    Eventually, COVID-19 will likely be just another respiratory virus that we watch out for during colder months and large indoor gatherings, broadly considered “endemic” by scientists. But it’s important to note—as Dr. Ellie Murray did in her excellent Twitter thread about how pandemics end—that endemicity does not mean we stop tracking COVID-19. In fact, thousands of people work to monitor and respond to another endemic virus, the flu.

    With that in mind, here are nine categories of data that could help manage the pandemic:

    • More comprehensive wastewater surveillance: As I’ve written here and at FiveThirtyEight, sewers can offer a lot of COVID-19 information through a pipeline that’s unbiased and does not depend on testing access. But wastewater monitoring continues to be spotty across the country, as the surveillance can be challenging to set up—and more challenging for public health officials to act on. Also, current monitoring methods exclude those 21 million households that are not connected to public sewers. As wastewater surveillance expands, we will better be able to pinpoint new surges right as they’re starting.
    • Variant surveillance from wastewater: Most of the U.S.’s data on circulating variants currently comes from a selection of PCR test samples that are run through genomic sequencing tests. But this process is expensive, and the pool of samples is dwindling as more people use at-home rapid tests rather than PCR. It could be cheaper and more comprehensive to sequence samples from wastewater instead, Marc Johnson explained to me recently. This is another important aspect of expanding our wastewater monitoring.
    • Testing random samples: Another way to make up for the data lost by less popular PCR testing is conducting surveillance tests on random samples of people, either in the U.S. overall or in specific cities and states. This type of testing would provide us with more information on who is getting sick, allowing public health departments to respond accordingly. The U.K.’s Office for National Statistics conducts regular surveys like this, which could serve as a model for the U.S.
    • More demographic data: Related to random sample testing: the U.S. COVID-19 response still needs more information on who is most impacted by the pandemic, as well as who needs better access to vaccines and treatments. Random sampling and surveys, as well as demographic data connected to distributions of treatments like Paxlovid, could help address this need.
    • Vaccine effectiveness data: I have written a lot about how the U.S. does not have good data on how well our COVID-19 vaccines work, thanks to our fractured public health system. This lack of data makes it difficult for us to identify when vaccines need to be updated, or who needs another round of booster shots. Connecting more vaccination databases to data recording cases, hospitalizations, and Long COVID would better inform decision-making about boosters.
    • Air quality monitoring: Another type of data collection to better inform decision-making is tracking carbon dioxide and other pollutants in the air. These metrics can show how well-ventilated (or poorly-ventilated) a space is, providing information about whether further upgrades or layers of safety measures are needed. For example, I’ve seen experts bring air monitors on planes, citing poor-quality air as a reason to continue wearing a mask. Similarly, the Boston public school district has installed air monitors throughout its buildings and publishes the data on a public dashboard.
    • Tracking animal reservoirs: One potential source for new coronavirus variants is that the virus can jump from humans into animals, mutate in an animal population, and then jump back into humans. This has happened in the U.S. at least once: a strain from minks infected people in Michigan last year. But the U.S. is not requiring testing or any mandatory tracking of COVID-19 cases in animals that we know are susceptible to COVID-19. Better surveillance in this area could help us catch variants.
    • Better Long COVID surveillance: For me personally, knowledge of Long COVID is a big reason why I remain as cautious about COVID-19 as I am. Long COVID patients and advocates often say that if more people understood the ramifications of this long-term condition, they might be more motivated to take precautions; I think better prevalence data would help a lot with this. (The Census and CDC just made great strides in this area; more on that later in the issue.) Similarly, better data on how the condition impacts people would help in developing treatments—which will be crucial for getting the pandemic under control.
    • More accurate death certificates: The true toll of the pandemic goes beyond official COVID-19 deaths, as the Documenting COVID-19 project has discussed at length in our Uncounted investigation. If we had a better accounting of everyone whose deaths were tied to COVID-19, directly or indirectly, that could be another motivator for people to continue taking safety precautions and protecting their communities.

    If you are working to improve data collection in any of these areas—or if you know a project that is—please reach out! These are all topics that I would love to report on further in the coming months.

    More federal data

  • Sources and updates, June 19

    Sources and updates, June 19

    • Curative provides testing trends and commentary to reporters: Last week, I talked to Isaac Turner, chief technology officer at Curative, a COVID-19 testing company with more than 15,000 locations across the country. Curative staff keep a close eye on trends in test positivity and cycle threshold values (a measure of how infectious someone with COVID-19 may be), and share this information with health agencies. While the company doesn’t have a public dashboard, they’re eager to share data with reporters on request and discuss testing trends. For example, Turner told me that in recent weeks, there has been “almost no surge in testing” even though COVID-19 cases have clearly risen across the country. To reach out, you can contact PIO Alana at alana.prisco@ketchum.com.
    • Walgreens COVID-19 testing dashboard: Another source for testing trends, as government sources become less reliable, is the Walgreens dashboard—incorporating data from COVID-19 PCR testing at more than 5,000 Walgreens locations across the country. In partnership with Aegis Services, many of these test samples are sequenced or identified as specific variants via S-gene target failure. The Walgreens dashboard has a shorter lag time than the CDC’s variant prevalence estimates, so it may be a useful way to see trends in advance.
    • Kids under 5 can finally get vaccinated: As of yesterday, the CDC has formally recommended versions of both Pfizer’s and Moderna’s COVID-19 vaccines for children under age 5 after they received emergency use authorization from the FDA. This youngest age group can finally get vaccinated! I usually like to watch the FDA advisory committee meetings where new vaccines are discussed, but didn’t have the bandwidth to watch or report on the meetings this week; if you’d like to read up on them, I recommend the Your Local Epidemiologist and STAT News recaps.
    • Estimating lives saved by universal healthcare: A major new paper this week, by researchers at the Yale School of Public Health, estimates that if the U.S. had a single-payer universal healthcare system, the country may have saved 212,000 lives during the first year of the pandemic. They arrived at this estimate by analyzing data on Americans who lost their health insurance in 2020 or were already uninsured, combined with the impact of being uninsured on COVID-19 mortality. A universal healthcare system would have also saved over $100 billion in healthcare costs in 2020, the researchers found. Read more at Scientific American.
    • Long COVID may be less likely after an Omicron case: Another new study that caught my attention this week: researchers at King’s College London used the U.K.’s excellent statistics on Long COVID prevalence to compare the risks of long-term symptoms after a Delta infection to the risks after an Omicron infection. They found that the risk of Long COVID after an Omicron infection was about half the risk after a Delta infection, which is potentially pretty good news! Still, it’s still concerning that so many people are at risk for Long COVID after an Omicron infection considering the high case numbers driven by this variant, some outside researchers told NPR.
    • CDC study on COVID-19 risk for people with disabilities: And one more notable study: CDC researchers examined COVID-19 hospitalization rates among Medicare beneficiaries, comparing those who were on this healthcare plan due to disability to those on the plan due to age. They found that disability beneficiaries had 50% higher hospitalization rates, with the risk for hospitalization increasing with age in both groups. Also: Native American Medicare beneficiaries had the highest hospitalization rate of any racial or ethnic group.

  • As Omicron keeps mutating, variant surveillance remains important

    As Omicron keeps mutating, variant surveillance remains important

    BA.4 and BA.5 caused more than 20% of new COVID-19 cases nationwide in the week ending June 11, according to CDC estimates.

    This week, I had a new story published at TIME’s online news site, explaining what Omicron BA.4 and BA.5 could mean for COVID-19 trends in the U.S.

    The story makes similar points to my FAQ post on these subvariants from earlier in June: basically, BA.4 and BA.5 have evolved to get around antibodies from a prior coronavirus infection or vaccination, and the U.S. is likely to see a lot of reinfections from these subvariants—even among people who already had BA.1 or BA.2 earlier this year. BA.2.12.1 has mutated in a similar way, leading experts to suspect that one of these subvariants (or all three) will dominate the next phase of the pandemic. 

    When I talked to variant experts for my TIME story, I asked them for their thoughts on surveillance. “Is it getting harder to identify and track new linages like BA.4 and BA.5 as fewer people use PCR tests and more use at-home tests?” I asked. “What improvements or shifts would you like to see in surveillance?”

    All three experts I spoke to had different perspectives, which I found interesting—and worth sharing in the COVID-19 Data Dispatch, since I wasn’t able to include this (somewhat wonkier) information in my TIME story.

    Here’s what they said:

    Marc Johnson, a microbiology and immunology professor at the University of Missouri who leads the state’s wastewater surveillance program, thinks that expanding wastewater monitoring is the way to go (though he admitted his bias, as someone who works in this area). “Sewershed monitoring is a really good way to track variants going forward,” he said. “It gives you a comprehensive view without costing you hundreds of thousands of dollars… or without having to sequence a thousand people.”

    Shishi Luo, associate director of bioinformatics and infectious diseases at Helix (a genomics and viral surveillance company), is thinking about how to ensure her company consistently receives enough PCR test samples to get useful data from sequencing. At the moment, pharmacies and community testing sites are still providing enough samples that Helix has sufficient information to track variants, she said. But, anticipating that those numbers may dwindle, Helix is connecting with urgent care clinics and hospitals that do diagnostic testing. “I think those places will continue to collect samples and perform qPCR tests,” she said.

    Paul Bieniasz, a professor at Rockefeller University who studies viral evolution, thinks that the current levels of surveillance are sufficient—at least, when it comes to policymaking and updating vaccines. “I would like to keep surveillance at a level such that such that we can have a pretty accurate picture about what’s going on,” he said. But he wants to prioritize “the really important things”: namely, understanding changes to vaccine effectiveness, which treatments to use, and identifying a new “major antigenic shift” like the one that produced Omicron as soon as it occurs.

    “But it can always be better,” he said. “The more intense the surveillance, the more sensitive it is, and the earlier you detect things that might be of concern in the future.”

    More variant reporting