Author: Betsy Ladyzhets

  • National numbers, November 14

    National numbers, November 14

    Many Northern states are seeing cases increase right now as Southern states have lower transmission levels. Charts from the November 10 Community Profile Report.

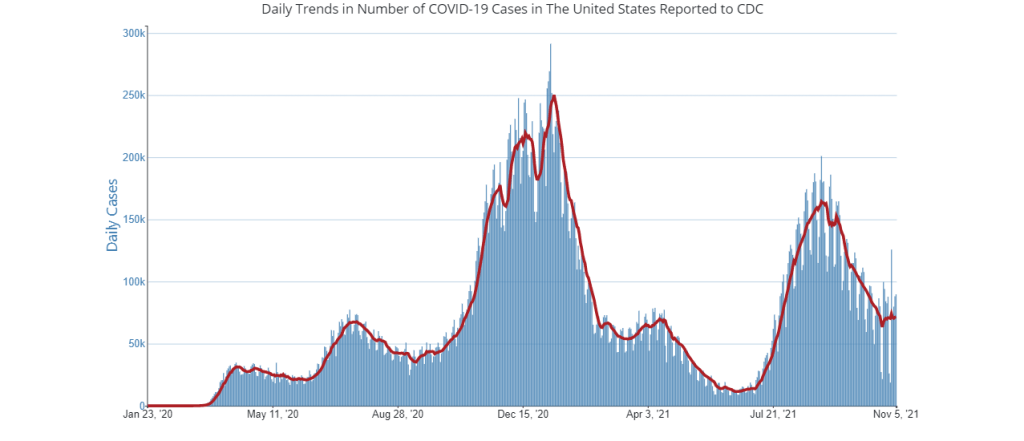
    In the past week (November 6 through 12), the U.S. reported about 510,000 new cases, according to the CDC. This amounts to:

    • An average of 73,000 new cases each day
    • 156 total new cases for every 100,000 Americans
    • 3% more new cases than last week (October 30-November 5)

    Last week, America also saw:

    • 36,000 new COVID-19 patients admitted to hospitals (11 for every 100,000 people)
    • 7,000 new COVID-19 deaths (2.1 for every 100,000 people)
    • 100% of new cases are Delta-caused (as of November 6)
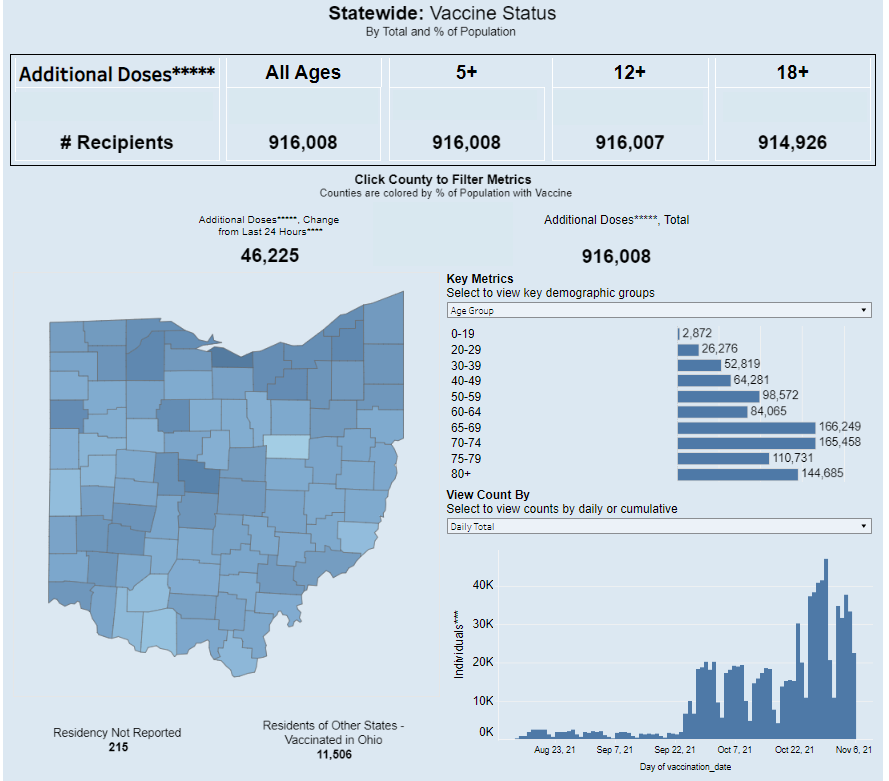
    • An average of 1.4 million vaccinations per day (including booster shots; per Bloomberg)

    It may be happening slowly, but the U.S. is clearly at the start of a winter COVID-19 surge. The number of newly reported cases rose this week for the first time since early September, while the number of COVID-19 patients in hospitals has plateaued.

    Delta is still causing practically 100% of COVID-19 cases in the country, so a new variant is probably not to blame for this potential surge. Instead, it’s a consequence of the cold weather, combined with less-stringent safety behaviors among many Americans as we approach the holiday season. One epidemiologist told NBC that a surge may be “inevitable” at this time of year.

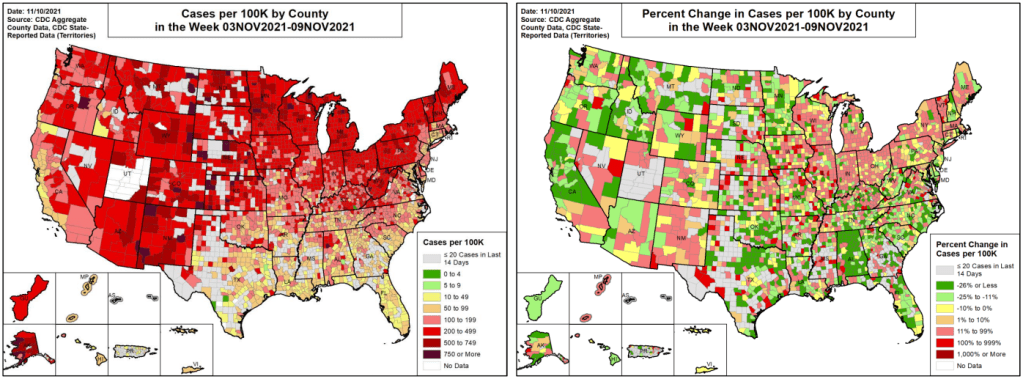
    In line with COVID-19’s cold-weather advantage, many Northern states are seeing cases increase right now as Southern states—which were hit harder by the summer Delta surge—have lower transmission levels. Alaska, North Dakota, New Mexico, Montana, and Wyoming had the highest case rates last week, per the latest Community Profile Report.

    Cases are also rapidly increasing in Maine, Vermont, Minnesota, Michigan, Colorado, and other chillier states. At Vermont’s St. Michael’s College, Halloween parties were a major source of new COVID-19 cases—even though 98% of people on campus are vaccinated, according to local outlet WCAX3.

    Still, it’s important to point out here that the U.S. is in a far better spot now than we were at this time last year. As Dr. Ashish Jha pointed out on Twitter recently, we have winter coming and the vast majority of schools in the country are open, but cases are flat rather than rising sharply as they did last November.

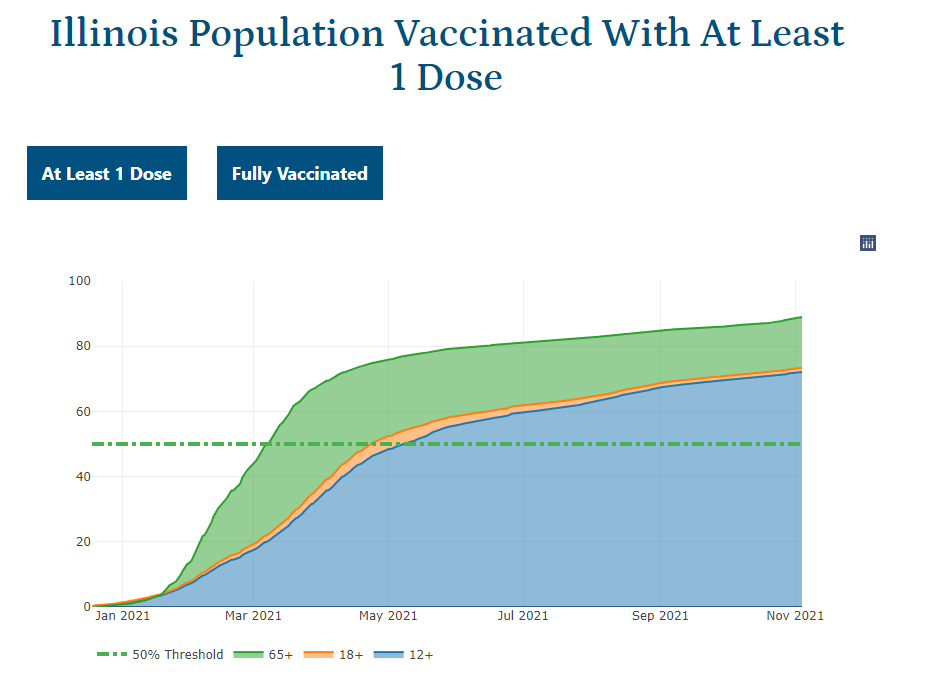
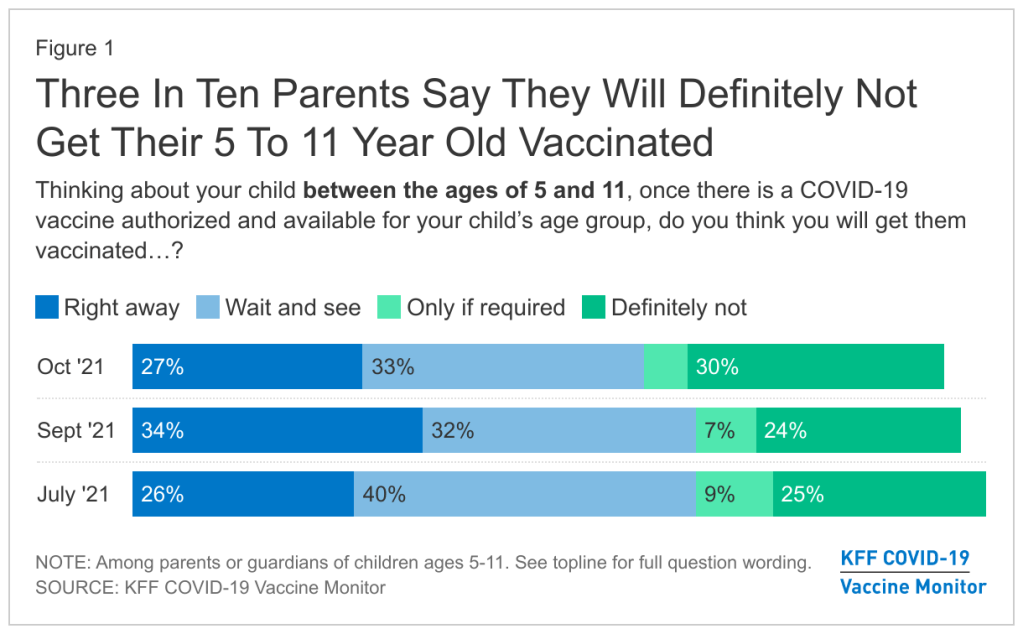
    Of course, we have vaccines to thank for this improved position. More than two-thirds of the U.S. population has received at least one vaccine dose; as of this week, that number includes over one million children under age 12, according to the CDC. Vaccinating more children and other people who are currently unvaccinated, booster shots for seniors, and continued use of masks and testing can help keep case numbers (relatively) low as we head into the coldest months.

  • COVID source callout: Illinois, where’s your vaccination data?

    COVID source callout: Illinois, where’s your vaccination data?

    As I updated my vaccine data source annotations this weekend, I found that the state of Illinois has overhauled its COVID-19 dashboard. The dashboard now highlights a few key metrics tied to Illinois’ reopening status on its home page (new hospital admissions, available ICU beds, etc.), while a menu at the side of the dashboard links out to pages on several other COVID-19 topics, along with a data portal.

    I like the new organization. Illinois has had a pretty cluttered dashboard for a while, and it’s much easier to navigate through the new version. But there’s one big problem: in this reorganization, Illinois seems to have taken down the vast majority of its vaccination data.

    The new dashboard includes one vaccination chart on its homepage: vaccinations among Illinois residents over time (at least one dose and fully vaccinated). You can download vaccination data by county through the dashboard’s data portal section. And there are vaccination charts included in both the “long-term care data” and “school and youth data” pages.

    The vaccination chart on Illinois’ COVID-19 dashboard homepage. Screenshot taken on November 7.

    But Illinois used to report a lot more metrics, including vaccination coverage by different age ranges, dose inventory, and breakthrough hospitalizations and deaths. Illinois was one of the first states to report breakthrough cases of any kind, and (as far as I am aware), it was the only state to publicly report a count of “unusable vaccine doses,” those doses that went to waste due to defects or other issues.

    What happened to these vaccine metrics? Will the Illinois health department put them back in a future dashboard update? If any local reporters from the state are reading this, I would love to know more about what’s going on here.

  • Featured sources, November 7

    • School Learning Modalities (HHS): Is that… could it be… comprehensive K-12 school COVID-19 data from the federal government?! Indeed: after over a year of calling out the government’s lack of data on this crucial topic, I was delighted to see the Department of Health and Human Services add a new dashboard to its COVID-19 data hub this week. The dashboard, produced in a collaboration between the CDC and the Department of Education, provides weekly updates on the learning status of school districts: in-person, hybrid, or remote. As of November 6, the dashboard included data for about 89% of students in 62% of districts. Next up, can we get some school case data?
    • When To Test (NIH): Earlier this year, the National Institutes of Health (NIH) supported production of an online tool aimed at helping schools, businesses, and other organizations develop routine COVID-19 testing programs. The tool, called When To Test, was updated this week with a new calculator aimed at individuals. Input some COVID-19 information (such as your location, vaccination status, and daily contacts), and the tool will help you determine whether to get tested. It could be useful for planning holiday gatherings!
    • COVID-19 Diagnostics Commons (ASU): Here’s another testing source, from Arizona State University. ASU researchers built a database of over 2,500 COVID-19 testing technologies that are available or going through the regulatory approval process around the world. You can search through the tests by regulatory status, diagnostic target, accuracy levels, and more.
    • Directory of federal government prime contractors: All businesses that contract with the federal government have until January 4, 2022 to ensure that all of their employees are vaccinated against COVID-19. This directory, from the U.S. Small Business Association, provides a comprehensive list of those contractors. You can see business names, what they do for the government, and more. (h/t Al Tompkins’ Covering COVID-19 newsletter.)

  • First COVID-19 antiviral pill gains authorization

    This week, an antiviral pill for COVID-19 was authorized in the U.K. The drug, made by American pharmaceutical company Merck, is the first COVID-19 treatment in pill form to gain approval by any regulatory agency.

    Some scientists have called this pill a “game-changer,” and for good reason. In Merck’s clinical trial, the drug approximately halved COVID-19 patients’ risk of hospitalization or death, compared to a placebo. The pill is designed for—and was tested on—adults who are particularly vulnerable to the virus, including seniors and those with preexisting conditions such as diabetes and heart disease.

    The pill, formally called molnupiravir, works by interfering with the coronavirus’ ability to replicate itself, stopping it from reaching further into the body and causing severe symptoms. (This STAT News article includes a video that explains the process in more detail.) Adults who show mild or moderate COVID-19 symptoms can take the pill soon after they realize they’re infected, in order to improve their chances of recovery without a hospital stay.

    In Merck’s clinical trial, patients started taking the pill five days after they began to experience COVID-19 symptoms. Each patient took four capsules, twice a day, for five days—adding up to 40 pills for a single patient.

    The U.K. government has bought almost 500,000 courses of molnupiravir. The U.S. government has brought about 1.7 million courses, and our FDA is slated to consider the pill for emergency use authorization later this month. Several other countries including France, Australia, Malaysia, and Singapore also have contracts in place to purchase the pills.

    But unlike other COVID-19 treatments and vaccines, molnupiravir may be more broadly available to people who don’t live in wealthy nations. Last week, Merck announced that it signed a voluntary licensing agreement with the Medicines Patent Pool, a public health organization backed by the United Nations that increases treatment access in over 100 low- and middle-income countries. As a result, a number of companies besides Merck will be able to manufacture and distribute their own versions of molnupiravir.

    Still, some global health advocates have criticized Merck for making a deal with the Medicines Patent Pool rather than the World Health Organization’s COVID-19 Technology Access Pool, which would provide access to a broader group of countries. The current deal leaves out some middle-income countries that are particularly poised to manufacture versions of molnupiravir, including countries like Brazil and Peru that have seen high COVID-19 death tolls.

    In short, Merck’s efforts to make its COVID-19 drug widely available are much better than anything we’ve seen from the major vaccine companies. But this is still far from the most equitable scenario.

  • Booster shot data slowly makes it onto state dashboards, but demographic information is lacking

    Booster shot data slowly makes it onto state dashboards, but demographic information is lacking

    Ohio is one of just eight states reporting demographic data for booster shots administered in the state. Screenshot taken on November 7.

    It’s now been over a month since the FDA and the CDC authorized third doses of Pfizer’s COVID-19 vaccine for a large swath of the U.S. population, and a couple of weeks since the agencies did the same thing for additional doses of Moderna and Johnson & Johnson’s vaccines. In that time, over 20 million Americans have received their boosters.

    This weekend, I set out to see what data are now available on these booster shots. I updated my vaccination data in the U.S. resource page, which includes detailed annotations on every state’s vaccine reporting along with several national and international sources.

    The majority of states (and national dashboards) are now including booster shots in their vaccine reporting, I found. But in most cases, the reporting stops at just one statistic: the total number of residents who have received an additional dose. A few states are reporting time series information—i.e. booster shots administered by day—and a few are reporting demographics—i.e. booster shot recipients by age, gender, race, and ethnicity—but these metrics are lacking across most dashboards.

    Demographic information, particularly race and ethnicity, should be a priority for booster shot data, as it should be for numerous other COVID-19 metrics. At the beginning of the U.S.’s vaccine rollout, Black and Hispanic/Latino Americans lagged behind white Americans in getting their shots, but limited data hindered the public health system’s ability to respond to this trend. (Now, the trends have evened out somewhat, though Black vaccination rates still lag white rates in some states.)

    Will we see the same pattern with booster shots? Considering the immense confusion that has surrounded America’s booster shot rollout in the last couple of months, it would not be surprising if disadvantaged communities are less likely to know about their potential need for a booster, or where and how to get those shots.

    But so far, we don’t have enough data to tell us whether this pattern is playing out. The CDC has yet to report booster shot data by race or ethnicity, though the agency is now reporting some figures by age and by state. Note: the CDC still has yet to report detailed vaccination data by race and ethnicity, period; the agency just reports national figures, nothing by state or other smaller geographies.

    At the state level, just eight states are reporting booster shots by race and ethnicity. 13 states are reporting some kind of time series (boosters administered by day or week), and three are reporting doses administered by vaccine manufacturer.

    Here are all the states that I found reporting booster shot data, with links to their dashboards:

    • Arkansas: Reporting total boosters only.
    • California: Total boosters only.
    • Colorado: Reporting demographics; age, race/ethnicity, and sex.
    • DC: Total boosters for DC and non-DC residents.
    • Delaware: Reporting demographics; age, race/ethnicity, and sex.
    • Florida: Total boosters only.
    • Indiana: Total boosters and doses administered by day.
    • Kansas: Total boosters and doses administered by day.
    • Louisiana: Total boosters only.
    • Massachusetts: Total boosters and doses administered by day.
    • Maryland: Reporting demographics; age, race/ethnicity, and sex.
    • Michigan: Reporting demographics (age, race/ethnicity, and sex) as well as doses administered by week and by manufacturer.
    • Minnesota: Total boosters only.
    • Missouri: Total boosters and doses administered by day.
    • Mississippi: Reporting demographics (age and race/ethnicity) as well as doses administered by facility type (total and for the prior week).
    • North Dakota: Total boosters and doses administered by day.
    • New Jersey: Reporting demographics (age, race/ethnicity, and sex) as well as doses administered by day and by manufacturer.
    • New Mexico: Total boosters only.
    • Ohio: Reporting demographics (age, race/ethnicity, and sex) as well as doses administered by day and by county.
    • Oklahoma: Total boosters only.
    • Oregon: Total boosters, doses administered by day and by county.
    • Pennsylvania: Total boosters and doses administered by day.
    • Rhode Island: Boosters administered by day only.
    • South Carolina: Boosters administered by day only.
    • South Dakota: Total boosters, doses administered by week and by county.
    • Texas: Total boosters only.
    • Virginia: Reporting demographics; age, race/ethnicity, and sex.
    • Vermont: Total boosters only.
    • Wyoming: Total boosters and doses administered by manufacturer.

    Local reporters: If your state is reporting demographic data, I recommend taking a look at those numbers. How does the population receiving booster shots compare to the overall population of your state, or to the population that’s received one or two doses? And if your state is not reporting demographic data (or any booster data at all), ask your public health department for these numbers!

    You can see my vaccine annotations page for more information on all of these state dashboards. And if there are any states or metrics I missed, please let me know! Comment here or email me at betsy@coviddatadispatch.com.

    More vaccine reporting

  • Send me your holiday COVID-19 questions

    It’s been about one year since I wrote the post, “Your Thanksgiving could be a superspreading event.” This post, inspired by a question I received from a reader, explained that a superspreading event occurs when one person infects many others with the coronavirus in a short period of time. I also went over how we identify these events and where they tend to occur—typically in crowded, indoor, poorly ventilated settings where people are packed together for long periods of time.

    I ended the post by arguing that Thanksgiving celebrations, along with transportation and other activities along the way to those celebrations, could potentially become superspreading events. This year, the risk of spreading COVID-19 at a holiday gathering is still present—but for many gatherings, it’s much more manageable thanks to vaccines.

    If you’re planning a holiday gathering this year, here are a couple of resources I’d recommend:

    • Upcoming holiday season (Your Local Epidemiologist): In this post, Dr. Katelyn Jetelina goes through a couple of different potential scenarios for holiday gatherings based on vaccine levels. If everyone is fully vaccinated, she writes, “approach the celebration like we did before the pandemic.” If not, more safety layers—such as encouraging new vaccinations, testing, and ventilation—may be useful.  
    • Preparing for the holidays? Don’t forget rapid tests for COVID-19 (Harvard Health Publishing): This article, by Dr. Robert Shmerling, focuses more on the role of COVID-19 tests; Shmerling suggests that holiday hosts may offer rapid tests as guests arrive, or require a PCR test as a prerequesite to the gathering. He acknowledges, however, that rapid tests are currently pricey in the U.S. and come with other caveats.
    • What 5 health experts advise for holiday travel this year (Washington Post): For the unvaccinated, “your recommendations are identical to what they were last year,” Ohio State University’s Iahn Gonsenhauser told WaPo. But for the vaccinated, travel and gatherings are safer; the experts quoted in this article recommend asking about the vaccination status of other holiday guests, packing rapid tests, and making a backup plan in case someone tests positive.

    But even the best resources cannot cover every possible scenario. So, I’d like to open this up for reader questions: What do you want to know about COVID-19 as we head into the 2021 holiday season?

    To send me a question, simply comment below. You can also email me (betsy@coviddatadispatch.com) or hit me up on Twitter or Facebook.

  • National numbers, November 7

    National numbers, November 7

    U.S. COVID-19 cases are in a clear plateau. Chart via the CDC, downloaded on November 7.

    In the past week (October 30 through November 5), the U.S. reported about 490,000 new cases, according to the CDC. This amounts to:

    • An average of 70,000 new cases each day
    • 150 total new cases for every 100,000 Americans
    • 1% fewer new cases than last week (October 23-29)

    Last week, America also saw:

    • 36,000 new COVID-19 patients admitted to hospitals (11 for every 100,000 people)
    • 8,000 new COVID-19 deaths (2.4 for every 100,000 people)
    • 99% of new cases are Delta-caused (as of October 30)
    • An average of 1.8 million vaccinations per day (including booster shots; per Bloomberg)

    At the national level, new COVID-19 cases seem to have entered a plateau. The U.S. has reported about 70,000 new cases a day for the past three weeks; while hospitalization and death numbers continue to go down, those drops are rather slight compared to what we saw earlier this fall.

    Cold-weather states continue to see the highest case rates: Alaska, Montana, North Dakota, and Wyoming are at the top this week, with over 400 new cases for every 100,000 people as of the latest Community Profile Report.

    New Hampshire is now a concerning hotspot as well—the state saw almost a 200% increase in cases from last week to this week. Colorado, Minnesota, New Mexico, and Michigan are also reporting significant increases.

    Throughout the pandemic, trends in the U.S. have often followed trends in Europe, with this country seeing new surges a few weeks after they happen across the Atlantic. And right now, Europe is “at the epicentre” of the pandemic, according to the World Health Organization. Russia and Germany have recently recorded record cases, while other European countries are reinstating safety restrictions. 

    This week, the world marked five million COVID-19 deaths, while the U.S. marked 750,000. Both numbers are almost certainly undercounts, due to under-testing, limited medical record-keeping in some places, and other issues. In the U.S., over 1,000 people continue to die each day despite widely available vaccines.

    Vaccination numbers are going up, though—driven largely by booster shots and by shots for the 5 to 11 age group, now officially eligible. The federal vaccines.gov site has been updated to include vaccination sites for these kids.

    But as we celebrate kids getting vaccinated, it’s important to recognize the global inequities at play here:

  • COVID source callout:  Vaccination rates by Zodiac sign

    COVID source callout: Vaccination rates by Zodiac sign

    In last week’s newsletter, I gave a shout-out to the Salt Lake County Health Department, which posted this novel vaccination data on Twitter:

    The post drew a lot of attention in the COVID-19 data world, including with readers of the COVID-19 Data Dispatch. (Shout-out to the reader who sent me some bonus analysis of vaccinations by Zodiac element!) Unfortunately, additional research into the Salt Lake County Health Department’s data has shown me that the agency’s analysis might not be particularly robust—and I feel it is my journalistic duty to share this with you.

    Here’s the deal. In order to calculate vaccination rates by Zodiac sign, you need two things: vaccinations organized by birthday (your numerator), and the overall population organized by birthday (your denominator). Health departments can easily access the numerator, as it is standard for people to provide their birthdays along with other basic demographic information when they get vaccinated.

    But the denominator is trickier. The average U.S. public health department doesn’t have access to the birthdays of every resident in its jurisdiction; some information might be available from a large hospital system or primary care network, but it wouldn’t be comprehensive. So, for an analysis like the Salt Lake County agency’s, a researcher needs to find a substitute.

    In this case, the researchers used estimates of Zodiac sign representation in the entire U.S. population, apparently calculated in 2012. Not only are these numbers based on birthdays across the entire country (which could be pretty different from the birthdays in one Utah county!), they’re almost ten years old. There’s a lot of distance between these estimates and vaccination numbers among a 2021 Salt Lake City population.

    The public health workers acknowledged that their analysis is “not super scientific” in interviews with the Salt Lake Tribune. Still, the widely-shared Twitter post itself could do with a few more caveats, in my opinion.

    For more on the issues with the Salt Lake County department’s analysis, see this Substack post by Christopher Ingraham.

  • Sources and updates, October 31

    A lot of COVID-19 data sources caught my eye this week!

    • More booster data from the CDC: This week, the CDC added both booster shot trends by day and booster shots by primary series type to its COVID Data Tracker. For booster shot trends, click “People Receiving a Booster Dose” on the Trends page, and for primary series data, scroll down to “Covid-19 Booster Dose Type by Primary Series Type” on the Vaccination Totals page. So far, it looks like a lot of Johnson & Johnson recipients are opting for mRNA boosters.
    • KFF’s latest Vaccine Monitor update: The Kaiser Family Foundation has released the latest edition of its monthly vaccine poll, the COVID-19 Vaccine Monitor. This month’s edition focuses on vaccinations for children ages 5 to 11, in line with the recent discussions around shots for this age group, but it also includes other polling on general vaccination demographics, boosters, mandates, and more.
    • Under-testing in U.S. prisons and jails: A new report from the UCLA Law COVID Behind Bars Data Project explores how insufficient COVID-19 testing of incarcerated people in the U.S. contributes to skewed case rates. Even in the states that have tested their incarcerated populations the most, this report shows, that testing is still far less frequent than testing for other congregate living facilities, like nursing homes.
    • Impact of School Opening on SARS-CoV-2 Transmission: A group of scientists (including school data expert Emily Oster) recently published a new paper in Nature examining how school reopening models—remote, hybrid, or in-person—contribute to community transmission. In most parts of the country, reopening model did not have a significant impact on transmission, they found; the South was an exception. The authors shared the data underlying their paper, with some information from Burbio and the CDC removed due to requirements from those organizations.
    • Reporting recipe for breakthrough case data: Dillon Bergin, my colleague at the Documenting COVID-19 project, wrote this reporting recipe, which guides local newsrooms through acquiring data on and covering breakthrough cases in their areas. The recipe accompanies a recent story that Dillon wrote, in collaboration with the Las Vegas Review-Journal, on breakthrough cases by occupation in Las Vegas. (Unsurprisingly, healthcare workers and casino workers were likely to have breakthrough cases, the Las Vegas data show.)
    • Polling on small businesses and vaccine mandates: Here’s another vaccine survey released this week, this one from the U.S. Chamber of Commerce. The agency asked small businesses about their positions on vaccine mandates, as well as hiring challenges and other issues. 64% of small business owners support “businesses in their area requiring vaccines for their employees,” the survey found.

  • FDA authorizes Pfizer vaccine for younger children

    FDA authorizes Pfizer vaccine for younger children

    The Pfizer vaccine will likely be available to children ages 5 to 11 next week, but many parents are hesitant about getting their kids vaccinated. Chart via the KFF COVID-19 Vaccine Monitor.

    Last week, the Food and Drug Administration (FDA) recommended Pfizer’s COVID-19 vaccine for children ages 5 to 11, under an Emergency Use Authorization. The agency’s vaccine advisory committee met on Tuesday to discuss Pfizer’s application and voted overwhelmingly in favor; the FDA followed this up with an EUA announcement on Friday.

    This coming week, the process continues: CDC’s own vaccine advisory committee will discuss and vote on vaccinating kids in the 5-11 age group, and then the agency will make an official decision. If all goes well—and all is expected to go well—younger kids will be able to get their vaccines in time for Thanksgiving.

    Many of the parents I know have been eagerly awaiting this authorization, but the sentiment is far from universal. COVID-19 vaccinations for kids are incredibly controversial, more so than vaccinations for adults. The public comment section of the FDA advisory committee meeting—in which basically anyone can apply to share their thoughts—was full of anti-vaxxers, many of them sharing misinformation. Even some experts on the FDA advisory committee were not fully convinced that vaccines are needed for all young kids, though all but one eventually voted in favor.

    Now, let me be clear: there are definite benefits to vaccinating younger children. While kids are less likely to have severe COVID-19 cases than adults, the disease has still been devastating for many children. Almost 100 kids in the 5 to 11 age range have died of COVID-19, making this disease one of the top 10 causes of death for this group over the past year and a half.

    Plus, children who get infected with the coronavirus are at risk for Long COVID and MIS-C, two conditions with long-lasting ramifications. There have been about 5,200 MIS-C cases thus far—and the majority of these cases have occurred in Black and Hispanic/Latino children. Minority children are also at much higher risk for COVID-19 hospitalization. 

    Vaccination can prevent children from severe ramifications of a potential COVID-19 case, as well as from the mild infections that lead to missed school and other disruptions. But the FDA committee had to carefully weigh this benefit against potential side effects from vaccination, namely myocarditis—a type of heart inflammation.

    The U.S. system for tracking vaccine side effects has identified a small number of myocarditis cases in children ages 12 to 15 after their second shots of Pfizer or Moderna vaccines. For the meeting this past Tuesday, the FDA presented some models weighing potential myocarditis cases in young kids against vaccination benefits; the models showed that, in almost every scenario, the number of severe COVID-19 cases prevented by vaccination is higher than the myocarditis cases.

    It’s worth noting: in Pfizer’s clinical trial for the 5 to 11 age group, no child had a severe adverse reaction to the vaccine. But the Pfizer researchers did observe five medical events that were unrelated to vaccination—including one kid who swallowed a penny.

    Some of the FDA advisory committee members suggested that perhaps vaccines would be most beneficial for children with underlying medical conditions, who are more susceptible to severe COVID-19. But the committee ultimately voted in favor of vaccines for all kids in the 5 to 11 age group, allowing parents to consult their pediatricians and pursue vaccination if they deem it necessary.

    Polling data suggest that many parents don’t currently deem it necessary, though. The latest survey from the Kaiser Family Foundation found that just 27% of parents with kids in the 5 to 11 age range plan to get their kids vaccinated immediately, once shots are available. 33% intend to “wait and see,” 5% will only pursue vaccination if it’s required by the child’s school, and 30% say “definitely not.”

    Public health experts, pediatricians, and others in the science communication world have a lot of work ahead of us to convey the importance of vaccinating kids—and dispel misinformation.

    Note: this post relies heavily on STAT News’s liveblog of the FDA committee meeting.

    More vaccine coverage