Author: Betsy Ladyzhets

  • NYC’s wastewater program models the challenges facing local public health agencies

    NYC’s wastewater program models the challenges facing local public health agencies

    In 2022, wastewater data in NYC have more accurately reflected COVID-19 spread in the city than case data. See the full story (on MuckRock or Gothamist) for the interactive chart; links are below.

    My second big story this week is a detailed report about New York City’s wastewater surveillance program, highlighting its lack of transparency. You can read the story on Gothamist and/or on MuckRock. I’m particularly excited to share this one with NYC-based readers, as it uncovers a public program that’s been running under our feet for nearly three years.

    Longtime readers might remember that, back in April, I noticed that NYC wastewater data had disappeared from the CDC’s national dashboard. And the city’s data stayed unavailable even when other locations (which were similarly interrupted by the CDC’s switch between wastewater contractors) resumed reporting to the dashboard.

    That observation piqued my curiosity about how, exactly, NYC agencies are testing our wastewater—and what they’re doing with the data. So, I started investigating, with the support of MuckRock and Gothamist/WNYC. My project eventually revealed the answers to my questions: while NYC has set up an impressive, novel program to test all 14 city wastewater treatment plants for COVID-19, the health department doesn’t appear to be taking advantage of these results.

    In a joint statement, NYC’s health and environmental protection agencies said that they still see wastewater surveillance as a “developing field” and are skeptical about its utility for public health. Even though NYC’s program has been running since early 2020 and cost over $1 million. And even though other wastewater programs across the U.S. and internationally have demonstrated the potential of this type of data.

    Here are the story’s main findings, as drafted for MuckRock’s version of the article:

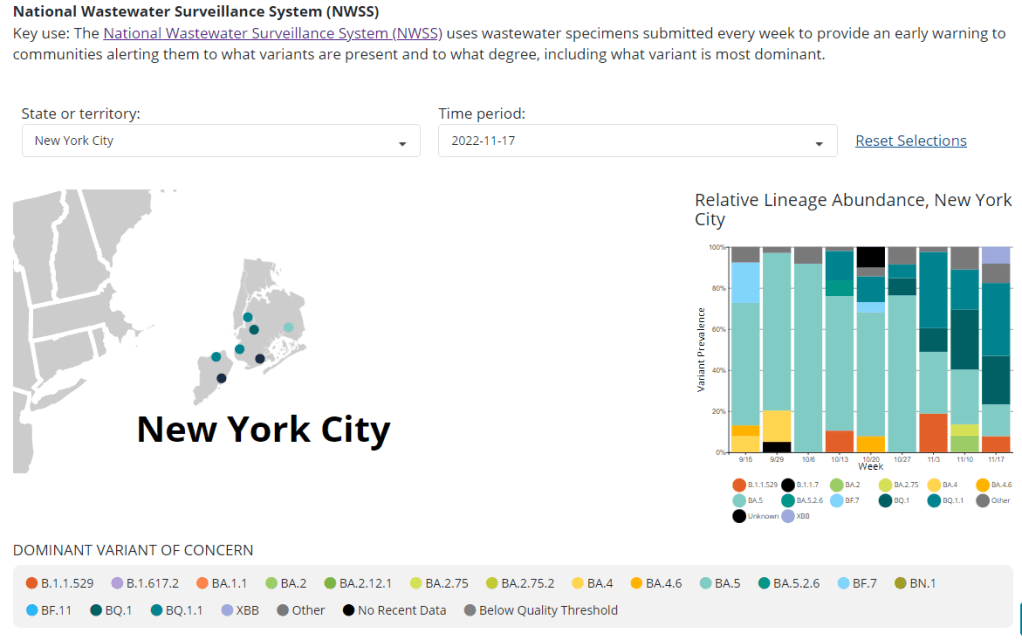
    • New York City’s Department of Environmental Protection created a brand-new program to test city wastewater for COVID-19 in 2020, working with limited lab equipment and personnel to sample from 14 sewage treatment plants across the city. In doing so, the city brushed off assistance offered from “multitudes of academics” and private sector researchers, and set up its program in-house. It has cost more than $1 million over the past three years.
    • But the city didn’t publicly post any wastewater data until January 2022, almost two years after testing started. Unlike other large cities, such as Boston, New York City lacks a public dashboard for wastewater data. The city’s data available on dashboards run by the Centers for Disease Control and Prevention and New York State are often delayed by a week or more, making it less useful for New Yorkers seeking advanced warning about potential new surges.
    • In other parts of the U.S. — and at Columbia University in uptown Manhattan — wastewater surveillance is used for public health strategies, such as encouraging people to get PCR tests or sending extra resources to hospitals before a surge. However, New York City’s health and environmental agencies say they still consider wastewater research a “developing field” and aren’t using it for policy decisions.
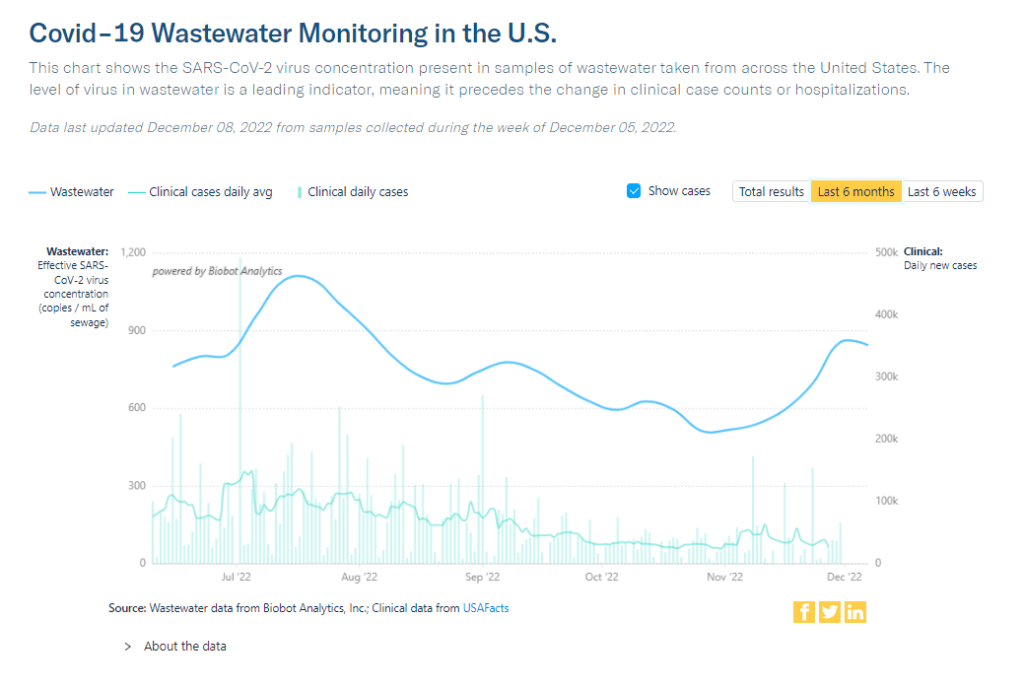
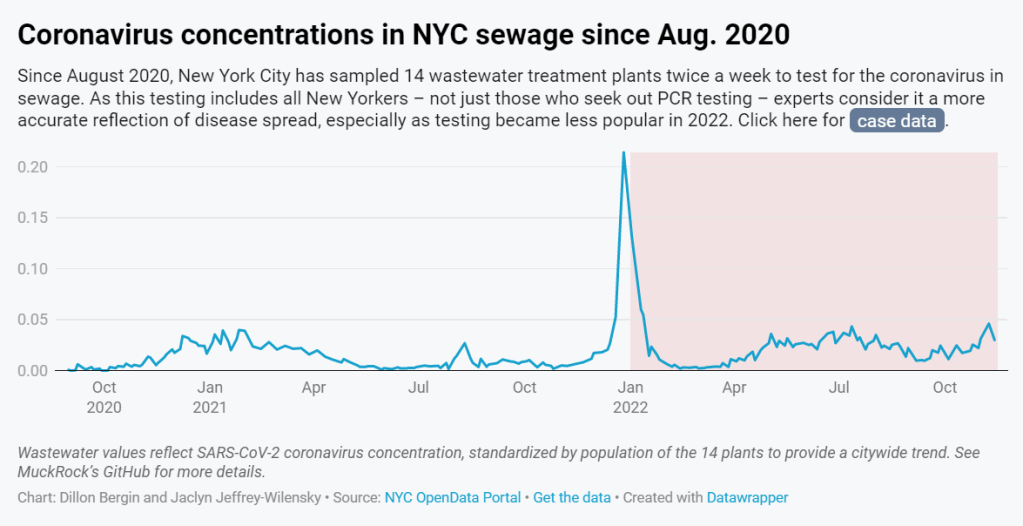
    • In response to our questions, city health and environment agency officials argued that wastewater results “do not generally provide a complete picture” of how COVID-19 is spreading and said, unlike in other parts of the country, trends in city wastewater data tend to align with case counts rather than predicting them. But wastewater has shown a higher level of COVID-19 spread than PCR testing, as the latter became less available in 2022, according to Gothamist and MuckRock analyses. This pattern suggests that the sewage numbers may more accurately reflect actual disease patterns.
    • A bill introduced to the New York City Council in August would make the wastewater surveillance program permanent, expand it to other public health threats as needed, and require the health department to report data on a public dashboard.

    For readers outside NYC, I think this story provides an informative case study of the hurdles that wastewater surveillance for COVID-19 (and other diseases) will need to clear.

    First, you have the resource challenges. If the NYC Department of Environmental Protection, which oversees the largest municipal water network in the country, had a hard time getting equipment and personnel for testing—imagine the challenges facing small, rural public health departments.

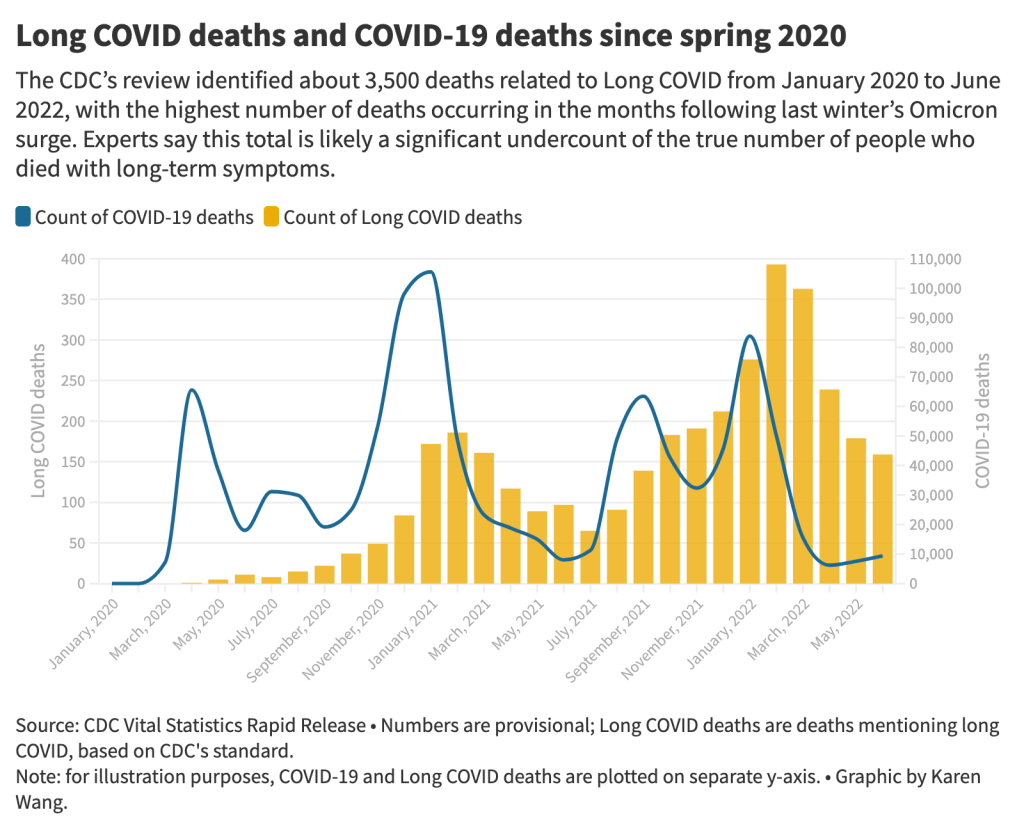
    Next, after testing is set up, you have to interpret the data. NYC’s health department seems to be somewhat stuck on this step, with no public dashboard and its insistence that city residents should look at clinical case data—which we know are a significant undercount of true infections—rather than wastewater data. To be fair, wastewater data are new terrain for public health experts, with a lot of analytical issues. (See my MuckRock/FiveThirtyEight story from the spring for more details on this.)

    And finally, you have to communicate the data. How do you share wastewater results with the public in a way that is clear, real-time, local—and acknowledging necessary caveats? This is a tough challenge that health agencies across the U.S. are just starting to tackle, in tandem with the private companies that work on wastewater analysis.

    As I said in the radio story accompanying my piece, I hope that, someday, we can get wastewater surveillance updates as easily and regularly as we get weather updates. That future feels a long way off right now, but I intend to keep reporting on the journey in 2023.

    If you live somewhere with a thriving (or faltering) wastewater surveillance program, reach out and tell me about it!

    More on wastewater data

  • New CDC report vastly underestimates deaths with Long COVID

    New CDC report vastly underestimates deaths with Long COVID

    The 3,500 Long COVID-related deaths identified by the CDC’s review of death certificates are likely a significant undercount of mortality caused by this condition, experts say. Chart by Karen Wang; see the interactive version on MuckRock.

    On Wednesday, the CDC’s National Center for Health Statistics (NHCS) released a major report on deaths from Long COVID. To identify a small (but significant) number of deaths, NCHS researchers searched through the text of death certificates for Long COVID-related terms. Their study demonstrates how bad our current health data systems are at capturing the results of chronic disease.

    My colleagues and I at MuckRock did a similar analysis to the CDC’s, searching death certificate data that we received through public records requests and partnerships in Minnesota, New Mexico, and counties in California and Illinois. You can read our full story here and explore the death certificate data we analyzed on GitHub.

    Here are the main findings from both analyses:

    • The CDC study is an important milestone in recognizing the reality of Long COVID: this is a serious, chronic disease that can lead to death for some patients. It’s not just an outcome of acute COVID-19.
    • From its national death certificate search, NCHS identified 3,544 deaths with Long COVID as a cause or contributing factor. This is almost certainly a major undercount, experts told me (and told other reporters who wrote about the study.)
    • This number is an undercount because we’re essentially seeing two poor-quality data systems intersect. Long COVID is undercounted in clinical settings because we lack standard diagnostic tools and widespread medical education about it—most doctors wouldn’t think to put it on a death certificate as a result. And the U.S.’s death investigation system is uneven and under-resourced, leading to inconsistencies in tracking even well-known medical conditions.
    • On top of these problems, when Long COVID is diagnosed, it tends to be among people who had severe cases of acute COVID-19 followed by difficulty recovering, experts told me. David Putrino and Ziyad Al-Aly, two leading Long COVID researchers, both pointed to the NCHS’s trend towards identifying Long COVID deaths among older adults (over age 75) as an example of this pattern in action, since this group is at higher risk for more severe acute symptoms.
    • The NCHS count of deaths thus misses Long COVID patients with symptoms similar to myalgic encephalomyelitis/chronic fatigue syndrome (ME/CFS), which often arises after a milder initial case. It also misses people who have vascular impacts from a COVID-19 case, like a premature heart attack or stroke months after infection—something Al-Aly and his team have studied in depth. And, crucially, the NCHS count misses people who died from suicide, after suffering from severe mental health consequences of Long COVID.
    • While the NCHS count of Long COVID deaths is far too low to be accurate, the researchers did find more deaths as the pandemic went on—with the highest number in February 2022, following the first Omicron surge. This pattern could suggest increased recognition of Long COVID among the medical community.
    • The NCHS primarily identified Long COVID deaths among white people, even though acute COVID-19 has disproportionately impacted people of color in the U.S. Experts say this mismatch could reflect gaps in access to a diagnosis and care for Long COVID: if white people are more likely to be seen by a doctor who can accurately diagnose them, they will be overrepresented in Long COVID datasets. Putrino called this “a health disparity on top of a health disparity.”
    • MuckRock’s analysis of death certificate data in select states similarly found that most deaths labeled as Long COVID were among seniors and white people. The trends varied by state, though, reflecting differences in populations and in local death reporting systems. For example in New Mexico, which has a statewide medical examiner’s office (rather than a looser system of county coroners), three-fourths of the Long COVID deaths were among Hispanic or Indigenous Americans.
    • Our story also includes details about the RECOVER initiative’s autopsy study, which aims to use extensive postmortem testing on people who might have died from acute COVID-19 or Long COVID to identify biological patterns. Like the rest of RECOVER, this study is moving slowly and facing logistical challenges: about 85 patients have been enrolled so far, an investigator at New York University said.

    Overall, the NCHS study suggests an urgent need for more medical education about Long COVID, especially as the CDC works to implement a new death code specific to this chronic condition. We also need broader outreach about the consequences of Long COVID. To quote from the story:

    “Institutions like the CDC should do more to educate people about the long-term problems that could follow a COVID-19 case, said Hannah Davis, the patient researcher. “We need public warnings about risks of heart attack, stroke and other clotting conditions, especially in the first few months after COVID-19 infection,” she said, along with warnings about potential links to conditions like diabetes, Alzheimer’s and cancer.

    And we need other methods of studying Long COVID outcomes that don’t rely on a deeply flawed death investigation system. These could include studies of excess mortality following COVID-19 cases, Long COVID patient registries that monitor people long-term, and collaborations with patient groups to track suicides.

    For any reporters and editors who may be interested, MuckRock’s story is free for other outlets to republish.

    More Long COVID reporting

  • National numbers, December 18

    National numbers, December 18

    Biobot’s wastewater surveillance data suggest that COVID-19 spread is trending down in the West coast and plateauing in other regions. Data as of December 15.

    In the past week (December 8 through 14), the U.S. reported about 460,000 new COVID-19 cases, according to the CDC. This amounts to:

    • An average of 65,000 new cases each day
    • 139 total new cases for every 100,000 Americans
    • 3% fewer new cases than last week (December 1-7)

    In the past week, the U.S. also reported about 35,000 new COVID-19 patients admitted to hospitals. This amounts to:

    • An average of 5,000 new admissions each day
    • 10.7 total admissions for every 100,000 Americans
    • 2% more new admissions than last week

    Additionally, the U.S. reported:

    • 2,700 new COVID-19 deaths (390 per day)
    • 69% of new cases are caused by Omicron BQ.1 and BQ.1.1; 5% by BF.7; 7% by XBB (as of December 17)
    • An average of 250,000 vaccinations per day (CDC link)

    After a significant post-Thanksgiving spike, COVID-19 transmission in the U.S. appears to be in a high plateau, according to trends in cases and wastewater. Official case counts stayed fairly steady this week compared to the week following the holiday, according to the CDC, while wastewater data from Biobot show coronavirus concentrations leveling out.

    COVID-19 hospital admissions are similarly at a high plateau: about 5,000 new people with COVID-19 were admitted to hospitals every day last week, per the CDC. That’s a 2% increase from last week.

    Going beyond the national trends, though, we see that some places are experiencing dips in COVID-19 spread while others are spiking. In Boston, for example, wastewater data suggest that COVID-19 is at its most prevalent since the surge in early summer. Across the country in Los Angeles, coronavirus levels in wastewater are trending down after increasing through November.

    New York and New Jersey had the highest official COVID-19 case rates in the last week, according to the latest Community Profile Report, followed by Illinois, California, and Rhode Island. But these data may be more a product of which states still have somewhat-available PCR testing than actual case comparisons.

    And even in places where COVID-19 is declining, the combined threat of this virus, flu, and RSV is still putting a lot of strain on healthcare systems. Take Los Angeles: while it might not be seeing record COVID-19 cases, the city currently has fewer free hospital beds available than at any other point in the pandemic, per reporting by the Los Angeles Times.

    Flu might be peaking in some parts of the country, Helen Branswell wrote in STAT on Friday, based on CDC data. But it’s still early in the typical flu season, and hard to tell how COVID-19 and the flu (and RSV) might impact each other.

    As we gear up for another week of holiday travel and gatherings—and as highly contagious Omicron subvariants, the BQs and XBB, continue to outcompete other versions of the virus—this is an important time to take all possible safety precautions.

    That includes getting your flu shot and the new Omicron-specific COVID-19 booster, which further CDC studies have shown is highly effective at preventing hospitalization. And it includes masking, testing before and after events, and gathering outdoors (or otherwise improving ventilation) to reduce your risk of spreading all kinds of viruses.

  • Sources and updates, December 11

    • 2022 America’s Health Rankings released: This week, the United Health Foundation released its 2022 edition of America’s Health Rankings, a comprehensive report providing data for more than 80 different health metrics at national and state levels. The 2022 report includes new metrics tailored to show COVID-related disparities; for example, Black and Hispanic Americans had higher rates of losing friends and family members to COVID-19 compared to other groups. I’ve used data from past iterations of this report in stories before, and I’m looking forward to digging into the 2022 edition.
    • FDA authorizes bivalent boosters for young kids: This week, the FDA revised the emergency use authorizations (EUAs) of both Pfizer’s and Moderna’s updated, Omicron-specific booster shots to include children between six months and five years old. Kids who previously got two shots of Moderna’s vaccine for this age group can receive a bivalent booster two months later, while kids who got two shots of Pfizer’s vaccine can receive a bivalent booster as their third dose. (Remember, Pfizer’s vaccine for this age group includes three doses.) The updated EUAs will help protect young children from Omicron infection, though uptake will likely be low.
    • CDC updates breakthrough case data: Speaking of the updated boosters: the CDC recently added data on these shots to its analysis of COVID-19 cases and deaths by vaccination status. In September, people who had received a bivalent, Omicron-specific boosters had a 15 times lower risk of dying from COVID-19 compared to unvaccinated people; and in October, bivalent-boosted people had a three times lower risk of testing positive compared to the unvaccinated. The CDC will update these data on a monthly basis.
    • Director Walensky discusses authority challenges: One bit of coverage from the Milken Future of Health Summit that caught my attention: CDC Director Dr. Rochelle Walensky talked about the agency’s limitations in collecting data from states, reports Rachel Cohrs at STAT News. Walensky specifically highlighted the challenges that the CDC might face in collecting data when the public health emergency for COVID-19 ends, something I’ve previously covered in this publication.
    • Boston establishes neighborhood-level wastewater testing: Finally, one bit of wastewater surveillance news: the city of Boston is setting up 11 new sites to test wastewater, giving local public health officials more granular information about how COVID-19 is spreading in the region. The new initiative is a partnership with Biobot Analytics, the same wastewater testing company that has long worked with Boston, the CDC, and public health institutions across the country. (Boston was one of the first cities to start doing this testing.) Also, speaking of Biobot: the company just added a nice chart of coronavirus variants in U.S. wastewater over time to its dashboard.

  • Data implications of China ending its zero-COVID policies

    Data implications of China ending its zero-COVID policies

    As China rolls back on COVID-19 safety measures, its rising case load is likely to shoot up further. Chart from Our World in Data.

    China has rolled back some of its most rigorous COVID-19 safety policies, essentially moving away from its “zero COVID” strategy, following recent protests. I am no expert on China’s political or health policies here, but I did want to share some reflections on what this rollback could mean for global COVID-19 data, citing from Katherine Wu’s recent story in The Atlantic.

    First of all, it’s important to note that we don’t have much information about coronavirus variants circulating in China. According to the global database GISAID, China has submitted a total of just 667 Omicron sequences—compared to nearly two million from the U.S. The country’s most recent sample was submitted on November 29, almost two weeks ago. Some reports, like this one in the Global Times, suggest that Omicron BF.7 is the dominant variant in Beijing, but the pattern could be different in other parts of the country.

    Without more data, it’s hard to say for sure. And this is concerning because, if a new variant evolves in China as the virus spreads more widely there in the coming weeks, it could take more time for the rest of the world to learn about it than if a new variant emerged in other countries. Quick responses and international collaboration have been crucial in responses to new variants over the last two years; the global scientific community needs to be prepared to study and adapt to any new variant that might come out of China.

    At the same time, China’s case data are going to become less reliable as the country reduces its clinical testing. Daily case numbers have already appeared to drop, per Our World in Data, but this could be a product of less testing for asymptomatic people (and/or data delays) rather than a surge actually turning around. I also noted that Our World in Data does not have any testing numbers for China more recent than April 2022.

    China is already more limited at sharing COVID-19 data than other countries. But if case numbers become less reliable, it will get harder for international health experts to keep tabs on how bad China’s surge is getting. And it could get very bad: one modeling analysis, published in Nature in May, found that an unchecked Omicron wave in the country could lead to demand for intensive care units at 15.6 times the country’s current capacity—and 1.55 million deaths.

    Based on its current healthcare system, China is not prepared for a massive national surge of severe COVID-19 cases. It’s probably even less prepared for the massive surge of Long COVID cases that could follow. This has implications for global health, economics, and more.

    From the last paragraph of Wu’s great article:

    Even without a spike in severe disease, a wide-ranging outbreak is likely to put immense strain on China—which may weigh heavily on its economy and residents for years to come. After the SARS outbreak that began in 2002, rates of burnout and post-traumatic stress among health-care workers in affected countries swelled. Chinese citizens have not experienced an epidemic of this scale in recent memory, Chen told me. “A lot of people think it is over, that they can go back to their normal lives.” But once SARS-CoV-2 embeds itself in the country, it won’t be apt to leave. There will not be any going back to normal, not after this.

    More international data

  • Answering reader questions about data interpretation, good masking

    Answering reader questions about data interpretation, good masking

    As this chart from Biobot shows, trends in wastewater and case data often look a bit different. But how do you compare wastewater numbers to true infection numbers?

    This week, I’m sharing answers to three questions from readers that came in recently, through emails and the COVID-19 Data Dispatch Google form. The questions discuss interpreting wastewater and case data, and an interesting masking conundrum.

    Q1: Comparing wastewater trends to case trends

    I would love to know if there is any data on what levels of COVID in wastewater equals what risk level—are there any guidelines that could be used to turn masking policies on or off, for example? We know going up is bad and that the data is noisy but, if there’s any information on what concentrations in sewage corresponds to what level of cases I would love to know.

    I would love to be able to point you to specific guidelines about matching wastewater levels to cases, but unfortunately this isn’t really available right now. And if it were available, you would likely need to tailor the analysis pretty closely to where you live.

    An ongoing challenge with using wastewater surveillance data, as I wrote about for FiveThirtyEight and MuckRock in the spring, is that this type of environmental information is categorically pretty different from traditional case data. When a public health agency provides case numbers, they are adding up results from tests done in hospitals, doctors’ offices, and other healthcare settings. Each test result generally represents one person and can be interpreted with that framework.

    But with wastewater data, figuring out exactly what your test results represent can be more complicated. The data generally include people sick with COVID-19 who shed the coronavirus in their waste, but different people might shed different amounts of virus depending on what stage of illness they’re at, the severity of their symptoms, and possibly other factors that scientists are still working to figure out. Environmental factors like a big rainstorm or runoff from nearby agriculture could also interfere with the data. Population shifts, like college students returning to their campus after a break, can cause noise, too.

    As a result, public health experts who interpret wastewater data generally need a lot of data—like, a year or more of testing’s worth of data—from a specific location in order to analyze how wastewater trends correlate with case trends. And the data has to be consistent; if your wastewater collection team switches their sample processing methods halfway through the year, that might interrupt the analysis.

    A few institutions have figured out the wastewater-to-cases correlation for their communities. For examples, see the section on San Diego in this story and this paper by researchers in Gainesville, Florida. But for most research groups and health departments, it’s still a work in progress.

    All of that said, I don’t think this complexity should stop individuals or organizations from using wastewater data to recommend turning mask policies (or other policies) on or off. This surveillance might be less precise, but a sustained increase in coronavirus concentrations in the sewer is still certainly cause for concern and can be used to inform public health guidance.

    Q2: Estimating case underreporting

    How do you estimate how undercounted COVID testing is? Asking because I work for Whentotest.org—our COVID Risk Quiz assumes that COVID testing is undercounted by 7x, but I believe I’ve seen you estimate that it could be undercounted by as much as 20x. Wondering how you get to that number—we want to keep our Quiz as up to date as possible, and that number is a moving target.

    It is definitely a moving target, since COVID-19 testing (especially the lab-based PCR testing that generally contributes to official case numbers) can go up or down depending on people’s access to tests, perceptions of how much transmission is going on, and so many other factors.

    That said, I would personally put undercounting in the 10 times to 20 times range for this fall, likely with different levels of undercounting for different locations. I have two sources for the 20 times number: the first is an estimate from the Institute for Health Metrics and Evaluation made in September, suggesting that 4% to 5% of infections in the U.S. were reported at that time. (If 5% of infections are reported, case counts are 20 times higher than reported cases.)

    My second source is a paper from epidemiologist Denis Nash and his team at the City University of New York, released as a preprint earlier this fall. The researchers surveyed a representative sample of 3,000 U.S. adults, finding that about 17% of the respondents had Omicron during a two-week period in the summer BA.5 surge. Extrapolating from the survey findings, the researchers estimated that about 44 million people across the country had COVID-19 in this timeframe—compared to 1.8 million reported cases. This estimate suggests reported cases were undercounted by a factor of 24.

    Unfortunately, I have to use months-old estimates here because the U.S. does not have a regular data source comparing cases to true infections. The Census and CDC’s Household Pulse Survey comes close to this, as it includes questions about whether survey respondents have recently received a COVID-19 diagnosis; but it doesn’t ask about rapid tests, recent exposure, or other factors needed to determine the true infection rate, so the numbers here are also underestimates.

    Personally, I keep a close eye out for survey studies like those done by Nash and his team at CUNY and use those results to inform how I interpret national case data. I’ll make sure to flag any future studies like this for readers.

    Q3: Nose-only masking

    I follow some masking subs on Reddit and folks periodically suggest to others or refer to hacking masks that only cover their nose (KN95, N95s, etc.) for dental appointments or unavoidable indoor eating scenarios. Assuming they’re successful in creating a proper seal for these “half masks,” would there actually be any scientific backing this is helpful in minimizing risk?

    I wasn’t sure how to answer this question, so I shared it on Twitter, tagging a couple of masking and ventilation experts I know.

    Overall, the consensus that emerged from my replies is that it could be helpful to wear a mask over one’s nose for short periods of time, but it’s hard to say for sure due to a lack of rigorous research in this area. Behavior also plays a big role in how effective such a mask might be in alleviating risk.

    One expert, Devabhaktuni Srikrishna, pointed out that having a sealed filter over one’s nose could reduce the amount of virus that gets inhaled, if the coronavirus is present in the space. (This “inhalation dose” might correlate with one’s chances of infection and/or severity of symptoms if infected, though research is still ongoing on these questions.)

    Achieving a sealed filter over the nose is easier said than done, though. You can’t just use a standard mask, since that’s designed for the nose and mouth. One commenter shared a system that he uses, an elastomeric nose mask held in place with a headband. Another suggested using nasal filters designed to block allergens. As far as I know, there hasn’t been any research showing what might be most successful—unlike the extensive research that has gone into showing the value of high-quality face-masks and respirators.

    In addition to the discussion of designing a nose-only mask, this reader’s question led to some discussion about the careful behavior needed to use it successfully. One commenter pointed out that, if you’re eating alone, it’s easier to stay focused on breathing patterns than if you’re eating in a group and engaged in conversation. I also appreciated this reply from a Louisiana-based behavioral scientist:

    So, to summarize, I’d say that a nose filter could be helpful for situations like a dentist appointment and could be helpful (but trickier) for indoor dining—but it’s hard to say for sure. A much easier conclusion: avoid indoor dining as much as possible during COVID-19 surges like the one we’re in right now.

    More reader responses

  • National numbers, December 11

    National numbers, December 11

    The CDC’s influenza-like illness map shows that the vast majority of the country is facing either high or very high levels of respiratory disease.

    In the past week (December 1 through 7), the U.S. reported about 460,000 new COVID-19 cases, according to the CDC. This amounts to:

    • An average of 66,000 new cases each day
    • 140 total new cases for every 100,000 Americans
    • 50% more new cases than last week (November 24-30)

    In the past week, the U.S. also reported about 34,000 new COVID-19 patients admitted to hospitals. This amounts to:

    • An average of 4,800 new admissions each day
    • 10.3 total admissions for every 100,000 Americans
    • 14% more new admissions than last week

    Additionally, the U.S. reported:

    • 3,000 new COVID-19 deaths (430 per day)
    • 68% of new cases are caused by Omicron BQ.1 and BQ.1.1; 6% by BF.7; 4% by BN.1;  5% by XBB (as of December 10)
    • An average of 300,000 vaccinations per day

    It’s now undeniable that Thanksgiving led to a jump in COVID-19 spread: officially-reported cases went up 50% this past week compared to the week of the holiday, following the trend that we first saw in wastewater data. Hospital admissions for COVID-19 also continue to go up.

    As always, it’s important to remember that official case counts are significantly underreported, due to dwindling access to (and interest in) PCR testing. So, the CDC’s estimate of 66,000 new COVID-19 cases each day likely amounts to over a million actual new infections each day. And that’s adding to the surges of flu, RSV, and other respiratory viruses already going strong.

    “Levels of flu-like illness, which includes people going to the doctor with a fever and a cough or sore throat, are at either high or very high levels in 47 jurisdictions,” CDC Director Dr. Rochelle Walensky said at a media briefing last Monday. That “flu-like illness” metric, shown on the CDC’s flu dashboard, is primarily used as an estimate of flu cases, but in our era of under-testing it likely includes COVID-19 and other viruses with similar symptoms.

    Dr. Walensky said that current hospitalizations for flu are the highest they’ve been in a decade for this time of year, indicating that the U.S. is having a bad flu season earlier in the winter than usual. According to Inside Medicine, flu hospitalizations actually overtook COVID-19 hospitalizations for the first time in the pandemic recently; though this trend could reverse as COVID-19 spreads more.

    The flu surge could peak and give us a milder January, or it could continue to go up from here—it’s currently hard to say. Flu vaccination rates have been low this year, which doesn’t help. CDC officials highlighted the benefits of both the flu vaccine and the updated COVID-19 booster shots at their briefing on Monday.

    Those updated COVID-19 boosters offer better protection against Omicron infection than prior vaccines, as real-world data has demonstrated. That should include protection against BQ.1 and BQ.1.1, the descendants of Omicron BA.5 that are currently causing the majority of cases in the U.S.—about 68% of new cases in the week ending December 10, per the CDC. XBB, the BA.2 subvariant that led to surges in Asian countries, is on the rise.

    Last week, wastewater data from Biobot showed a steep increase in COVID-19 spread. This week, the company’s dashboard suggests that this surge may have already peaked in some parts of the country. Was Thanksgiving the start of a major winter wave, or was it more of a holiday blip? Future weeks of data will help answer this.

  • COVID source shout-out: Variant data from wastewater

    COVID source shout-out: Variant data from wastewater

    New York City is one of a few jurisdictions contributing variant sequencing data from wastewater to CDC NWSS.

    I recently learned that the CDC is publishing a limited amount of variant surveillance data from its National Wastewater Surveillance System (NWSS).

    While NWSS is mostly focused on tracking coronavirus concentrations in wastewater as a proxy for transmission patterns, about 100 sites in the national network are also sequencing their wastewater samples and providing variant data. These data are available on the “Variant Summary” page of the CDC’s COVID Data Tracker, along with data from the CDC’s clinical specimen and traveler surveillance systems.

    The NWSS variant data is not very representative of the entire country (as a relatively small number of jurisdictions are sending the CDC this information), but this is still a helpful starting point for expanding wastewater surveillance to include sequencing. I hope to see this program expand in the coming months.

  • Sources and updates, December 4

    • CDC awards $3 billion to improve public health infrastructure: The CDC announced this week that it has awarded state and local public health agencies a total of $3.2 billion to support hiring and training new workers, along with other infrastructure needs. The agency published a breakdown of all the agencies that received awards, although it has not included specific details on what funds will be used for in each place. Local reporters, if your health department received funding, this might be worth looking into!
    • CDC expands wastewater testing for polio: Another notable CDC announcement this week: the agency is expanding its wastewater surveillance for polio to two new areas, Oakland County, Michigan and Philadelphia. Testing wastewater for polio is more complicated than testing it for the coronavirus, as STAT News’ Helen Branswell explains in this article; as a result, the CDC is expanding this surveillance in a more limited capacity than what it’s doing for other viruses, like monkeypox and the flu.
    • Majority of COVID-19 deaths are now among vaccinated people: A new report from the Kaiser Family Foundation explains why more than 50% of COVID-19 deaths in the U.S. in recent months were among people who had received at least two vaccine doses. According to KFF, factors driving this trend include the rising share of Americans who are vaccinated, waning protection from initial doses, and low uptake of booster shots—particularly of the Omicron-specific boosters that provide better protection against newer variants. More reason to get the new booster if you haven’t yet!
    • Paid sick leave correlates with higher vaccination rates: Speaking of vaccination: a new study from researchers at Drexel University and Boston University found that large U.S. cities with city-wide paid sick leave policies had higher vaccination rates than those without such policies. The correlation was particularly evident in neighborhoods with higher social vulnerability, the researchers found. Expanding paid sick leave could help reduce inequities in vaccination coverage, the paper’s authors recommend.
    • No monoclonal antibody drugs are currently authorized in the U.S.: This week, the FDA announced that bebtelovimab, a monoclonal antibody made by Eli Lilly, is no longer authorized for COVID-19 treatments in the U.S. The drug was designed based on older versions of the Omicron variant and doesn’t perform well against BQ.1 and BQ.1.1, the sublineages that are currently causing the majority of new cases in the U.S. As a result, no monoclonal antibodies are currently authorized, though Paxlovid and other treatments are still available.

  • COVID-related nonprofits taking donations this holiday season

    Last week, in response to my call for donations to the COVID-19 Data Dispatch, I received some very generous support from readers. Thank you to everyone who donated—you are truly helping me keep this a free, accessible publication for anyone following COVID-19 news.

    Following up on last week’s post, I wanted to share some suggestions for other COVID-related organizations that are taking donations this holiday season. If you have the resources and are looking for places to donate, please consider these nonprofits!

    • Body Politic, which runs one of the foremost Long COVID online support groups, is seeking donations to transition from a grassroots, all-volunteer organization to a format that’s more sustainable in the long-term. Their funding goal is $500,000.
    • The COVID-19 Longhauler Advocacy Project seeks donations to support its work advancing Long COVID research and supporting patients. Like Body Politic, this organization was founded by volunteers themselves dealing with Long COVID.
    • Marked by COVID is a nonprofit advocacy organization, also volunteer-run, seeking recognition of the Americans who lost their lives to COVID-19 and improved public health policies in the U.S.
    • Peste Magazine is a new online magazine focused on health journalism, advocacy, and the arts. The publication’s work so far has focused on COVID-19 but also includes other health justice topics; donations help to support payments for writers.
    • ME Action is a leading advocacy organization for people with myalgic encephalomyelitis/chronic fatigue syndrome (ME/CFS), a chronic condition that shares many symptoms with (and is often co-diagnosed with) Long COVID. Since the pandemic started, it’s also been involved with Long COVID advocacy.
    • Solve ME/CFS is another advocacy organization for ME/CFS and now Long COVID, focused particularly on funding and supporting research on these conditions.
    • Dysautonomia International is a leading advocacy group for dysautonomia, an umbrella term for conditions involving a malfunctioning autonomic nervous system. Similar to ME/CFS, dysautonomia is often a co-diagnosis for Long COVID.
    • Your local mutual aid group: Early in the pandemic, hundreds of mutual aid groups started across the country to help share food and other supplies with people in need. Some of them are still doing this important work! Websites like Mutual Aid Hub and this NYC directory can help you find a group in your area. 

    Disclaimer: This is not sponsored content, these recommendations come from my own research and reporting on COVID-19. If you’d like to recommend another organization, let me know and I’ll include it in a future issue.