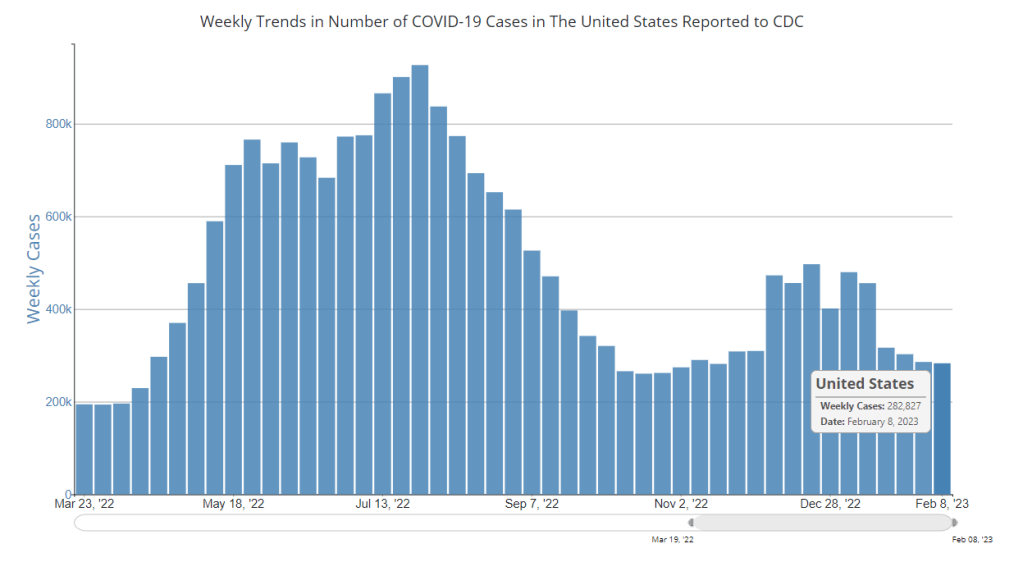
In the past week (February 9 through 15), the U.S. officially reported about 260,000 new COVID-19 cases, according to the CDC. This amounts to:
An average of 37,000 new cases each day
79 total new cases for every 100,000 Americans
8% fewer new cases than last week (February 2-8)
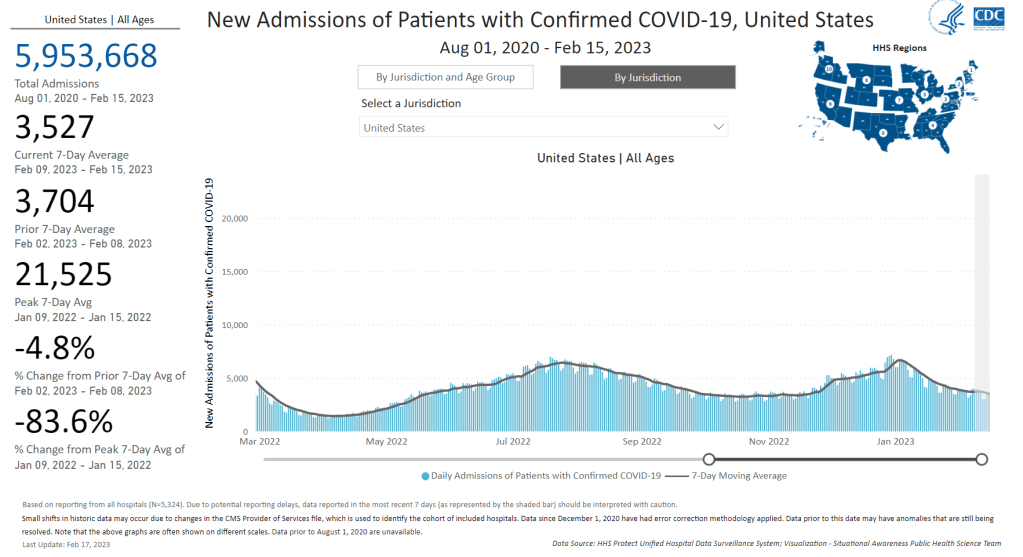
In the past week, the U.S. also reported about 25,000 new COVID-19 patients admitted to hospitals. This amounts to:
An average of 3,500 new admissions each day
7.5 total admissions for every 100,000 Americans
5% fewer new admissions than last week
Additionally, the U.S. reported:
2,800 new COVID-19 deaths (400 per day)
80% of new cases are caused by Omicron XBB.1.5; 16% by BQ.1 and BQ.1.1; 1% by CH.1.1 (as of February 18)
An average of 70,000 vaccinations per day
Nationally, official COVID-19 cases and hospitalizations continue to trend slowly downward, suggesting that we’re in a high plateau of consistent virus spread. Reported cases have only declined by about 18% in the last month, while new hospital admissions have declined by 28%.
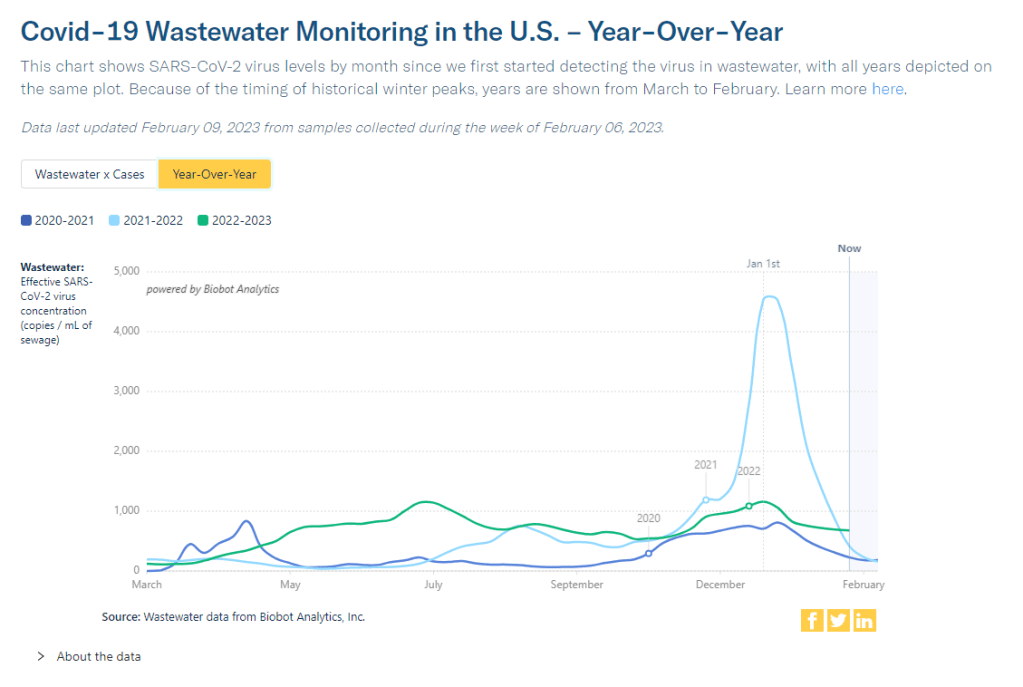
Wastewater surveillance data from Biobot also continue to indicate that COVID-19 spread has plateaued nationally, with slightly different trends at the regional level: a potential uptick in the Northeast, a trend back down in the Midwest, and slight declines in the West and South.
At the state level, some Midwest states continue to report increases in their COVID-19 cases and hospitalizations. These states include: Wyoming, Alaska, Montana, Utah, Nebraska, Michigan, and Missouri. (Though the wastewater decline could indicate that these trends in clinical case data may turn around soon.)
As I pointed out last week, the current COVID-19 plateau is unique from what the U.S. experienced around this time in 2022 and 2021. In both of those years, virus spread declined significantly after a winter surge, leading to relatively low levels in the spring. But this year, the decline has been shorter and has stopped earlier, leaving us with continued high COVID-19.
Biobot’s communications team pointed out on Twitter recently that the national average of coronavirus concentrations in wastewater is “about 60% higher than it was at this time in 2022” and “almost two times what it was at this time in 2021.”
Why isn’t transmission declining more? The XBB.1.5 could be playing a role here, as it spreads further across the country. This highly-contagious version of Omicron accounted for about 80% of new cases in the U.S. last week, according to the CDC’s estimates, and is now heavily dominant in almost every region of the country.
But I suspect a bigger culprit here is likely the complete lack of COVID-19 safety protocols right now. In spring 2021, first-round vaccines and continued non-pharmaceutical interventions played a big role in preventing disease, while in 2022, the U.S. had a lot of immunity from vaccinations and the recent, massive Omicron BA.1 surge, combined with some continuation of other measures. (Though that immunity quickly faded when BA.2 came on the scene.)
Now, we have less population immunity, less non-pharmaceutical interventions, and less overall awareness of the continued problems posed by COVID-19. This broad apathy towards the coronavirus hides the fact that over 400 people are still dying from this disease every day.
Biobot provides wastewater testing and analysis for more than 400 sites in the NWSS network, accounting for about one-third of the system’s total 1,200 sites. The CDC/Biobot arrangement basically makes it easy for these wastewater treatment plants to participate in COVID-19 and mpox testing, since sites can send in samples without spending the time and resources needed to build up their own testing programs.
I was glad to see this news, as the continued contract will mean no interruptions in CDC NWSS data for at least another six months. Long-time readers might remember that there were major wastewater data gaps last spring, when the CDC switched contractors from LuminUltra to Biobot.
Of course, six months is far from the long-term investment that the U.S. should be making in wastewater surveillance… but that’s a topic for another week.
CDC committee recommends adding COVID-19 to childhood vaccine schedule: The CDC’s Advisory Committee on Immunization Practices (ACIP), which makes guidance on vaccination policies, issued a report this week recommending that COVID-19 vaccines be added to the standard childhood immunization regimen. Under the new guidelines, most children ages six months and older should receive two doses of a Moderna or Pfizer vaccine, followed by a bivalent/Omicron-specific booster shot. Immunocompromised children are eligible for additional doses.
KFF’s latest COVID-19 Vaccine Monitor focuses on winter surge: The Kaiser Family Foundation recently released the January 2023 update of its Vaccine Monitor project, which tracks U.S. sentiment around COVID-19 vaccines (and other pandemic topics) over time. In the latest round of surveys, KFF researchers found that about 38% of U.S. adults reported that “their households experienced either COVID-19, the flu, or RSV over the past month or so.” About 46% of adults reported that the news of these viruses made them more likely to take safety precautions. The report also includes data on bivalent booster shot uptake, behavior among immunocompromised people, and more.
New variants have yet to emerge from China, study suggests: A new paper from researchers at the Beijing Center for Disease Prevention and Control, published in The Lancet this week, found that COVID-19 cases in China during November and December 2022 were primarily driven by the Omicron subvariants BA.5.2 and BF.7. Both of these lineages entered China from other countries, rather than evolving during the country’s surge following the end of its “zero COVID” policies. The new paper is good news for global health experts who’ve been worried about new variants emerging from China, though outside reviewers have cautioned that it’s only one small snapshot of cases in the country, according to reporting by POLITICO EU.
Wastewater surveillance has a global health equity problem: Another study that caught my attention this week was a paper from the COVIDPoops19 team at the University of California Merced, summarizing findings from their global wastewater dashboard. The team reviewed wastewater surveillance projects at over 200 universities, 1,400 sites, and 55 countries, and found that monitoring primarily occurred in high-income countries. The researchers also examined open access to data, finding that high-income countries were better at sharing information with researchers and with the public. For wastewater-based epidemiology to reach its full potential, “show us the data,” the team writes in their paper’s abstract.
Microbiome research shows promise for understanding ME/CFS: In one more piece of research news: two recent studies suggest that the gut microbiome could play a role in causing myalgic encephalomyelitis/chronic fatigue syndrome (ME/CFS), a debilitating chronic disease that often occurs after viral infection. In research projects funded by the National Institutes of Health, scientists found specific changes to gut bacteria that were associated with ME/CFS patients. These changes could potentially be used as biomarkers to diagnose ME/CFS and as starting points for treatment. The new research also has potential implications for Long COVID, as many Long COVID patients meet the diagnostic criteria for ME/CFS.
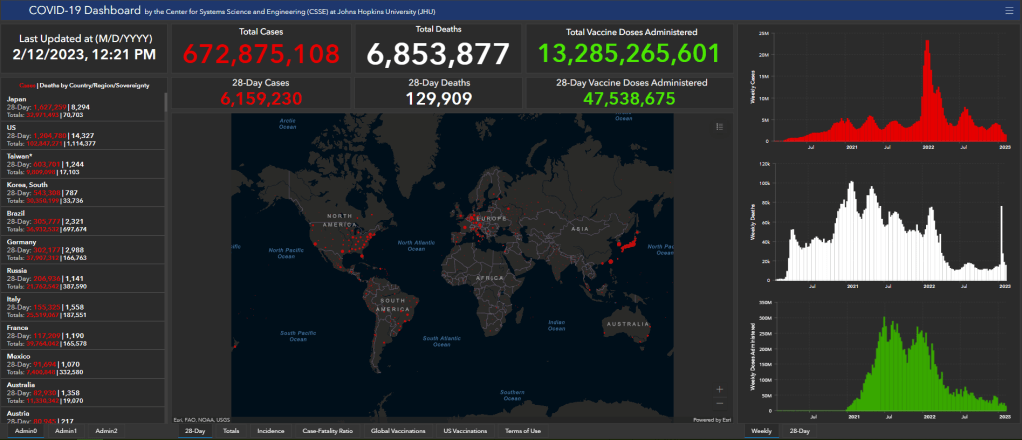
This week, two major COVID-19 tracking efforts announced that they will stop collecting data. While the decisions make sense in light of reduced data availability these days, this news still feels like a signal that fewer institutions want to spend time and resources on pandemic tracking.
The Johns Hopkins global dashboard and broader Coronavirus Resource Center is one of those shutting down. Its team plans to stop data collection and reporting on March 10, 2023. Johns Hopkins’ project was one of the very first COVID-19 trackers to come online in early 2020, filling a void when the CDC and other government agencies failed to provide the frequent, user-friendly updates people wanted.
Lauren Gardner, a Johns Hopkins professor who helped run the project, told NPR that its end is “bittersweet” but that “it’s an appropriate time to move on.” Other countries, as well as individual states and counties in the U.S. that the project used as data sources, are now updating their COVID-19 numbers less frequently and less reliably.
These reduced state and local updates are also one reason why the New York Times’ COVID-19 tracker will shut down, according to an update posted to the project’s GitHub repository this week. “As case and death reporting at the local level has become less frequent and comprehensive, the daily data we have been able to gather has become less useful for indicating real-time trends about the virus,” wrote NYT graphics editor Wilson Andrews.
The NYT’s COVID-19 dashboard will still get updated, according to Andrews’ GitHub note, but it will rely on the CDC and other federal data sources rather than compiling its own data. Andrews shared several key links where readers can find federal data, including the CDC’s main dashboard, the White House Community Profile Reports, and data pulled from death certificates. (H/t to Nicki Camberg for flagging the NYT announcement!)
It’s worth noting here that the COVID Tracking Project—for which I served as a volunteer—similarly pointed users to federal data sources when it shut down, nearly two years ago. Data from the CDC and HHS have improved significantly throughout the pandemic, to a point that these sources are likely more reliable than adding up numbers from individual states and localities. But federal data still suffer from case undercounting, lack of standardization (for some metrics), and other issues.
For my own updates at the COVID-19 Data Dispatch, I mostly use CDC data, along with wastewater surveillance data from a couple of outside sources (Biobot, WastewaterSCAN). So I get why places like Johns Hopkins and the NYT would want to point people to these sources, rather than spending time collecting their own data.
Even so, this feels like the end of an era for pandemic tracking: two giants of the field are shutting down. The announcements seem to suggest that people are no longer interested in learning about COVID-19 spread in their communities—even though, I can tell you from writing this newsletter, the audience is very much still present, and the work is very much still necessary.
And in case it needs to be said: the COVID-19 Data Dispatch isn’t going anywhere.
You might have seen some headlines like this in the last few weeks: COVID-19 was “mild” this winter. This winter was “better” than previous winters. COVID-19 is becoming “another seasonal virus” like flu and RSV. But is this true?
While it’s accurate that the U.S. reported fewer COVID-19 cases this past winter compared to last year (when the country experienced our first, massive Omicron surge) or the prior year (our biggest surge pre-vaccines), this winter still saw an extraordinary amount of severe illness, death, and potential future disability due to COVID-19. Surges of other respiratory viruses also put enormous strain on the healthcare system.
If we call this winter “mild,” we run the risk of believing this level of disease is acceptable. Such portrayals of COVID-19 seek to make us think future surges will be nothing to worry about, despite clear evidence to the contrary.
Let’s go through some numbers. Since the beginning of November, the U.S. has reported:
More than 5 million new COVID-19 cases (reported). Note that cases are likely underreported by 10 to 20 times in our era of under-testing, so the true number may be closer to 100 million.
More than 400,000 new COVID-19 hospitalizations, piling on top of hospitalizations for the flu, RSV, and other diseases, and coming as hospitals deal with staff shortages and worker burnout.
More than 40,000 new COVID-19 deaths, amounting to more than 400 new deaths per day. This number is also likely an undercount, as death certificates can take a long time to be processed.
The majority of COVID-19 deaths were among vaccinated people. A report from the Kaiser Family Foundation found that breakthrough deaths started to outnumber those among unvaccinated people in summer 2022, a trend that has continued with low booster uptake.
Coronavirus levels in wastewater were higher than all surges prior to Omicron, including the winter surge in 2020-2021 and the Delta surge in summer 2021, according to data from Biobot.
XBB.1.5, the latest and most contagious Omicron subvariant, evolved in the U.S. this winter, likely in New York State. Unchecked COVID-19 spread makes it easier for the virus to keep mutating.
More than 5% of American adults are currently experiencing Long COVID. This number has ranged from 5.5% to 7% since September 2022, according to the CDC and Census’ Household Pulse Survey.
Almost 80% of adults with Long COVID report activity limitations due to the condition, including about 25% who report “significant” activity limitations, per the Household Pulse Survey.
In an average week this winter, the U.S. reported more deaths from COVID-19 than the number of casualties on September 11, 2001. The latter event was a horrific tragedy that inspired lasting changes to national security, while the former has been written off as “mild.”
Past surveys from many sources—including the CDC itself—have suggested that, when people know COVID-19 is spreading widely in their communities, they’re willing to take basic safety precautions. But when government leaders and mainstream media outlets downplay the risks, people don’t have the information they need to make informed choices. We’ve seen this pattern at a large scale this winter, and I worry that the trend will only continue.
And here’s what concerns me even more: in previous winters, cases went up over the holidays, then declined through January and February. This year, however, the decline isn’t really happening. Transmission has gone down a bit from its peak, but it’s now plateaued at a level higher than the peaks of previous surges, per Biobot’s data.
So, not only did we have a bad surge this winter, we’re now stuck at a high-COVID baseline that seems very difficult to shake, in the era of many new variants and few public health precautions. The situation reminds me of a Twitter thread from the evolutionary biologist T. Ryan Gregory, which I shared when writing about XBB.1.5 in early January:
That said, I don't think "not as bad as the first Omicron wave" should be the standard. As noted, Canada, the UK, etc. had their deadliest year in 2022 through multiple Omicron waves. BA.1 was the highest peak, but the area under the curve of the others was as bad or worse. pic.twitter.com/5JwU857oHo
That “area under the curve” is what the U.S. is seeing now, as COVID-19 spread stays at high levels. Thousands of cases a day, thousands of hospitalizations a day, hundreds of deaths a day.
As a journalist and as an individual capable of taking precautions, I resist the narrative that any of this is acceptable. If you’re reading this, I hope you can, too.
National COVID-19 cases have reached a plateau. Note that the cases reported to the CDC are a significant undercount of actual infections.
In the past week (February 2 through 8), the U.S. officially reported about 280,000 new COVID-19 cases, according to the CDC. This amounts to:
An average of 40,000 new cases each day
86 total new cases for every 100,000 Americans
1% fewer new cases than last week (January 26-February 1)
In the past week, the U.S. also reported about 26,000 new COVID-19 patients admitted to hospitals. This amounts to:
An average of 3,700 new admissions each day
7.8 total admissions for every 100,000 Americans
6% fewer new admissions than last week
Additionally, the U.S. reported:
3,200 new COVID-19 deaths (450 per day)
75% of new cases are caused by Omicron XBB.1.5; 20% by BQ.1 and BQ.1.1; 1% by CH.1.1 (as of February 11)
An average of 80,000 vaccinations per day
Nationwide, COVID-19 spread appears to be in a plateau: not substantially increasing, but not substantially decreasing, either. Officially-reported cases dropped by only 1% this week compared to the week prior, while wastewater data shows that the coronavirus concentration in our sewage hasn’t changed significantly for the last month.
Hospitalizations continue to decline for flu and RSV as well as COVID-19, according to the CDC’s data from emergency departments. But the COVID-19 decline has slowed, remaining consistent at a higher level than the flu and RSV declines. About 3,700 people were newly hospitalized for COVID-19 every day last week.
At the regional level, COVID-19 spread is still declining (from a relatively higher winter peak) in the Northeast, and is solidly in a plateau in the South and West, per Biobot’s regional data. The Midwest reported a slight uptick this past week, continuing a trend that I noted in last weekend’s National Numbers.
Some of the highest case, wastewater, and hospitalization increases reported right now are coming from the upper Midwest: Montana, North Dakota, South Dakota, and Idaho. COVID-19 spread is also trending up in Alabama, Kansas, New Hampshire, and West Virginia, along with other states in the Midwest and South, per the latest Community Profile Report.
Omicron XBB.1.5, the latest and most contagious version of the virus, is spreading across these regions and may be contributing to increased cases. According to the CDC’s latest estimates, XBB.1.5 now accounts for more than half of new cases in every region of the country, and about 75% of new cases nationwide.
No other variants are trending up right now; XBB.1.5 has solidly outcompeted the rest of the “variant soup” in the U.S. Experts will doubtless be watching for this subvariant to further evolve, while we also look out for any new variants from other parts of the world.
Meanwhile, the daily average of new COVID-19 vaccinations in the U.S. has dropped under 100,000 for the first time since the country’s vaccination campaign started in winter 2020. New booster doses continue to be heavily underutilized.
CDC warns of risk to immunocompromised people: As of January 2023, there are no longer any monoclonal antibody treatments available for COVID-19, as these treatments do not provide protection against recent versions of Omicron. The no-longer-effective treatments include Evusheld, a drug used as a protective measure (to reduce risk of symptomatic COVID-19 for immunocompromised people. With Evusheld now unavailable, the CDC issued recommendations last week for people who have severely compromised immune systems. Of course, the CDC’s recommendations are largely targeted to individual action; to actually protet this vulnerable group, all Americans would need to follow collective public health measures.
Modeling COVID-19 as a persistent “endemic“: A recent preprint, from researchers at the drug company Fractal Therapeutics and collaborators, estimates just how challenging it is for people to avoid COVID-19 when the disease is not managed at a societal level. The researchers estimated Americans’ long-term COVID-19 risk based on an epidemiological model incorporating frequent reinfections, and limited individual-level protections. People who are vaccinated but don’t take other measures to reduce their risk of getting COVID-19 “can expect to spend an average of 6 days a year acutely sick with COVID-19 and also incur a 12% risk of long COVID (symptoms lasting more than 3 months),” the researchers write.
Global COVID-19 vaccination rate: Another new study, published in the CDC’s Morbidity and Mortality Weekly Report, provides an update on global vaccination rates, calculated by researchers at the World Health Organization. According to the WHO team, about 76% of older adults (ages 60 and older) have received a primary series of COVID-19 vaccines. (The study doesn’t report on booster rates, which are likely much lower worldwide.) As the vast majority of COVID-19 deaths worldwide have occurred among this age group, it should be a priority for vaccination, including the primary series and booster doses.
COVID-19 litigation database: I recently learned about this database of COVID-related legal documents, run by researchers at the University of Trento in Italy. The database aims to publish case documents from around the world reflecting challenges to COVID-19 policies. As of February 4, it includes documents from 1,978 cases, which can be searched by country, year, type of human rights issue, vulnerable group involved, and more.
Flu vaccine works well this year: A bit of non-COVID good news: this season’s flu vaccine is well-matched to the flu strain currently circulating in North America, according to a recent study from Canadian researchers and public health officials. Receiving a flu shot halved an individual’s risk of a severe flu case that needed medical care, the study found. Flu shots often have an effectiveness below 40%, explained STAT’s Helen Branswell on Twitter, as the vaccines do not always perfectly match up to circulating viral strains. But this year, the shot appears to be working well.
NYC declares end of mpox epidemic: And one more bit of good news: New York City officials have declared that the city’s epidemic of mpox (formerly called monkeypox) is now over. The city was a hub for mpox transmission last summer and became a center of the U.S. outbreak; but NYC has reported low case numbers since early fall. The federal public health emergency for mpox also recently ended.
This past Monday, the White House announced that the federal public health emergency for COVID-19 will end in May. While this decision might be an accurate reflection of how most of the U.S. is treating COVID-19 right now, it has massive implications for Americans’ access to tests, treatments, vaccines—and data.
Outside of a public health emergency, the CDC has limited authority to collect data from state and local health agencies. And even during the emergency, the CDC’s authority has been minimal enough that national datasets for some key COVID-19 metrics (like breakthrough cases and wastewater surveillance) have been very spotty.
When the federal emergency ends, the Department of Health and Human Services (HHS) may lose its ability to require reporting of some key data, including: PCR test results (from states), hospital capacity information and COVID-19 patient numbers (from individual hospitals), COVID-19 cases and deaths in nursing homes.
It’s possible that the HHS and/or CDC will negotiate new data reporting requirements with states and other entities that don’t rely on the public health emergency. They have about three months to do this. I haven’t seen much news on that yet, but I’ll keep an eye out and share updates as I find them.
Regardless, I expect that reporting COVID-19 numbers to federal data systems will become even more voluntary than it already is for health agencies, hospitals, congregate facilities, and other settings. We will likely have to rely more on targeted surveillance systems (which compile data from a subset of healthcare facilities) rather than comprehensive national datasets, similar to our current surveillance systems for the flu and other endemic diseases.
At the same time, the public health emergency’s end will lead to changes in the distribution of vaccines, tests, and treatments. The Kaiser Family Foundation has a helpful explanation of exactly what’s changing. Here are the highlights:
Vaccines will remain free to all as long as the stockpile of doses purchased by the federal government lasts. However, the ending emergency will likely impact the government’s ability to buy more vaccines—including future boosters that might be targeted to new variants. Vaccine manufacturers are planning to raise their prices, and cost will become a burden for uninsured and underinsured people.
At-home, rapid tests will no longer be covered by traditional Medicare, while Medicare Advantage coverage will vary by plan. Most private insurance providers will likely still cover the tests, but prices may go up (similarly to the prices for vaccines).
PCR tests are also likely no longer going to be covered by a lot of insurance plans and/or are going to get more expensive. Notably, Medicaid will continue covering both at-home and PCR tests through September 2024.
Treatments (primarily Paxlovid right now) will remain free for doses purchased by the federal government, similar to the situation with vaccines. After the federally-purchased supply runs out, however, we will similarly see rising costs and dwindling access.
In short, the end of the public health emergency will make it harder for Americans to get tested, receive treatments, and stay up to date with COVID-19 vaccines. The testing access changes, in particular, will lead to official case numbers becoming even less accurate, as fewer people seek out tests. At the same time, Americans will lose access to the data we need to know how much of a threat COVID-19 presents in the first place.
It’s also worth noting that, on the same day the White House announced the end of its emergency declaration, the World Health Organization announced the opposite: the global public health emergency is continuing, though it may end later in 2023. As Americans largely ignore COVID-19, millions of people around the world are unvaccinated, facing new surges, dealing with new variants, etc.
COVID-19 clearly remains a looming threat at the global level. In the U.S., we technically have the best vaccines and treatments to deal with the disease—but these tools are going underutilized, and the Biden administration’s decision this week will only make it harder for people to get them. Maybe we shouldn’t have to rely on an emergency declaration to get basic data and access to health measures in the first place.
This week, I had a new article published in The Atlantic about how COVID-19 wastewater surveillance can be useful beyond entire sewersheds, the setting where this testing usually takes place. Sewershed testing is great for broad trends about large populations (like, an entire city or county), the story explains. But if you’re a public health official seeking truly actionable data to inform policies, it’s helpful to get more specific.
My story focuses on one wastewater testing setting that’s been in the news a lot lately: airplane bathrooms, from which researchers can identify new variants arriving with international travelers. But airplanes are far from the only place where specific wastewater surveillance can be valuable. Here are some of those other places, highlighting some information that I learned in reporting this story (but couldn’t fit in the final article).
K-12 schools
Early in the pandemic, colleges and universities became a hub for wastewater surveillance innovation. At campuses like Columbia University in NYC, researchers tested the sewage at individual dorms in order to determine exactly which students were getting sick—and take quick action, usually by requiring students at the infected dorm to get PCR-tested and quarantining the people who tested positive.
But the same technique can apply to schools with younger students. In late 2020, the University of California San Diego expanded its testing program to elementary schools, in an initiative called the Safer at School Early Alert System. The program started with 10 schools in the 2020-21 school year, then expanded to 26 in the 2021-22 year. Wastewater testing at specific sewershed points next to the schools led researchers to identify asymptomatic COVID-19 cases with high accuracy, program leader Rebecca Fielding-Miller told me.
The San Diego program isn’t alone: other public school systems have tried out building-level wastewater testing, usually in collaboration with nearby research groups. While the research projects tend to successfully show that wastewater surveillance can pick up infections, it’s challenging for school systems to get the funding to do these programs long-term. (Unlike universities, which are in total control of their funding, public schools need to rely on local governments).
As a consequence of these funding challenges, the San Diego program wasn’t renewed for the 2022-23 school year. “We really would have wanted to keep doing it, but funding ran out,” Fielding-Miller said.
Hospitals, other healthcare facilities
Much of the U.S.’s health strategy throughout the pandemic has focused on keeping hospitals from becoming overwhelmed—or at least helping hospitals weather COVID-19 surges. Wastewater surveillance can help accomplish this, by giving hospital administrators warnings about potential increased transmission; wastewater trends usually predict hospitalization trends by a week or more. And when wastewater surveillance is happening at hospitals themselves, these warnings can be really specific.
At NYC Health + Hospitals, the city’s public hospital system, administrators can get these warnings from wastewater testing at the system’s eleven hospitals. The surveillance program includes weekly tests for COVID-19, flu, and mpox (formerly called monkeypox), in collaboration with local researchers. The resulting data “gives us better situational awareness,” said Leopolda Silvera, a global health administrator at Health + Hospitals. If the health system notices a coming surge at one hospital, they can adjust resources accordingly—such as sending more staff to the emergency department.
The Health + Hospitals wastewater program has been running for about a year, Silvera said. At this point, it’s the only program she knows of that does building-level surveillance at hospitals. In the future, the hospital system might start testing for other pathogens and health threats like antimicrobial resistance.
Congregate facilities
Congregate facilities like nursing homes and senior living facilities can include a lot of vulnerable people who are at higher risk for severe COVID-19, all living in close quarters. As a result, this is another category of settings where it could be helpful to have building-level wastewater surveillance: facility administrators could learn quickly about upcoming surges and respond, by doing widespread PCR testing or instituting a temporary mask mandate.
The state of Maryland used to have a program doing exactly this, with a focus on correctional facilities throughout the state—particularly facilities housing the most vulnerable residents. The wastewater surveillance program ran through May 2022, at which point it “quietly ended,” according to local outlet the Maryland Daily Record. An initial $1 million in funding for wastewater testing in Maryland ran out; while the CDC National Wastewater Surveillance System picked up testing at wastewater treatment plants, no new entity was able to continue testing at the congregate living facilities.
According to the Daily Record, the building-level wastewater testing was incredibly helpful for informing COVID-19 measures at correctional facilities and helped keep cases down. I hope the Maryland program isn’t the last example we see of this testing in the U.S.
Large, communal workplaces
Early in the pandemic, some of the U.S.’s worst COVID-19 outbreaks happened at factories, particularly large food processing plants. People in these settings are often working in close quarters, easily able to infect each other—and when an outbreak happens, there are ramifications for both individual employees and the company’s business.
These large facilities could be another target for wastewater surveillance: if company administrators see a warning about rising COVID-19 from their buildings’ sewage, they could institute basic public health measures to curb the spread. Such is the strategy for some mine companies in rural Canada, which work with biotech company LuminUltra to test their wastewater. People often live and work at these sites, making them relatively closed settings for transmission.
At these locations, COVID-19 was previously “kind-of out of control, clinical testing was very reactive,” said Jordan Schmidt, director of product applications at LuminUltra. With wastewater testing, the mining companies can keep outbreaks “to a handful of people.” Fewer people get sick and there’s less interruption to business, he said.
Neighborhood-level testing
As public health agencies face lower budgets and overall lower awareness about COVID-19, some officials want to maximize their limited resources. If you only have the funding and staff for two mobile PCR testing sites this week, you’d want to make sure they go to a neighborhood where the testing would be most helpful, right?
The Boston Public Health Commission had this goal in mind when they launched a new neighborhood-level wastewater testing program, in collaboration with Biobot Analytics. The program includes testing twice a week at 11 sites across Boston, selected to provide good coverage of the city and also enable testing without too much disruption to traffic. While testing just started in January, the program is already helpful for identifying specific COVID-19 patterns, said Kathryn Hall, deputy commissioner for the health agency.
Boston’s program is focused on COVID-19 right now, but could expand to other diseases as needed, Hall said: “Now that we have the infrastructure in place, it allows us to be really be prepared and also to ask novel and interesting questions.”
Airplanes
Airplane surveillance fits into a slightly different category than the other settings I described here. When researchers test airplane wastewater, they aren’t seeking to get advanced warnings of new surges or inform public health policies. Instead, the goal is to track variants—with a focus on any new coronavirus mutations that might come into the U.S. from abroad. (Read the Atlantic story for more details on how this works!)
Other transportation hubs could be useful for tracking variants too, experts told me. This could mean large train stations, bus stations, shipping ports—any location that involves a lot of people moving from one place to another. After all, variants can evolve in the U.S. as easily as they can in other parts of the world.
Overall, the specific wastewater testing settings described here could be valuable pieces of expanding the U.S.’s overall surveillance network, along with the more-traditional sewershed testing. But all these testing sites need sustained funding to actually provide valuable data in the long run, something that could be in jeopardy as the federal public health emergency ends.
In the past week (January 26 through February 1), the U.S. officially reported about 280,000 new COVID-19 cases, according to the CDC. This amounts to:
An average of 40,000 new cases each day
86 total new cases for every 100,000 Americans
7% fewer new cases than last week (January 19-25)
In the past week, the U.S. also reported about 27,000 new COVID-19 patients admitted to hospitals. This amounts to:
An average of 3,900 new admissions each day
8.4 total admissions for every 100,000 Americans
8% fewer new admissions than last week
Additionally, the U.S. reported:
3,500 new COVID-19 deaths (500 per day)
66% of new cases are caused by Omicron XBB.1.5; 27% by BQ.1 and BQ.1.1; 2% by CH.1.1 (as of February 4)
An average of 100,000 vaccinations per day
COVID-19 spread in the U.S. continues to decline—but the decline continues to get slower, following the trend that I wrote about last week. Official COVID-19 cases, hospital admissions, and wastewater surveillance all indicate decreased transmission, leading into potential plateaus.
New hospital admissions for COVID-19, for example, decreased by 8% this week (ending February 1) compared to the prior week (ending January 25). This is a smaller decrease than the prior two weeks, when admissions went down by 13% and 18%. Overall, new hospitalizations are at a similar level to what the U.S. faced in early summer 2022, as BA.5 started spreading across the country.
Wastewater surveillance from Biobot suggests that COVID-19 spread is decreasing in all four major regions. But the decrease is steeper in the Northeast and South than it is in the Midwest and West coast, suggesting potential plateaus in the latter regions. Wastewater data from the CDC continues to show decreased transmission in about half of sites reporting to the agency and increased transmission in the other half.
Where is COVID-19 spread increasing right now? Some northern Midwest states are reporting the most significant upticks. According to the latest Community Profile Report, new COVID-19 hospitalizations went up last week in South Dakota, Idaho, and Minnesota. Wastewater monitoring sites in Idaho and Minnesota also reported increased coronavirus concentrations, according to the WastewaterSCAN project.
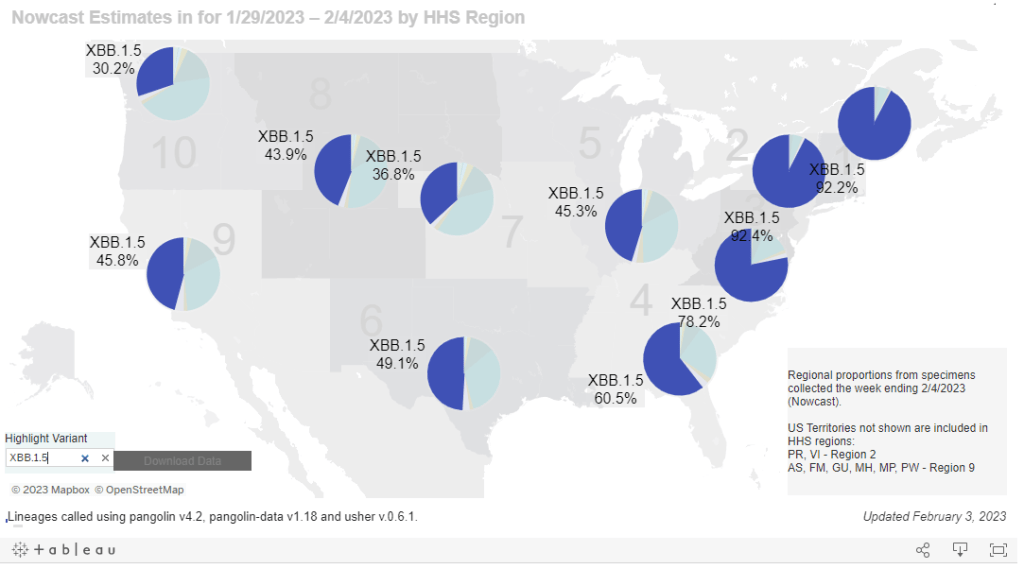
In the Midwest and West coast, Omicron subvariant XBB.1.5 continues to outcompete other versions of the virus. Per the CDC’s estimates, it accounted for about 44% of new cases in the region including the Dakotas and Minnesota this week, compared to 32% last week. XBB.1.5 already dominates the East coast, so its rise in the rest of the country could be one reason why COVID-19 is starting to go up again.
Nationally, XBB.1.5 caused about two-thirds of new COVID-19 cases in the U.S. last week, according to the CDC’s estimates. It’s the only variant on the rise right now, as it drives out the BQ lineage and others. CH.1.1, the subvariant currently spreading fast in the U.K. and other countries, is less of a threat in the U.S. so far (at under 2% of new cases).
While XBB.1.5 contributes to new infections across the country, the number of Americans who’ve received an updated booster shot remains stubbornly low. Only 52 million people have received the Omicron-specific booster, representing just 20% of the eligible population, according to CDC data.