
I recently bought a carbon dioxide monitor, and have been using it to collect data in my apartment and other places. In the week since I’ve been monitoring, I’ve noticed how personal data collection like this can be helpful in identifying ventilation issues, but comes with many caveats.
You might have seen photos of these devices on Twitter or in news articles; they’ve become an increasingly popular way to measure ventilation in public spaces, as a proxy for potential risks of COVID-19 spread. The basic theory is that CO2 builds up more in spaces where there’s not a lot of clean air circulation. So, when you see higher CO2 readings, that indicates less clean air coming in, which likely means COVID-19 and other viruses could be hanging around for longer, too. Higher CO2 is also correlated with other health risks, like headaches and diminished neurological function.
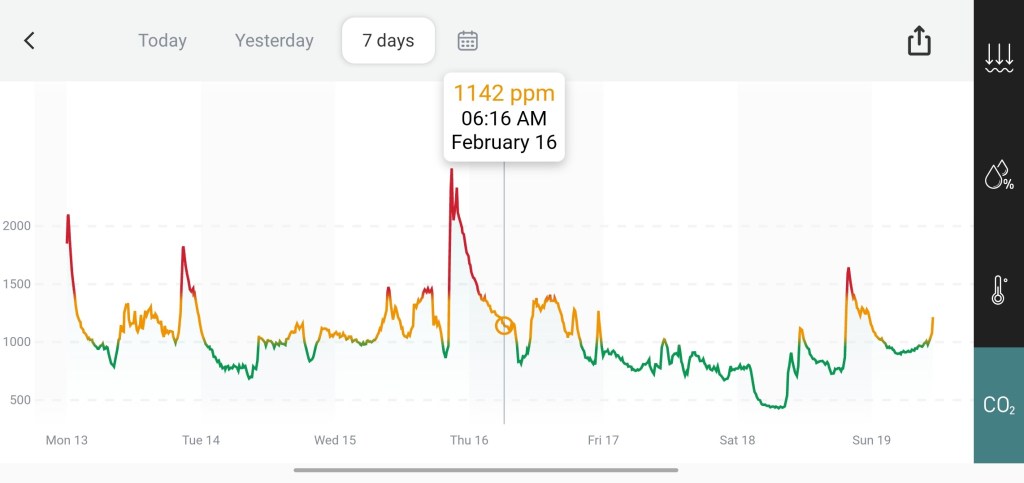
My CO2 monitor has mostly lived on the desk in my home office for the last week, with a couple of outings (to the park near my apartment, on the subway, etc.). I’ve been surprised by how much CO2 varies even in this one spot. A few observations:
- The highest peaks of CO2 concentration usually correspond with cooking, since my kitchen has a gas stove. Even though my desk is across the apartment from the stove, the gas is still enough to send the meter above 1,500 ppm or higher.
- CO2 concentration also tends to increase when there’s more conversation in the room, such as me doing Zoom interviews or talking to my partner, who shares the home office. (Talking puts more particles into the air than just breathing.)
- CO2 concentration tends to drop when the room is empty and/or when the electric heater is turned off, leading to lowest levels overnight. (Our apartment has electric heating/cooling units instead of older-school radiators, and my desk sits right underneath the one in the office. Do these units expel CO2? I need to do more research here.)
- Opening the office’s window usually corresponds with a decrease in CO2 concentration, though not as significant a decrease I’d expect given that the CO2 concentration outside is much lower—around 400 to 500 ppm. Perhaps opening the window further would lead to improvements, but it’s too cold in New York City to test that right now.
Of course, it’s hard to explain every single uptick and downturn in the CO2 monitor’s readings. I also have to acknowledge that a device I can buy for $250 on the internet is far from perfect; it has quirks and errors that will take me much longer than a week to fully understand. Still, I’m enjoying this small-self experiment into my environment.
Overall, the CO2 monitor has shown me and my partner that our apartment is not particularly well-ventilated. The CO2 concentrations in our office often range from 1,000 to 1,400 ppm, which indicates poor airflow. (Under 1,000 ppm is generally considered a safe level.) I’ve taken the meter on the subway a couple of times, and found that subway cars may even have lower CO2 than our office, if the car isn’t too crowded.
We were already thinking about buying an air filter for the apartment, and the CO2 results add some urgency to this task. Also, the next time we move, we’re going to look for places without gas stoves—often a challenging task when you’re renting in New York City, but there are some options.
Have you used a CO2 monitor, or tried to upgrade the ventilation in your home? I’d love to hear from you about it: comment below or reach out via email.

Leave a comment