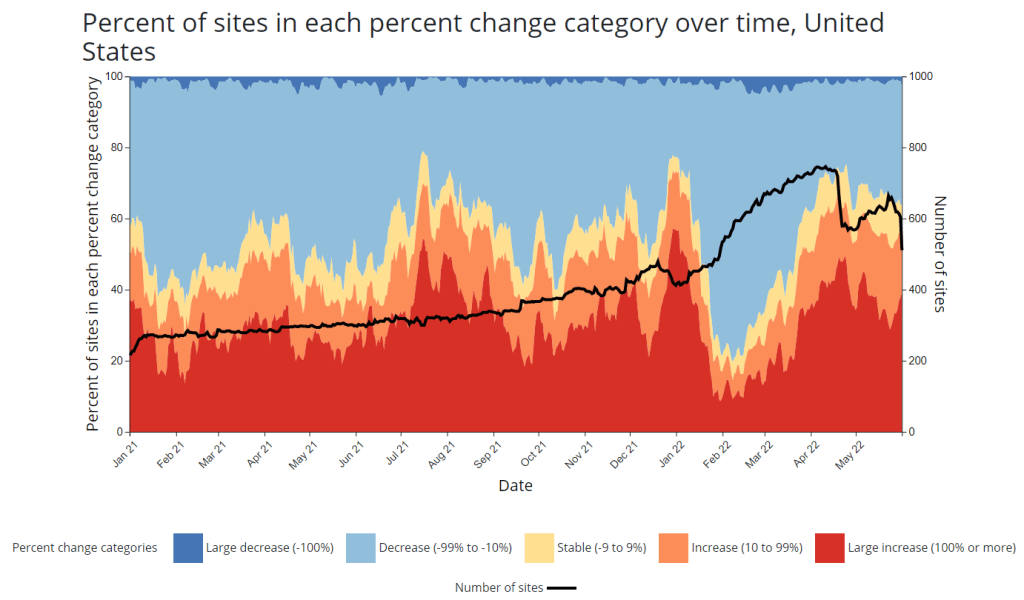

- CDC adds new chart to wastewater dashboard: This week, the CDC updated its National Wastewater Surveillance System (NWSS) dashboard with a new chart that aims to summarize the overall picture of coronavirus trends in the country’s sewers. The chart shows the percentage of NWSS sites that have reported their coronavirus concentrations decreasing, staying stable, and increasing over two-week periods; it also shows the overall number of sites with recent data. (This number dropped when NWSS switched contractors, though it has ticked back up in recent weeks as Biobot onboards sites.) Of course, the sites included in NWSS represent a small fraction of the U.S. population, and different locations are using different analysis methods which may be difficult to summarize. But the new chart is still a helpful way to see national trends from the surveillance network.
- Preprint suggests 30x scale of case underreporting: Last week, researchers from the City University of New York (CUNY) shared striking results from a study in which they’d surveyed about 1,000 New York City residents about their COVID-19 status during two weeks of the BA.2/BA.2.12.1 surge. The sample was designed to represent the broader city population, and residents could self-report positive test results on both PCR and at-home rapid tests as well as possible symptoms and contact with infected people. About 22% of the survey respondents had a coronavirus infection during the study period (April 23 to May 8), the researchers found. The study hasn’t been peer-reviewed and should be interpreted with caution, but still: it could indicate that one in five New Yorkers got COVID-19 within two weeks. Official case counts were 30 times lower, the researchers found, reflecting massive underreporting; and NYC has more access to PCR testing than many other places.
- CDC study demonstrates disproportionate COVID-19 impact on Native Americans: One study from the CDC’s Morbidity and Mortality Weekly Report (MMWR) that caught my attention this week: researchers in Alaska (at the state’s health agency and tribal health institutions) examined COVID-19 rates for the state’s indigenous population. They found that the age-adjusted COVID-19 case rate among Native Americans/Alaska Natives was about twice as high as the rate among white people living in Alaska, and the death rate was about three times higher. Many indigenous people in Alaska live in rural, remote areas, some inaccessible by car, which heightens the challenges of accessing healthcare.
- Native American life expectancy fell during the pandemic: Another related preprint: researchers at Virginia Commonwealth University, the University of Colorado Boulder, and the Urban Institute have produced multiple studies examining how life expectancy changed during the pandemic. In general, COVID-19 led to massive decreases in life expectancy across the board; but the latest update from this group showed that Native Americans were particularly hard-hit. Native American life expectancy dropped by 4.7 years, compared to a 2.1 drop for the white American population. Steven Woolf, corresponding author, discussed the study in a Q&A with Virginia Commonwealth University. (H/t Andrew Stokes.)
- Higher burden of COVID-19 in developing countries: And one more notable new study, published this week in BMJ Global Health: a group of researchers at institutions in the U.S., Australia, Brazil, and other countries conducted an in-depth review of global COVID-19 serology data to estimate the disease’s true infection and fatality rates across the world. The researchers found that infection fatality rates (i.e. the share of infected people who die of COVID-19) were much higher in developing/low-income countries than in developed/high-income countries, in some cases up to three times higher. “The results are, in a word, depressing,” lead author Gideon Meyerowitz-Katz wrote in a Twitter thread discussing the study.
- New job posting at CDC forecasting center: The CDC’s new Center for Forecasting and Outbreak Analytics, formally launched in April, has posted a job opening for (at least one?) data scientist. Considering that the center plans to hire 100 scientists and science communicators, this singular posting is likely just one of many more opportunities to come.

Leave a comment