Most states report some variation on the same COVID-19 vaccination metrics: doses allocated, doses administered, state residents who’ve been partially and fully vaccinated, and so on. But some states go beyond those basics.
This week, I’m showing some appreciation for:
- Washington D.C.: Reports numbers of District residents who have stuck to their second dose appointments. The dashboard’s “Adherence” tab includes those who are fully vaccinated, waiting on their second dose appointment, or more than a week overdue for that second dose appointment—both District-wide and by ward.
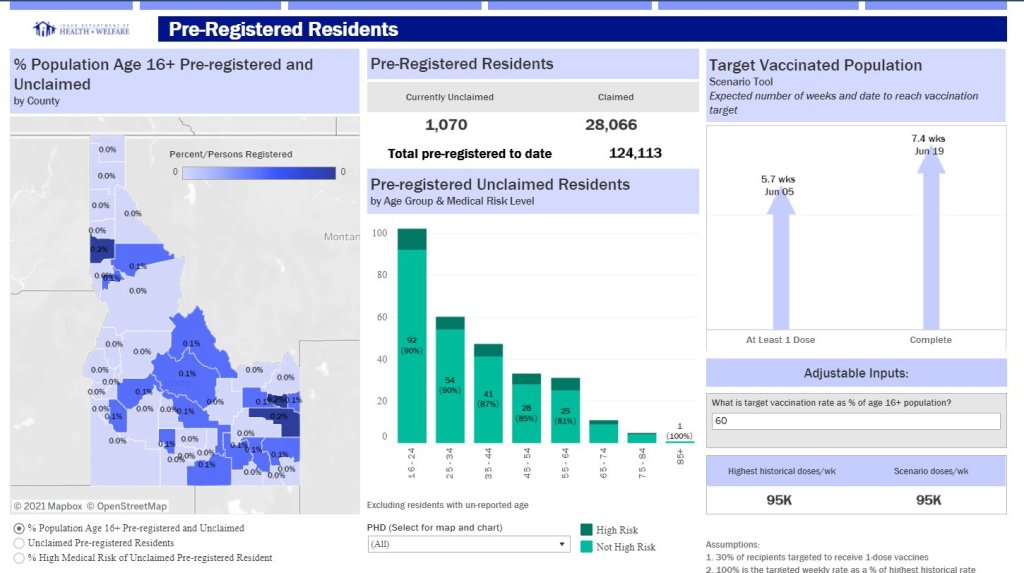
- Idaho: Reports detailed data on state residents who have pre-registered for appointments. On the “Pre-registered residents” tab, you can see how many people have claimed their pre-registered appointments, as well as breakdowns of the pre-registered residents by county, age, and medical risk level.
- Illinois: Reports both a count of unusable vaccine doses and information on vaccine breakthrough cases. The “unusable” vaccine doses count includes doses that have been discarded, dropped, or had some other issue in the storage and handling process. For vaccine breakthroughs, Illinois reports total patients hospitalized and died due to COVID-19 after vaccination.
- New Hampshire: Reports counts of vaccine doses distributed and administered by individual vaccination sites, such as hospitals and public health networks. (New Hampshire includes vaccination data once a week in its COVID-19 news reports, usually on Thursdays. The state figures differ significantly from CDC-reported numbers, for as-yet-undetermined reasons.)
As always, you can find the CDD’s full set of annotations on national and state vaccine data sources here.

Leave a comment