In the interest of giving credit to the HHS where credit is due: the agency updated its new facility-level hospitalization dataset right on schedule this past Monday.
This dataset allows Americans to see exactly how COVID-19 is impacting individual hospitals across the country. In last week’s issue, I explained why I was excited about this dataset and what researchers and reporters could do with it. (The highlights: hyperlocal data that can be aggregated to different geographies, a time series back to August, demographic information on COVID-19 patients, and HHS transparency.)
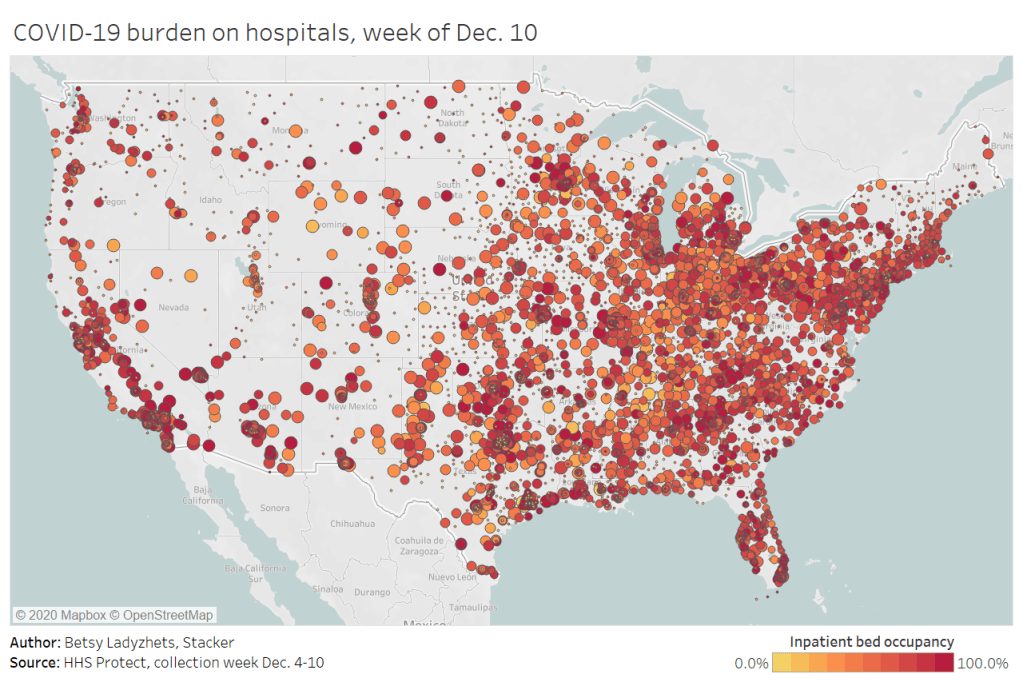
Last week, I used this hospitalization dataset—along with the HHS’s state-level hospitalization data—to build several visualizations showing how COVID-19 has hit hospitals at the individual, county, and state levels.
I also wrote a brief article on COVID-19 hospitalizations for Stacker, hosting visualizations and highlighting some major insights. The article was sent out to local journalists across the country via a News Direct press release. (If your outlet wants to repurpose Stacker’s article, get in touch with my coworker Mel at melanie@thestacker.com!)
A few national statistics:
- Nearly 700 hospitals are at over 90% inpatient capacity, as of the most recent HHS data. 750 hospitals are at over 90% capacity in their ICUs.
- The states with the highest rates of occupied beds are Maryland (79.8% of all beds occupied), Washington D.C. (80.0%), and Rhode Island (85.2%).
- States with the highest shares of their populations hospitalized with COVID-19 are Arizona (53 patients per 100,000 population), Pennsylvania (55 per 100K), and Nevada (67 per 100K).
- 19% of hospitals in the nation are facing critical staffing shortages, while 24% anticipate such a shortage within the next week.
- Staffing shortages are highest in Arkansas (33.6% of hospitals in the state), Wisconsin (35.6%), and North Dakota (42.0%).
Meanwhile, The Accountability Project has developed a datasette version of this hospitalization dataset. With a bit of code, you can query the data to access metrics for a specific hospital, city, county, or state. The Project has provided example queries to help you get started.

Leave a comment