The county-level testing dataset published by CMS has become a regular topic for this newsletter since it was released in early September. As a refresher for newer readers: CMS publishes both total PCR tests and test positivity rates for every county in the country; the dataset is intended as a resource for nursing home administrators, who are required to test their residents and staff at regular intervals based on the status of their county.
This past Monday, October 5, I was pleasantly surprised to find a new update posted on CMS’ COVID-19 data page. I say “surprised” because I had been led to believe, both by past dataset updates and by reporting when the dataset was first published, that this source would be updated once every two weeks. And yet, here was a new update, with only one week’s delay (the last update before this was on Monday, September 28). CMS is also now posting weekly updates on an Archive page which goes back to August 19; some of these updates are older, while others were posted or edited in the past week.
I always appreciate more frequent data, even when the data provider in question is not particularly transparent about their update strategy. Frequent updates are particularly useful for testing data; the nursing home administrators monitoring testing in their counties will be able to see information that better reflects the level of COVID-19 risk around them.
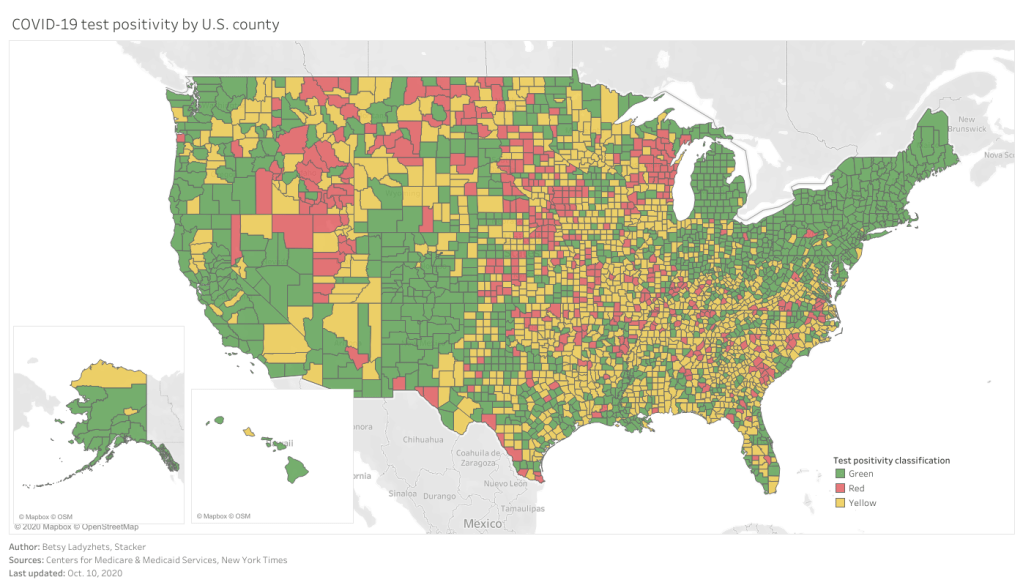
I’ve updated my Tableau dashboard which visualizes these county-level data:

As you can see, the majority of the Northeast and much of the West Coast continues to be in the green (positivity rates under 5%), while areas in the South and Midwest are not faring so well. Twelve counties have extremely high positivity rates (over 30%), eleven of which are in Midwestern states. This table allows you to rank and sort the test positivity rates by state.
Also, a note on my methodology for this dashboard: in earlier iterations, I used state-level data from the COVID Tracking Project to calculate state test positivity rates for the same time period as the CMS has provided county-level rates. I then compared the county-level rates against state-level rates; this was the source of the “[x]% above state positivity rate” tooltips on the dashboard. After reading a new COVID Tracking Project blog post about the challenges of calculating and standardizing positivity rates, however, I realized that combining positivity rates from two different sources might misrepresent the COVID-19 status in those counties. So, I switched my method: the county-to-state comparisons are now based on averages of all the CMS-reported county-level positivity rates in each state.
Finally, out of curiosity (and to practice my Tableau skills), I compared the CMS-reported test positivity rates for the five counties of New York City to the city-level rate reported by the NYC Department of Health.
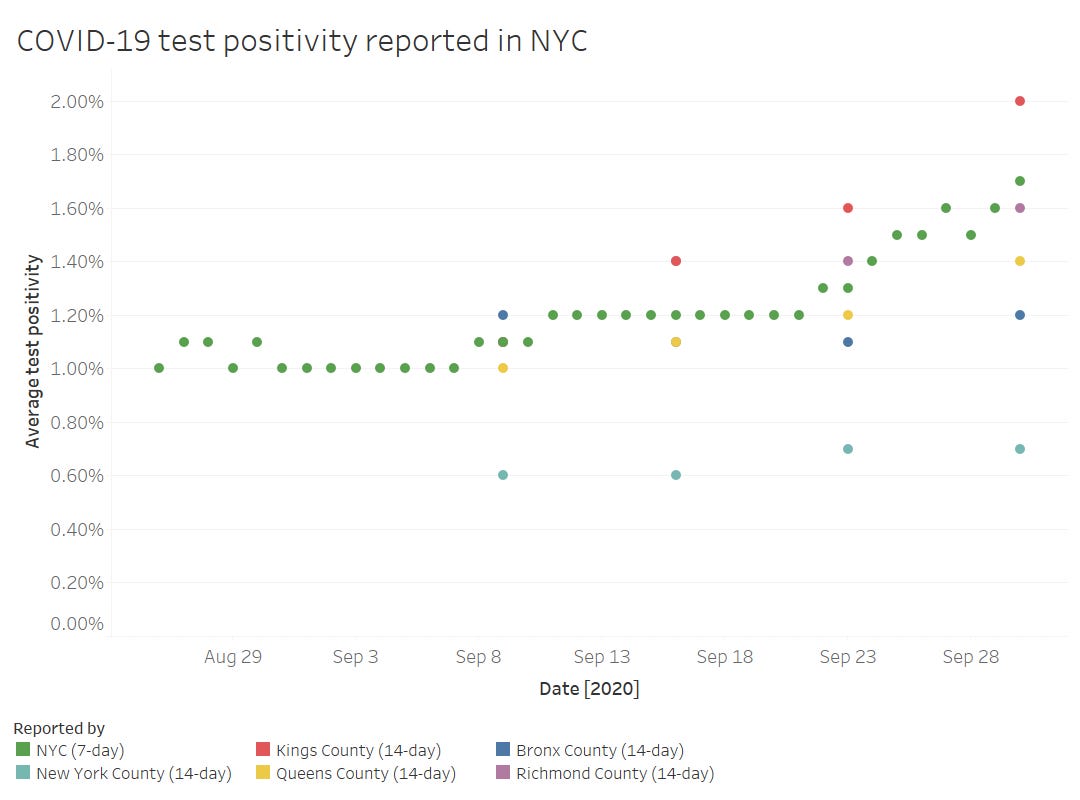
The positivity rates reported by the two sources follow the same general direction, but it’s interesting to see how the rates diverge when the five counties split up. Manhattan remaining far below 1% while Brooklyn surges up to 2%? Not surprising.
Meanwhile, CMS is cracking down on COVID-19 reporting from hospitals: NPR reported this week that hospitals which fail to report complete, daily data to HHS can lose money from Medicare and Medicaid, starting this coming January.

Leave a comment