New Mexico reports COVID-19 death demographics in a way that makes me suspect they have it out for us at the COVID Racial Data Tracker specifically.
The state occasionally includes race and ethnicity information for deaths in its Modeling Updates, released once a week. I say “occasionally” because there is no rhyme or reason to when this key demographic information makes it into the update. And there is also no rhyme or reason to how these data are presented:

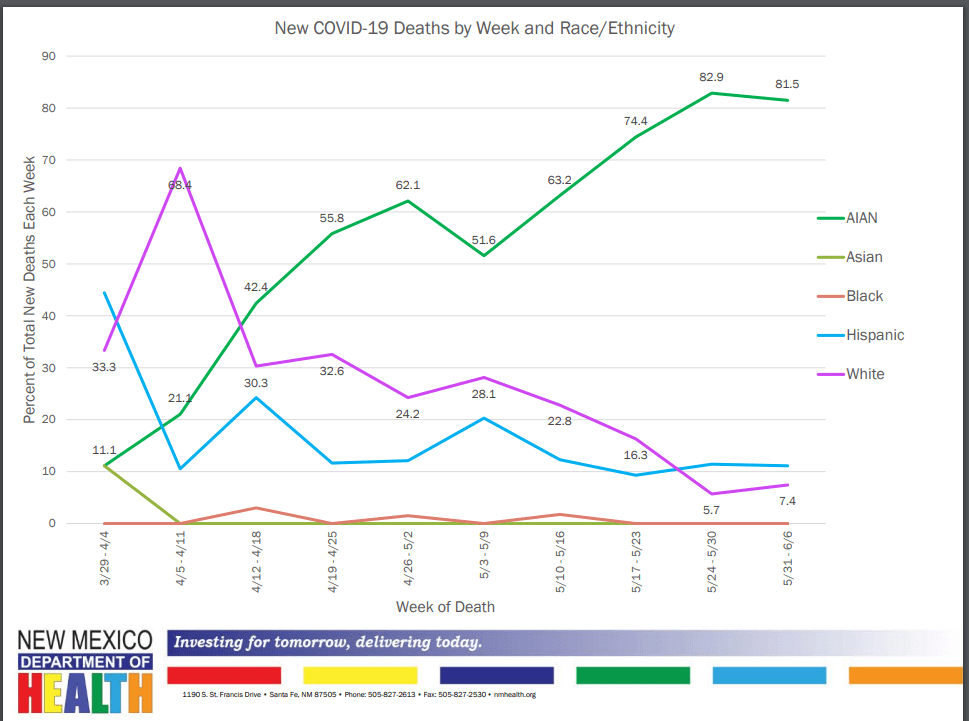
This chart is from the Modeling Update released on June 9. Yes, you’re reading it right: those are percentages, expressed in a line chart. Some of the points don’t even have data labels.
New Mexico’s newest Modeling Update, released this past Tuesday, has shown a slight improvement in the state’s data presentation: the percentages are now expressed in bar charts, and total deaths for each racial group are included below the graph. (See page 20 of the PDF.) Still, in order to present a complete picture of how COVID-19 is impacting minorities in New Mexico, the state must release these data regularly and include precise figures.

Leave a comment